Curso de
D3JS

www.devcode.la
v1

www.devcode.la

www.devcode.la
www.devcode.la
Podras..
- Crear visualizaciones propias.
- Entender las bases de D3JS.
- Aprender bases de SVG.
- Un paso para al mundo de Data Science
www.devcode.la
Objetivos
- Comprender los conceptos clave de D3Js.
- Crear visualizaciones de datos.
- Aprender a seleccionar y manipular datos
- Asociar datos
- Usar escalas en las representaciones
www.devcode.la
metodología
- Clases grabadas.
- Sistema de discusiones.
- Código en GitHub.
- Proyecto.
www.devcode.la
requisitos
- Bases en Html
- Bases en Javascript.
- Bases en Css.
www.devcode.la
materiales
- Chrome
- VSCode
- Node (npm)
www.devcode.la
Módulos
- Módulo 1: Introducción a D3Js
- Módulo 2: Trabajando con SVG.
- Módulo 3: Escalas y ejes.
- Módulo 4: Interacciones.
- Módulo 5: Proyecto
www.devcode.la

www.devcode.la
Módulo 1
www.devcode.la
¿DATA VIZ?
es el proceso de búsqueda, interpretación, contrastación y comparación de datos que permite un conocimiento en profundidad y detalle de los mismos de tal forma que se transformen en información comprensible para el usuario
Wikipedia
www.devcode.la
www.devcode.la
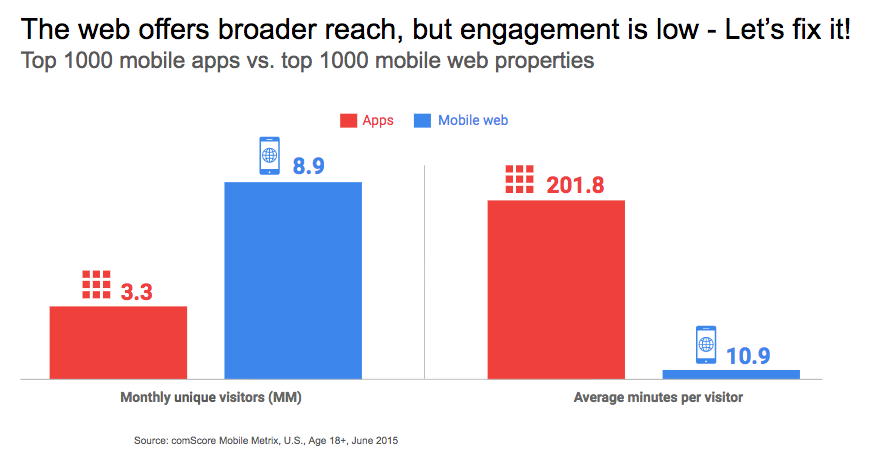
Between 10:00pm and midnight, people wind down for the day, shifting from leisure to personal care and eventually going to sleep.
www.devcode.la

http://flowingdata.com/2015/12/15/a-day-in-the-life-of-americans/
www.devcode.la
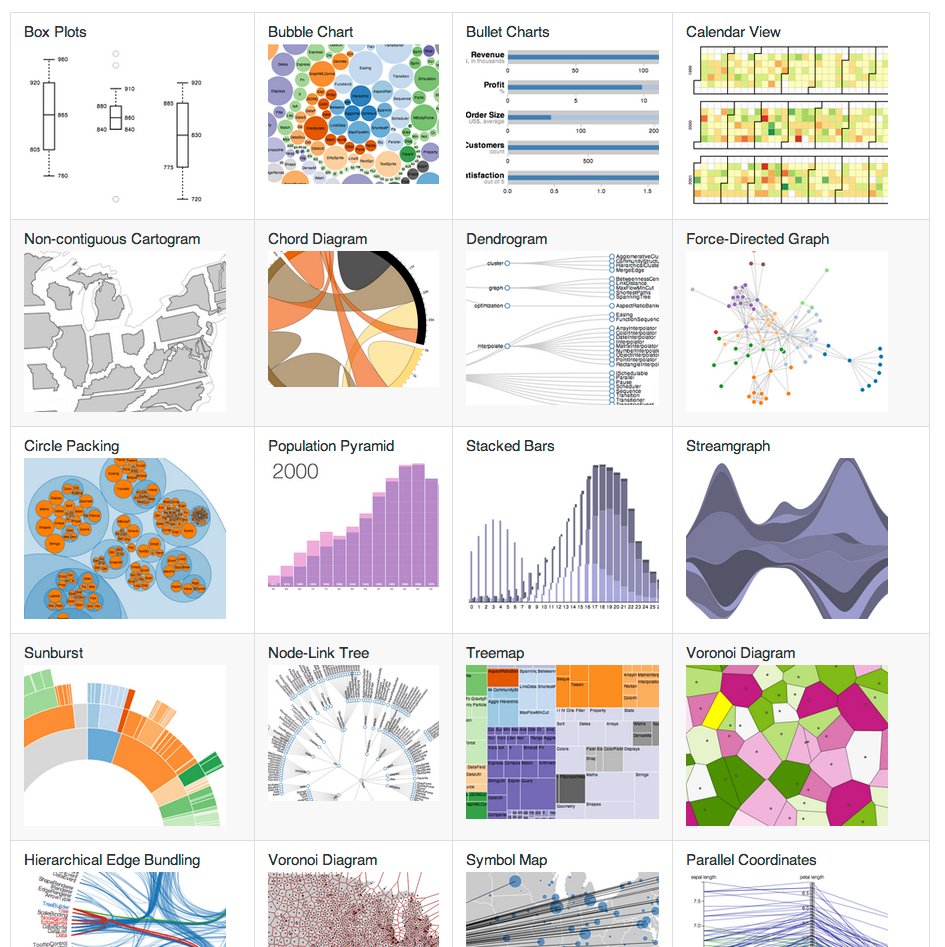
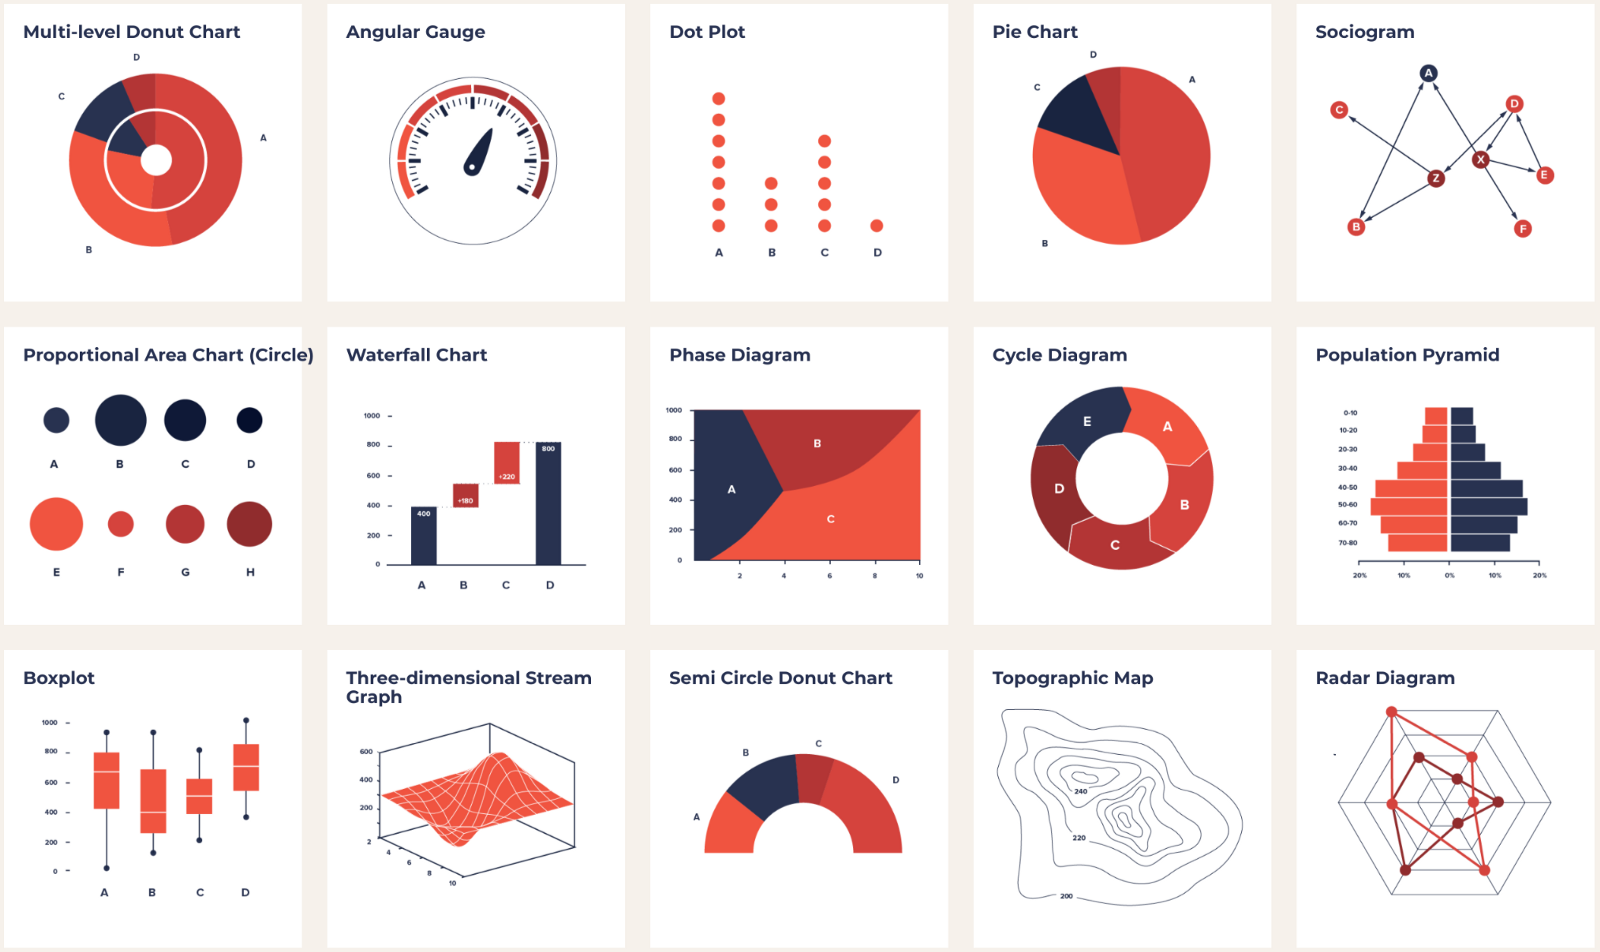
http://datavizproject.com/
www.devcode.la
www.devcode.la
www.devcode.la
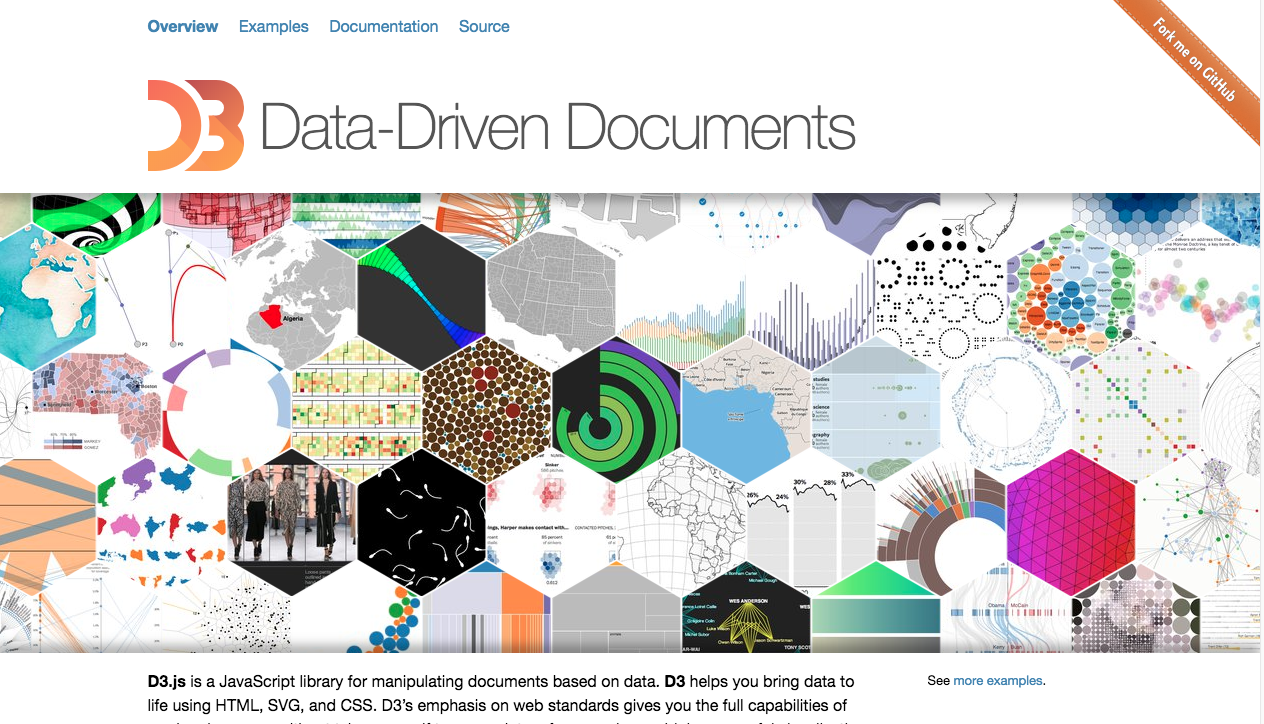
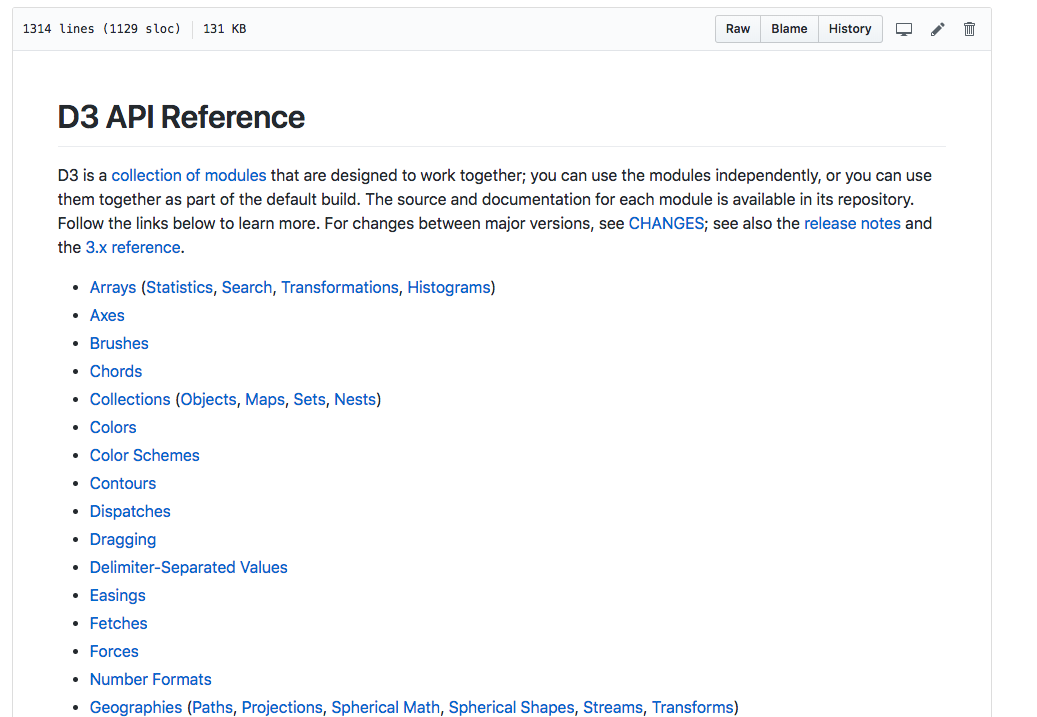
D3 (Documentos controlados por Datos o *D3.js) por sus siglas en Inglés (Data-Driven Documents or D3.js) es una biblioteca de JavaScript para visualizar datos utilizando estándares web.
www.devcode.la


www.devcode.la
www.devcode.la
Proyecto
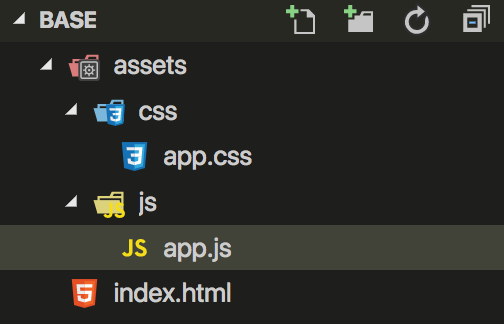
www.devcode.la
http-server

www.devcode.la
bulma css

www.devcode.la
Selección y manipulación
www.devcode.la
www.devcode.la
  const title = d3.select('h1');
  title.style('color', 'red')
  .attr('class', 'my-class')
  .text(title.text() + ' change  text');

  const body = d3.select('body');
  body.append('p').text('text 1');
  body.append('p').text('text 2');
  body.append('p').text('text 3');


  const texts = d3.selectAll('p');
  texts.style('color', 'blue');
www.devcode.la
carga y Asociación de datos
www.devcode.la
const dataset = [1, 2, 3, 4, 5];

d3.select('body')
    .selectAll('p')
    .data(dataset)
    .enter()
    .append('p')
    .text((item) => item * 2);
www.devcode.la
oBTENER DATOS CON FETCH
www.devcode.la
document.addEventListener("DOMContentLoaded", (event) => {
    fetch('URL')
    .then((response) => response.json())
    .then((data) => {
      // Tranform data
      const values = // code
      drawChart(values);
    })
    .catch((err) => console.log(err));
});
www.devcode.la
MÓDULO 2
www.devcode.la
¿svg?
Gráficos vectoriales escalables, o Gráficos vectoriales redimensionables (del inglés Scalable Vector Graphics) o SVG es un formato de gráficos vectoriales bidimensionales, tanto estáticos como animados, en formato XML, cuya especificación es un estándar abierto desarrollado por el W3C desde el año 1999.
Wikipedia
www.devcode.la


www.devcode.la
- http://snapsvg.io/
- https://ionicons.com/
- https://webkul.github.io/vivid/
www.devcode.la
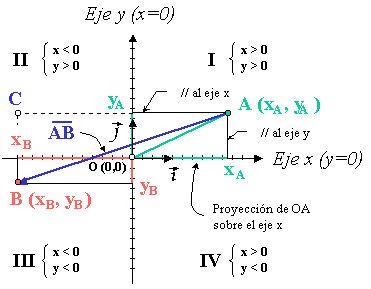
coordenadas

www.devcode.la
rect
<rect
    x="0"
    y="0"
    width="400"
    height="50"/>
www.devcode.la
CIRCLE
<circle
    cx="250"
    cy="250"
    r="25" />
www.devcode.la
ellipse
<ellipse
    cx="250"
    cy="350"
    rx="100"
    ry="25"/>
www.devcode.la
TEXT
<text x="250" y="200">
    D3JS
</text>
www.devcode.la
LINE
 <line
    stroke="gray"
    stroke-width="10"
    x1="250"
    y1="50"
    x2="5"
    y2="500" />
www.devcode.la
PATH
<path
    d="M150 50 L75 200 L225 200 Z"/>
www.devcode.la
PATH
- M = moveto
- L = lineto
- H = horizontal lineto
- V = vertical lineto
- C = curveto
- S = smooth curveto
- Q = quadratic Bézier curve
- T = smooth quadratic Bézier curveto
- A = elliptical Arc
- Z = closepath
www.devcode.la
PATH
<path
  d="M 100 350 q 150 -300 300 0"
  stroke="blue"
  stroke-width="5"
  fill="none" />
www.devcode.la
STYLES
- fill = color
- stroke = color
- stroke-width = unidad
- opacity = 0 - 1
www.devcode.la
STYLES
<circle
    cx="25"
    cy="25"
    r="22"
    fill="yellow"
    stroke="orange"
    stroke-width="5"/>
www.devcode.la
STYLES
.pumpkin {
    fill: yellow;
    stroke: orange;
    stroke-width: 5;
}
www.devcode.la
LAYERS
<rect x="0" y="0" width="30" height="30" fill="purple"/>
<rect x="20" y="5" width="30" height="30" fill="blue"/>
<rect x="40" y="10" width="30" height="30" fill="green"/>
<rect x="60" y="15" width="30" height="30" fill="yellow"/>
<rect x="80" y="20" width="30" height="30" fill="red"/>
www.devcode.la
PIE-CHART
www.devcode.la
PIE-CHART
1. GET DATA
2. SIZE
3. PIE, PATH & COLORS
4. DATA BINDING & DRAW
5. LABELS
www.devcode.la
1. get data
const URL = 'http://api.population.io:80/1.0/population/2017/Colombia/';

  document.addEventListener("DOMContentLoaded", (event) => {
    fetch(URL)
    .then((response) => response.json())
    .then((data) => {
      const dataset = data
      .filter(item => item.age >= 10 && item.age <= 15)
      .map((item)=> {
        return {
          name: `${item.age} (${item.total})`,
          value: item.total
        }
      });
      drawChart(dataset);
    })
    .catch((err) => console.log(err));
  });
www.devcode.la
2. SIZE
const svgWidth = 400;
const svgHeight = 400;
const radius = Math.min(svgWidth, svgHeight) / 2;

const svg = d3.select('#chart')
  .attr('width', svgWidth)
  .attr('height', svgHeight);

const g = svg.append('g')
  .attr('transform', `translate(${radius}, ${radius})`);
www.devcode.la
3. Pie, path & colors
const pie = d3.pie()
  .value((data) => data.value);

const path = d3.arc()
  .outerRadius(radius)
  .innerRadius(0);

const colors = d3.scaleOrdinal(d3.schemeCategory10);
www.devcode.la
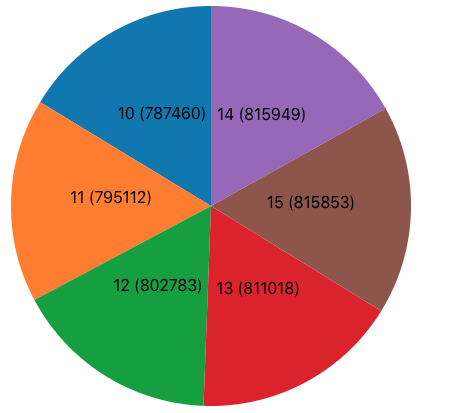
3. Pie, path & colors
www.devcode.la
4. DATA BINDING & DRAW
const chart = g.selectAll('g')
  .data(pie(dataset))
  .enter()
  .append('g');

chart.append('path')
  .attr('d', path)
  .attr('fill', (data) => colors(data.value));
www.devcode.la
5. LABELS
chart.append('text')
  .attr('text-anchor', 'middle')
  .attr('transform', (item) => `translate(${path.centroid(item)})`)
  .text((item) => item.data.name);
www.devcode.la
5. LABELS
www.devcode.la
MÓDULO 3
www.devcode.la
bar-chart
www.devcode.la
bar-CHART
1. MAKE DATA
2. SIZE
3. DRAW RECTS
www.devcode.la
1. MAKE DATA
const dataset = [
      {
        name: 'Valor 1',
        value: 100
      },
      {
        name: 'Valor 2',
        value: 200
      },
      {
        name: 'Valor 3',
        value: 300
      },
      {
        name: 'Valor 4',
        value: 400
      }
    ];
www.devcode.la
2. sIZE
const svgWidth  = 400;
const svgHeight = 400;
const barPadding = 5;
const barWidth = ( svgWidth / dataset.length );

const svg = d3.select('#chart')
.attr('width', svgWidth)
.attr('height', svgHeight);
www.devcode.la
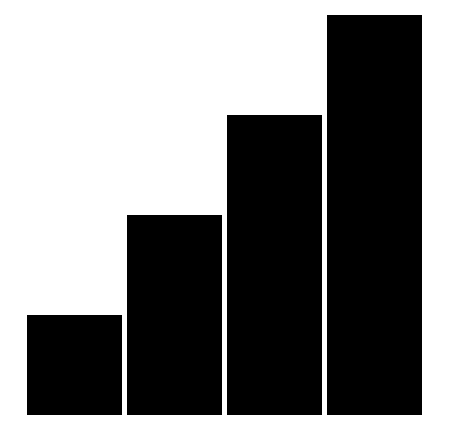
2. DRAW RECTS
const barChart = svg.selectAll('rect')
.data(dataset)
.enter()
.append('rect')
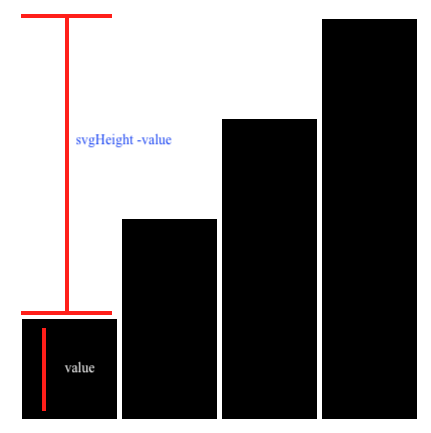
.attr('y', (item) => svgHeight - item.value)
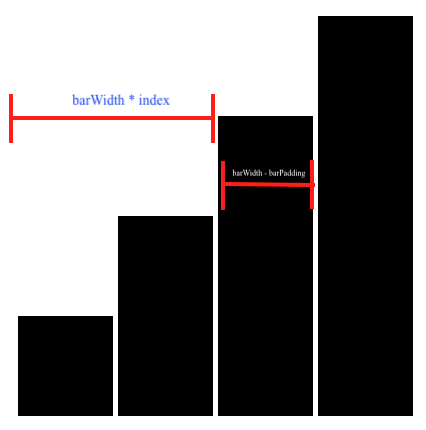
.attr('x', (item, index) => barWidth * index)
.attr('height', (item) => item.value)
.attr('width', barWidth - barPadding);www.devcode.la
2. DRAW RECTS
www.devcode.la
2. DRAW RECTS
www.devcode.la
escalas
La escala gráfica es la representación dibujada en un plano o mapa de la escala unidad por unidad, donde cada segmento muestra la relación entre la longitud de la representación y el de la realidad.
Wikipedia
www.devcode.la
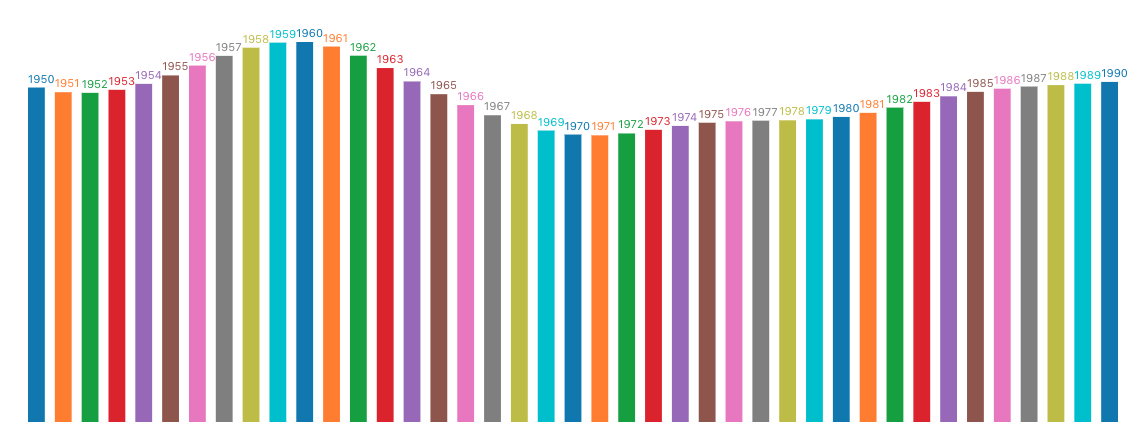
add yScale
const yScale = d3.scaleLinear()
    .domain([0, d3.max(dataset)])
.range([0, svgHeight]);www.devcode.la
add yScale
const barChart = svg.selectAll('rect')
    .data(dataset)
    .enter()
    .append('rect')
    .attr('y', (item) => svgHeight - yScale(item.value))
    .attr('x', (item, index) => barWidth * index)
    .attr('height', (item) => yScale(item.value))
    .attr('width', barWidth - barPadding);
www.devcode.la
add labels and colors
const colors = d3.scaleOrdinal(d3.schemeCategory10);

const labels = svg.selectAll('text')
.data(dataset)
.enter()
.append('text')
.text((item) => `${item.name} (${item.value})`)
.attr('y', (item) => (svgHeight - yScale(item.value)) - 5)
.attr('x', (item, index) => barWidth * index)
.attr('fill', (item) => colors(item.value));
www.devcode.la
GET DATA
www.devcode.la
AXIS
www.devcode.la
AXIS
www.devcode.la
AXIS
const xScale = d3.scaleLinear()
    .domain([0, d3.max(dataset)])
    .range([0, svgWidth]);

const yScale = d3.scaleLinear()
  .domain([0, d3.max(dataset)])
  .range([svgHeight, 0]);
www.devcode.la
AXIS
const x_axis = d3.axisBottom()
  .scale(xScale);

const y_axis = d3.axisLeft()
  .scale(yScale);
www.devcode.la
AXIS
svg.append('g')
  .attr('transform', 'translate(50, -20)')
  .call(y_axis);

svg.append('g')
  .attr('transform', `translate(50, ${svgHeight - 20})`)
  .call(x_axis);
www.devcode.la
www.devcode.la
MÓDULO 4 Y 5
www.devcode.la
www.devcode.la
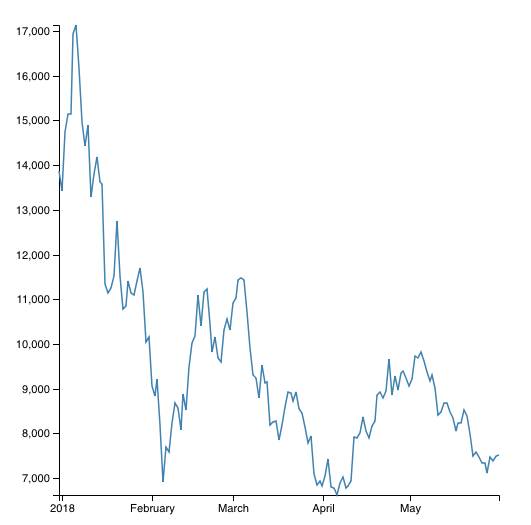
1. fetch DATA
const api = 'https://api.coindesk.com/v1/bpi/historical/close.json?start=2017-12-31&end=2018-06-01';

document.addEventListener("DOMContentLoaded", (event) => {
fetch(api)
.then((response) => response.json())
.then((data) => {
  const values = Object.keys(data.bpi)
  .map(key => ({
    name: new Date(key),
    value: data.bpi[key]
  }));
  drawChart(values);
})
.catch((err) => console.log(err));
  });
www.devcode.la
2. DRAW SVG
const svgWidth = 500;
const svgHeight = 500;
const margin = { top: 10,  left: 50, right: 10, bottom: 10 };
const width = svgWidth - ( margin.left + margin.right );
const height = svgHeight - ( margin.top + margin.bottom );

const svg = d3.select('svg')
  .attr('width', svgWidth)
  .attr('height', svgHeight);

const g = svg.append('g')
      .attr('transform', `translate(${margin.left}, ${margin.top})`);
www.devcode.la
3. sCALES
const xScale = d3.scaleTime()
  .domain(d3.extent(dataset, (item) => item.name))
  .rangeRound([0, width]);

const yScale = d3.scaleLinear()
  .domain(d3.extent(dataset, (item) => item.value))
  .rangeRound([height - 10, 0]);
www.devcode.la
4. DRAW LINE
const line = d3.line()
  .x(item => xScale(item.name))
  .y(item => yScale(item.value));
www.devcode.la
5. DRAW LINE
g.append('g')
  .attr('transform', `translate(0, ${height - margin.top})`)
  .call(d3.axisBottom(xScale));

g.append('g')
  .call(d3.axisLeft(yScale));

g.append('path')
  .datum(dataset)
  .attr('fill', 'none')
  .attr('stroke', 'steelblue')
  .attr('stroke-linejoin', 'miter')
  .attr('stroke-linecap', 'miter')
  .attr('stroke-width', 1.5)
  .attr('d', line);
www.devcode.la
www.devcode.la
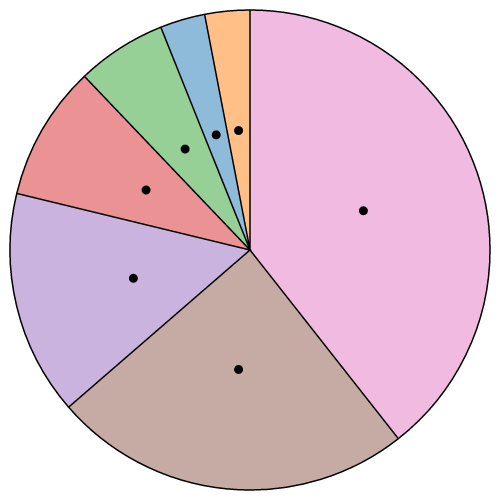
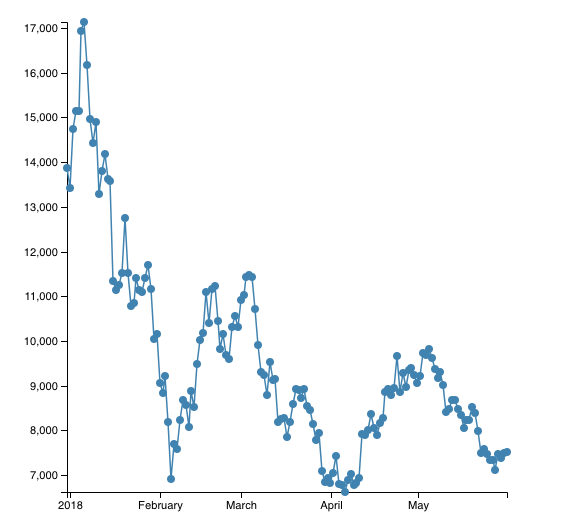
DRAW points
g.selectAll('circle')
  .data(dataset)
  .enter()
  .append('circle')
  .attr('class', 'dot')
  .attr('fill', 'steelblue')
  .attr('cy', (item) => yScale(item.value) )
  .attr('cx', (item) => xScale(item.name) )
  .attr('r', 4);
www.devcode.la
.on('mouseover', function (item) {
     // code
})
.on('mouseout', function (item) {
    // code
});
www.devcode.la
www.devcode.la
d3.csv(URL, (item) => item)
.then((data) => {
   console.log(data);
});
www.devcode.la
Curso de D3.js
By devcodela


