DevLeague Coding Bootcamp
DevLeague is a Full Stack Coding Bootcamp
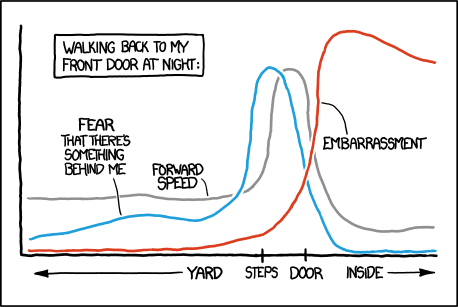
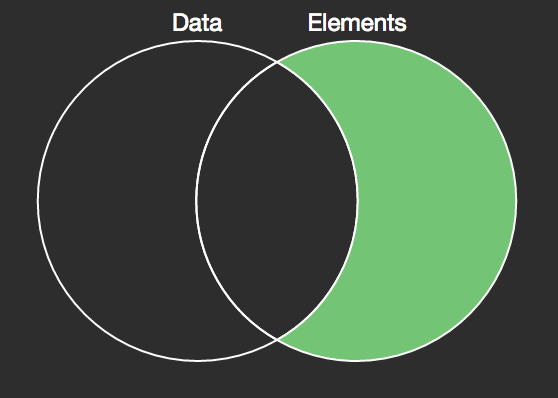
Data Visualization is the presentation of data in a visually compelling way (like pictures or graphs)
Remember, data is just... data.
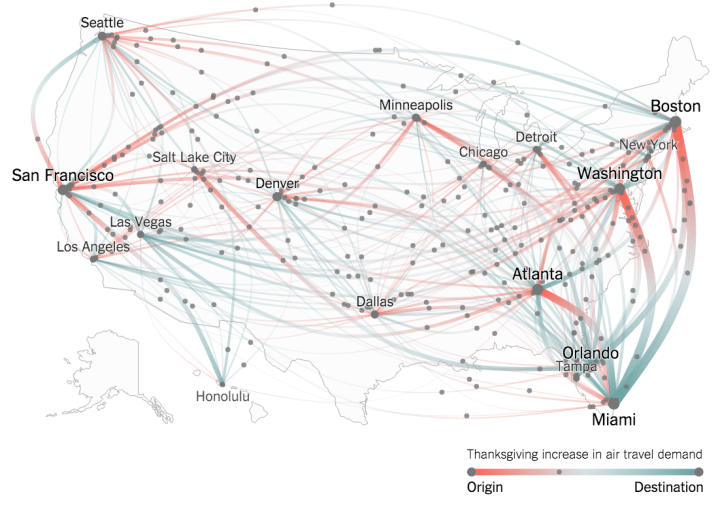
It's when we present data to in a purposeful way to identify certain patterns/concepts is when it becomes information
not really
Like this?
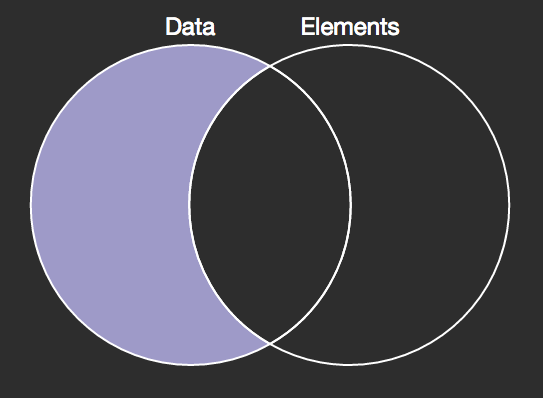
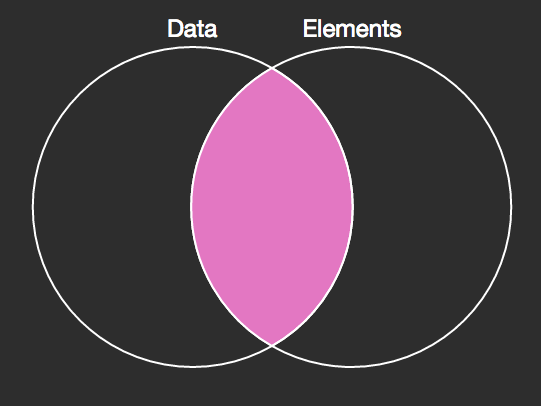
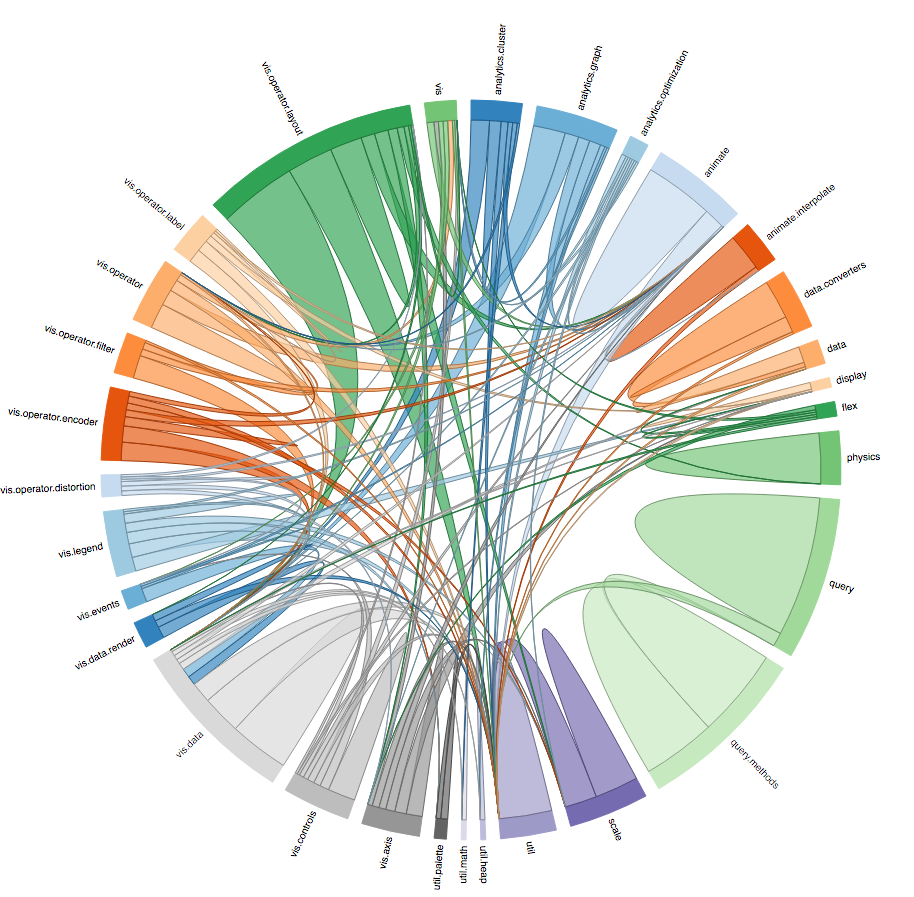
D3 allows you to bind arbitrary data to a Document Object Model (DOM), and then apply data-driven transformations to the document
Cons:
Pros:
#foo        // <any id="foo">
foo         // <foo>
.foo        // <any class="foo">
[foo=bar]   // <any foo="bar">
foo.bar     // <foo class="bar">
foo#bar     // <foo id="bar">
Selections returned are always Arrays containing DOM elements.
This method finds and returns a single element, the selection they act upon.
// returns first descendant DOM element found
let chart = d3.select('.chart');


// returns first descendant DOM element found
let dev = d3.select('div');
selector is a CSS-Selector style string, e.g. 'p', '.class', or '#unique-identifier'
// returns all <p> DOM elements
let paragraphElements = d3.selectAll('p');

// returns all elements that have .bars as a class value
let bars = d3.selectAll('.bars');
This method finds and returns a single element, the selection they act upon.
selector is a CSS-Selector style string, e.g. 'p', '.class', or '#unique-identifier'
Using .select() and .selectAll()
on selections returned by previous d3 selections
// get a selection
let paragraphElements = d3.select('.chart');

// use .selectAll() on the previous selection, yea!
let bars = paragraphElements.selectAll('.bars');

// example of chaining selection methods
let tableRows = d3.select('.my-table').selectAll('tr');
// return value from d3.select() or d3.selectAll()
// will be referred to as 'selection' from this point on

let selection = d3.select('.chart');
let selection2 = d3.selectAll('p');
/** using .filter with CSS-Selector style
 *
 * select all <tr> elements of '.my-table' element and
 * filter out odd rows returning only even rows
 *
**/
let paragraphElements = d3.select('.my-table')
    .select('tr')
    .filter(':nth-child(even)');
/**
 *
 * using .filter with a function
 * `d` argument is each <tr> element found
 * `i` argument is the index position of the current `d`
 *
**/
let paragraphElements = d3.select('.my-table')
    .select('tr')
    .filter(function(d, i) {
        return i % 2 === 0;
    });
// UPDATE
var circle = svg.selectAll("circle").data(data)
    .style("fill", "blue");

// EXIT
circle.exit().remove();

// ENTER
circle.enter().append("circle")
    .style("fill", "green")
    .merge(circle) // ENTER + UPDATE
.style("stroke", "black");more clarity when we talk about data-joining
var circle = svg.selectAll("circle").data(data)
    // `d` is the data
    // `i` is the index position of the current `circle` element inside of the group selection
    // `nodes` is the group selection of all `circle elements
    .style("fill", function(d, i, nodes) {
        return
    });
3 Arguments:
`d` - data value mapped to element
`i` - index of current element
`nodes` - entire group of elements
let paragraphElements = d3.select('.my-table')
    .selectAll('tr')
    .filter('nth-child(even)')
    .attr('even-row', 'true'); // each <tr> gets the same value
value can be a constant value
e.g. "a-helpful-label".
value can be a function when you need a computed value instead of a constant value.
let data = [
    {
        name: 'Pie',
        votes: 1337
    },
    {
        name: 'Cake',
        votes: 2593
    }
];

let paragraphElements = d3.select('.my-table')
    .selectAll('tr')
    .data(data)
    .append('tr')
    .attr('name', function(d, i, nodes) {

        // attach a value based on the data bound(or will be bound) to the element
        return data.name;
    });
let paragraphElements = d3.select('.my-table')
    .selectAll('tr')
    .filter('nth-child(even)')
    .style('background-color', 'salmon'); // each <tr> gets the same value
prop must be a String of a valid CSS property for the element.
value can be a constant value e.g. "#000FFF" or "30px".
caveat: use .style() when you need a value through computation otherwise add a class to the element and take advantage of CSS (through external stylesheet).
value can be a function when you need a computed value instead of a constant value.
let data = [
    {
        name: 'Pie',
        votes: 100
    },
    {
        name: 'Cake',
        votes: 150
    }
];

let paragraphElements = d3.select('.my-table')
    .selectAll('tr')
    .data(data)
    .append('tr')
    .style('background-color', function(d, i, nodes) {

        // <tr> elements with larger votes data will
        // appear "more red" then ones will a lower vote count
        return `rgb(${d.votes + 100}, 0, 0)`;
});use this for properties in which you cannot set with .attr(). A checkbox element's `checked` property is one example, another is an input field's `value` property.
value can be a constant value e.g. "#000FFF" or "30px".
let data = [
    {
        name: 'Pie',
        votes: 100
    },
    {
        name: 'Cake',
        votes: 150
    }
];

let paragraphElements = d3.select('.chart')
    .selectAll('div')
    .data(data)
    .append('div')
    .style('background-color', function(d, i, nodes) {
        return `rgb(${d.votes + 100}, 0, 0)`;
    })
    .text(function(d) {
        // compute name via `name` property of the data bound
        // to element
        return d.name;
});value can be a constant value e.g. "div" or a Function.
// usual use case
d3.selectAll("p").append('div');


// same as above
d3.selectAll("p").append(function() {
  return document.createElement("div");
});

// same as above
d3.selectAll("p").append(function() {
  return this.appendChild(document.createElement("div"));
});
This method, after appending, will return the appended elements as a selection.
// select all <section> elements
var section = d3.selectAll("section");

// add an <h1> element to each <section>
var h1 = section.append("h1");
// .append() returns all <h1> elements
h1.text("Hello!");removes the selection from the DOM
// removes all <p> elements from within the '.chart' element
d3.select('.chart').selectAll("p").remove();


// remove single element '#legend' from within the '.chart' element
d3.select('.chart').select("#legend").remove();(RTFM)
Selections return Arrays of DOM elements
Data should be an Array
Coincidence? No.
// an array of numbers works
let data = [1, 2, 3, 4, 5, 6];
// A scatterplot, perhaps?
var data = [
{x: 10.0, y: 9.14},
{x: 8.0, y: 8.14},
{x: 13.0, y: 8.74},
{x: 9.0, y: 8.77},
{x: 11.0, y: 9.26}
];Instead, it provides a pattern for managing the mapping from data to elements. The way to create elements from scratch is a special case of the more generalized form.
svg.selectAll("circle")
    .data(data)
    .enter()
    .append("circle")
    .attr("cx", x)
    .attr("cy", y)
    .attr("r", 2.5);
We want the selection “circle” to correspond to data.
New data, for which there were no existing elements.
When initializing data you may omit update and exit patterns
// <circle> is empty. .data() attempts to
// bind each datum to a <circle> element.
// at first there are no <circle> elements
// so the leftover data will be passed to .enter() below

let circle = svg.selectAll("circle")
    .data(data);

// calling .append() on .enter() will create new elements
// for data leftover from the .data() joining above.

circle.enter().append("circle");
New data that was joined successfully to an existing element.
    let circle = svg.selectAll("circle")
        .data(data)
        .attr('cy', (data) => {
            return data.y;
        })
        .attr('cx', (data) => {
            return data.x;
        })
        .attr("r", 2.5);
When updating data you may omit enter and exit patterns
Existing elements, for which there were no new data.
    let circle = svg.selectAll("circle")
        .data(data)
        .attr('cy', (data) => {
            return data.y;
        })
        .attr('cx', (data) => {
            return data.x;
        })
        .attr("r", 2.5);

    // elements leftover, if any,
    //   will be available at .exit()
    // you can use .remove()
    // you can also add transitions here
    circle.exit().remove();
When updating data you may omit enter and update patterns
    <!DOCTYPE html>
    <html lang="en">
    <body>

        <div class="bar-chart"></div>

        <script src="..path/to/file.js"></script>
    </body>
    </html>
    let data = [
        {name: 'pizza', votes: 7},
        {name: 'salad', votes: 16},
        {name: 'Ahi Bowl', votes: 9},
        {name: 'Soup', votes: 4},
        {name: 'Pirosky', votes: 3}
    ];
    let chart = d3.select('.bar-chart')
        .selectAll('div')
        .data(data)
        .enter().append('div')
        .style('width', (d) => {
            return d.votes;
        })
        .text((d) => {
            return d.name;
        });
Test code before moving on!
// select the parent element for the chart
let chart = d3.select('.bar-chart')
    // ..of that selection, bind data to existing <div> elements
    .selectAll('div')
    .data(data)

    // data which needs NEW elements are passed to .enter()
    // .append() creates a new element and binds data to it
    .enter().append('div')

    // ...now we can style all <div> elements
    // based on the bounded data
    .style('width', (d) => {
        return d.votes;
    })
    .text((d) => {
        return d.name;
});D3 uses SVGs to create and modify graphical elements to visualize our data into something more meaningful to viewers.
We can use SVG's to make anything from circles to triangles, and lines to bar charts!
By DevLeague Coding Bootcamp


