


Dhrumil Mehta
Database Journalist, Politics @ FiveThirtyEight
(1) Please make and display your name cards!
(2) Make sure you're on Slack:
https://ledeprogram.slack.com/
(3) Keep PollEverywhere open
If you have any questions, just raise your hand 🖐!
Welcome! Let's get rolling!
- Homework Review: Feedback / Comments
- Pair Programming: Assignment 2 / 3
- Short Lecture: Interrogating data and avoiding pitfalls
- Pitch Sharing: Let's explain our pitches to one another
Homework Review: Decoding Feedback
https://docs.google.com/document/d/1VIWR76f-EPa_3gOUv2F1DlIZvpONntoLyxK8cOwfKd0/edit
Homework Review: Decoding Feedback
https://docs.google.com/document/d/1VIWR76f-EPa_3gOUv2F1DlIZvpONntoLyxK8cOwfKd0/edit
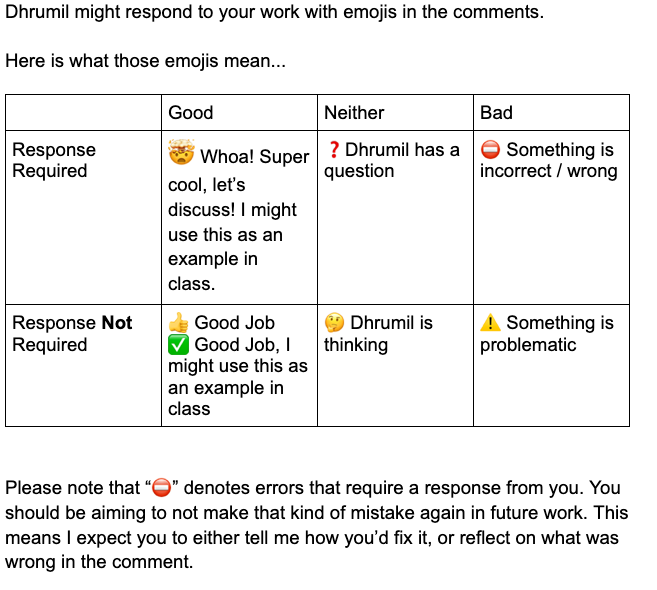
Please note that “⛔️” denotes errors that require a response from you.
Your response can be a rewrite of that section or a reflection or discussion in the comment to demonstrate that you understand thoroughly what the issue was and how to prevent it from happening again.
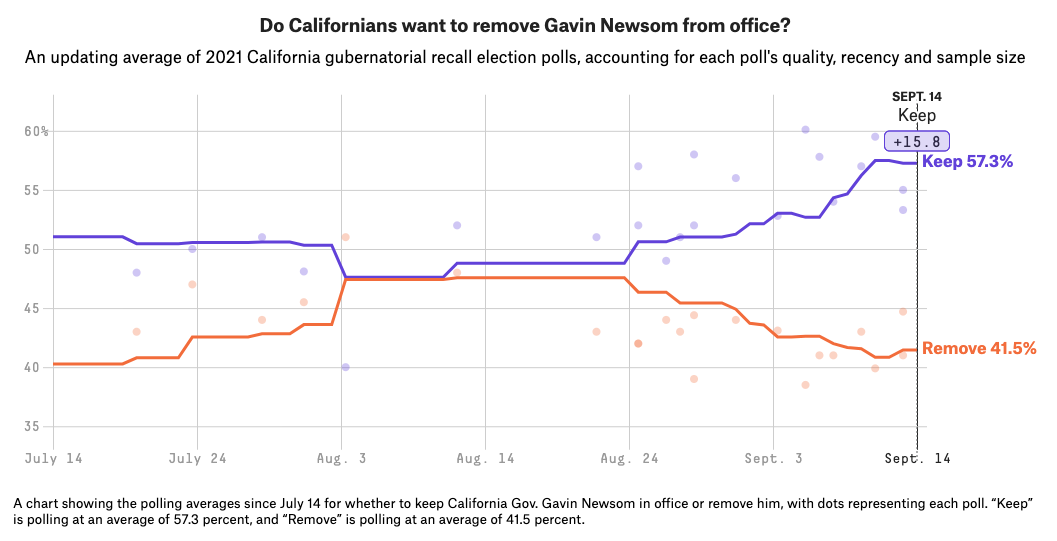
Live Election Results
https://www.washingtonpost.com/elections/election-results/california/governor-recall/
Pre-election forecast
Election: Sunday 9/26
How is Assignment 2 going?
(recap)
Measures of Central Tendency
- Mean = μ
- Median
- etc...
Measures of Variability
- Range
- Standard Deviation = σ
- Variance = σ2
- etc...
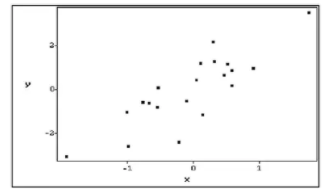
are there outliers?
how is the data distributed?
how many data points are there?
etc...
As a form of data exploration
As a form of data exploration
Tools:
- Excel or Google Spreadsheet Charts
As a form of data exploration
As a form of data exploration
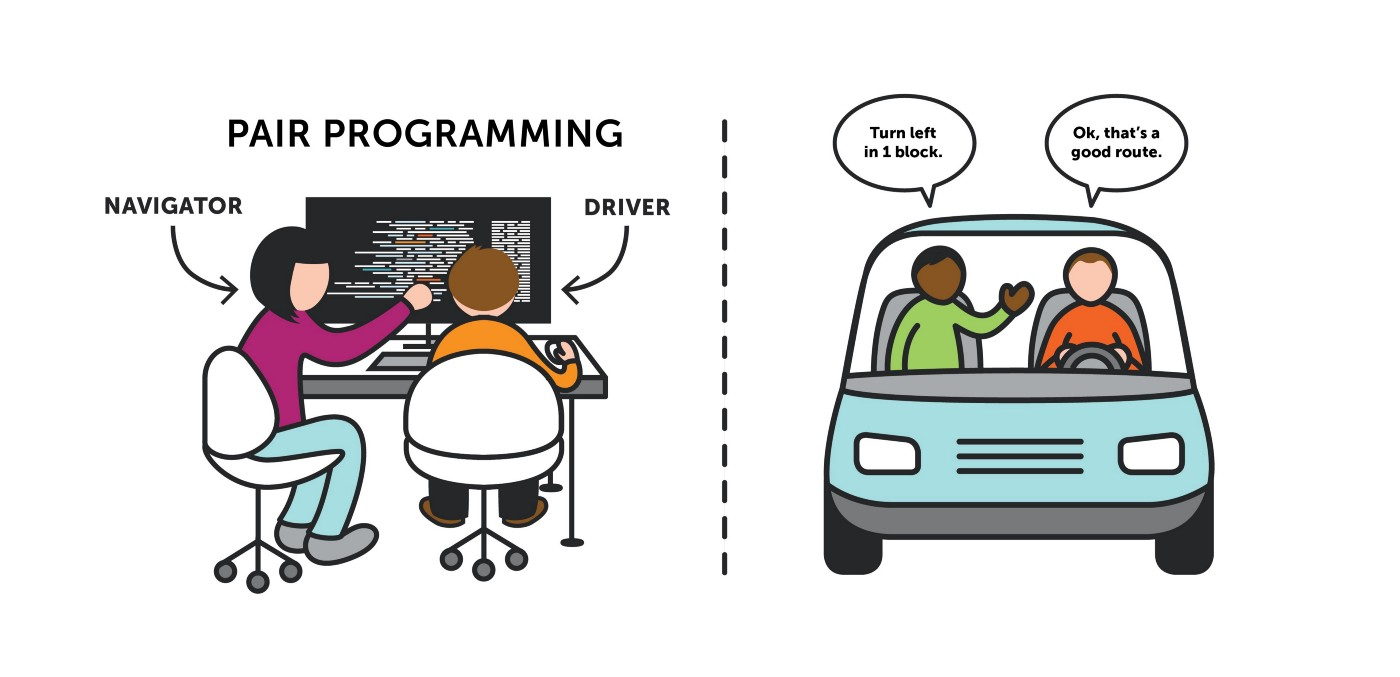
Driver
Has the computer/keyboard. Is writing the formulas, charting data, etc etc....
Navigator
Thinking ahead, looking up how to do something, listening to the driver and bouncing around ideas...
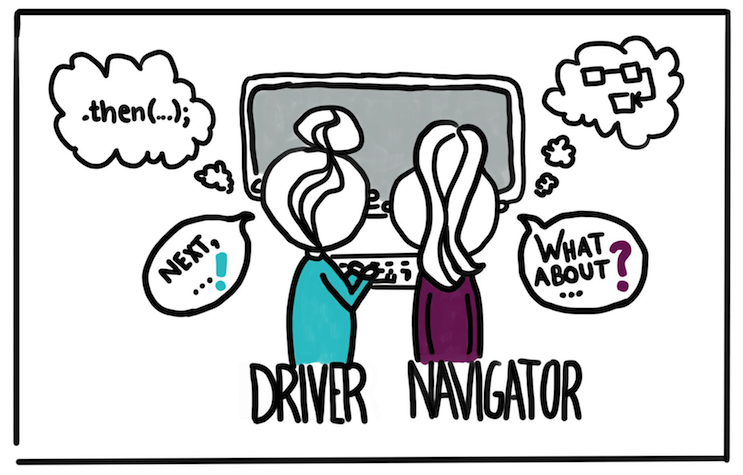
Driver
Has the computer/keyboard. Is writing the formulas, charting data, etc etc....
Navigator
Thinking ahead, looking up how to do something, listening to the driver and bouncing around ideas...
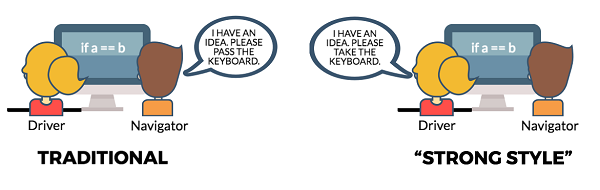
Switch it up occasionally
Pair Programming
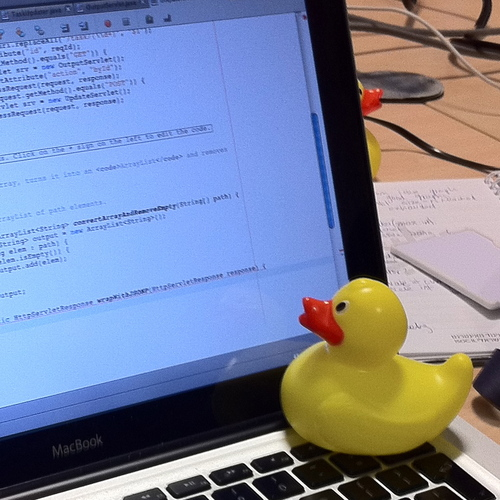
Rubber Duck Debugging
Now that you've heard everyone's pitches...tell me who you are interested in working with and why
By Dhrumil Mehta


