

Dhrumil Mehta
Database Journalist, Politics @ FiveThirtyEight
(1) Please make and display your name cards!
(2) Make sure you're on Slack:
https://ledeprogram.slack.com/
(3) Keep PollEverywhere open
If you have any questions, just raise your hand 🖐!
Welcome! Let's get rolling!
Communicating Data
- Homework Review:
- Assignment 2
- Pitches
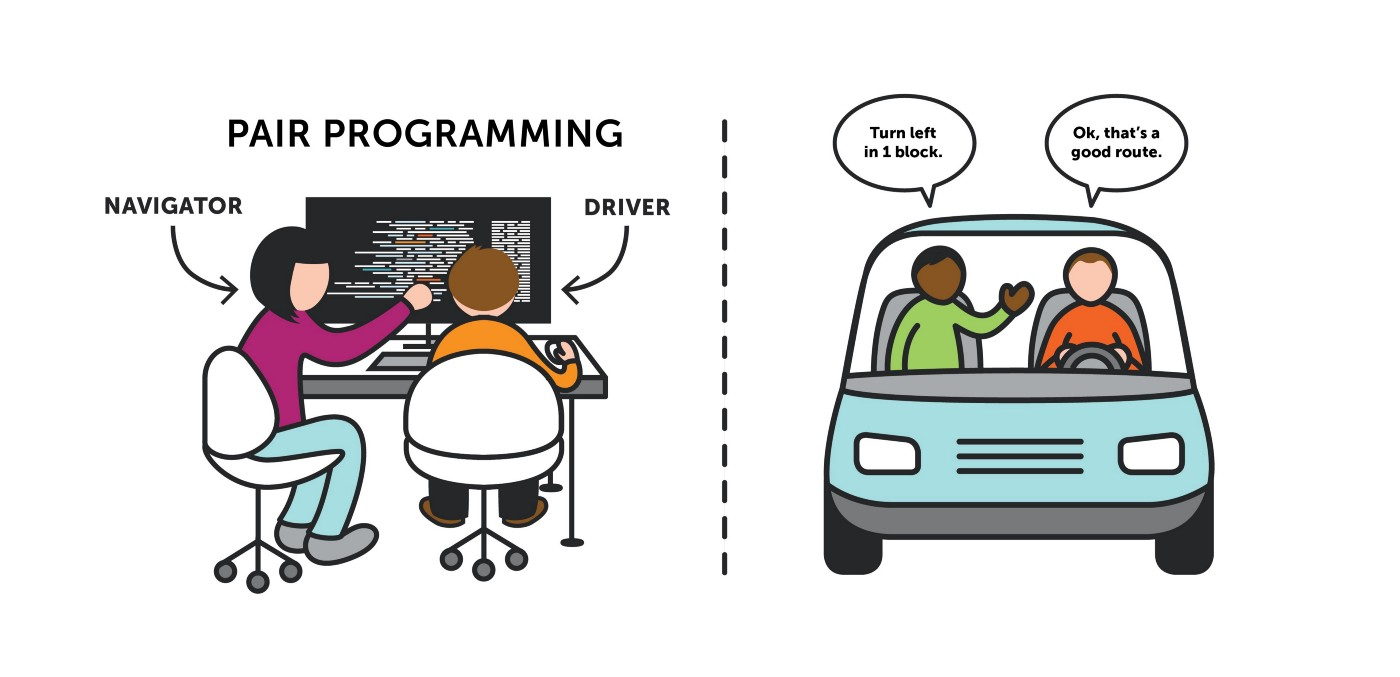
- Guided Pair Programming:
- Assignment 3
- Project Time
- some in-class time to get started on your project work
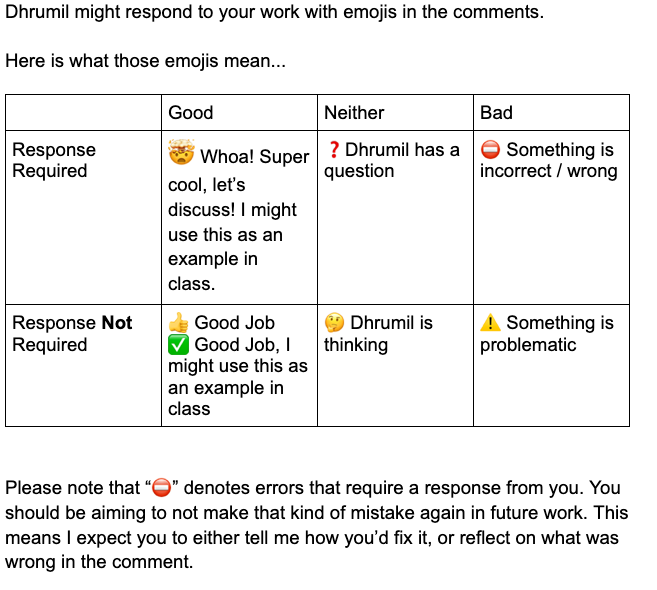
Reminder: Don't forget to respond to ⛔️, ❓and 🤯
Your response can be a rewrite of that section or a reflection or discussion in the comment to demonstrate that you understand thoroughly what the issue was and how to prevent it from happening again.
Pitch a story with a data-driven component
Understand the possibilities and limitations of data in journalistic inquiry.
Find (or create) datasets that can help you to answer journalistic questions.
Know how to approach a dataset with journalistic questions in mind.
Report a story using data
Know when and how to apply statistical treatments to data.
Conduct data analysis in spreadsheets or code notebooks.
Avoid common pitfalls in interpreting and analyzing data.
Combine data analysis with traditional reporting methods like interviewing.
Use strategies to ensure digital security and data privacy where applicable.
Produce a data-driven story (or other “act of journalism”)
Understand what sorts of claims you can and cannot make based on the techniques you used to analyze your data.
Transparently and effectively communicate the assumptions, methodological choices and uncertainty embedded in quantitative analysis.
Communicate stories in data effectively for your audience with charts and tables.
Pitch
Report
Produce
Pitch
Report
Produce
Descriptive Statistics
- exporing raw data
- summary stats
- pivot tables (summary stats of subsets)
- exploratory data viz
We could say the case of Jayhawk Consulting pollters is a peculiar one because we only have a total of two polls done by this pollster, in 2014 and 2018, both related to Kansas's 1st congressional district election. In 2014 Jayhawk was the only pollster that polled this specific Kansas district, and it wrongly predicted the Democrat candidate, James Sherow, would win, when he actually lost by almost 36 points. In the next election in 2018 it did slightly better, but again their predictions were off by more than 32 points, while the only other pollster predicting this same race, Emerson College, did a much better job predicting the Republican candidate result even when it also fell short by 17 points. We should bear in mind that Jayhawk Consulting is a company based in Kansas, according to its website, and more importantly, that it is a partisan pollster who favors Democratic candidates. This in part could explain why its predictions weren't accurate at all in a traditionally Republican district and state. Based on previous polls, Jayhawk Consulting is not a reliable source for polling predictions.
Characterization of Brown University:
This pollster also had a small sample of only seven polls so it’s difficult to characterize accuracy, though they performed highly on the polls they conducted.
Justification for that characterization:
There are only 7 polls for Brown University so again, it is difficult to draw solid conclusions about its performance. However, of the 7 races they have polled, they have accurately called 6. On average, their bias leans Republican by 2.21 points, with a large standard deviation of 10 points in either direction. Their mean error is relatively high at 8 points away from the actual result.
The pollster from Brown University has conducted a total of seven polls from 2000 to 2014 all of them in Rhode Island State. If we compare how off their predictions were from the actual result to the average distance (absolute bias) reported by other pollsters, we can see that Brown University did a worse job in all the races. On average, all the other polls got a bias of 4.5 points in any direction of the actual result in five different races, while Brown doubled that distance (9.3 points). Moreover, Brown University was the only pollster predicting the 2002 Senate election in RI and even when it predicted a Democratic win, it underestimated such victory by more than 12 points. It also fell short on the Republican support by over 7 points. With all this data, we can conclude that Brown University is not a reliable pollster for Rhode Island State elections.
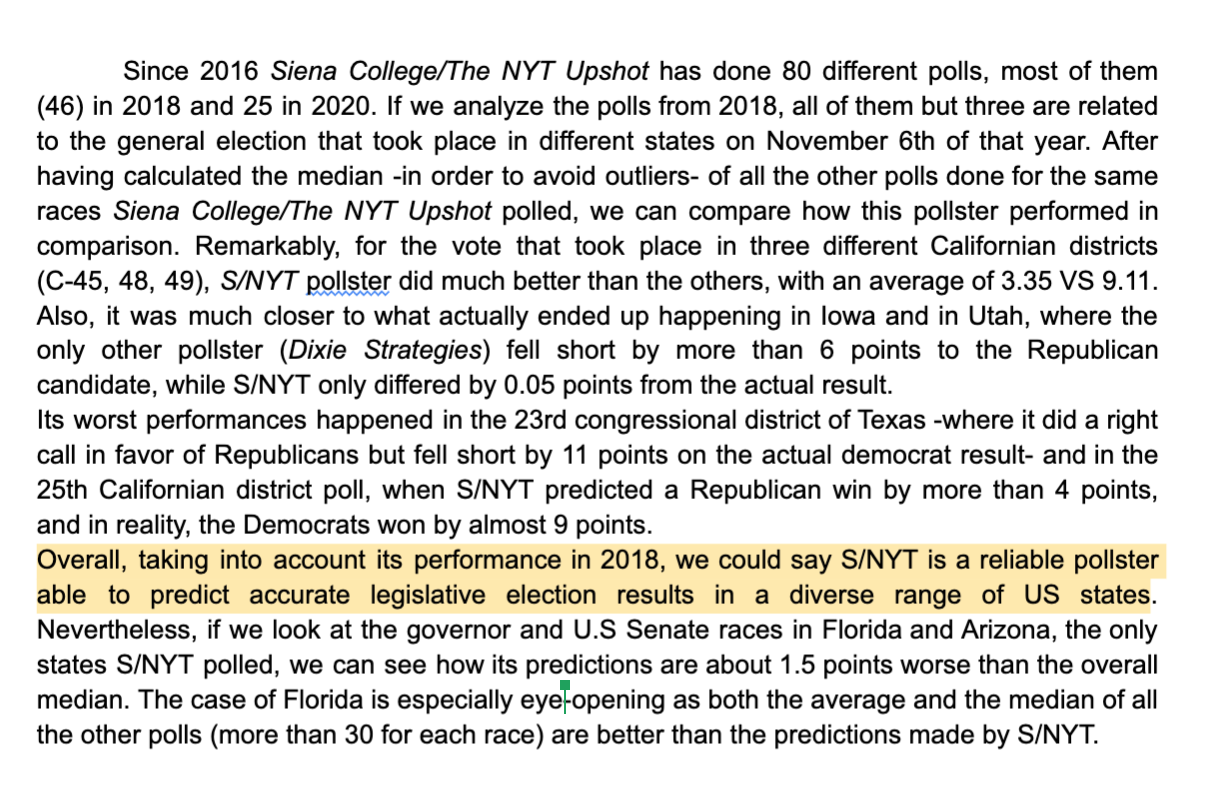
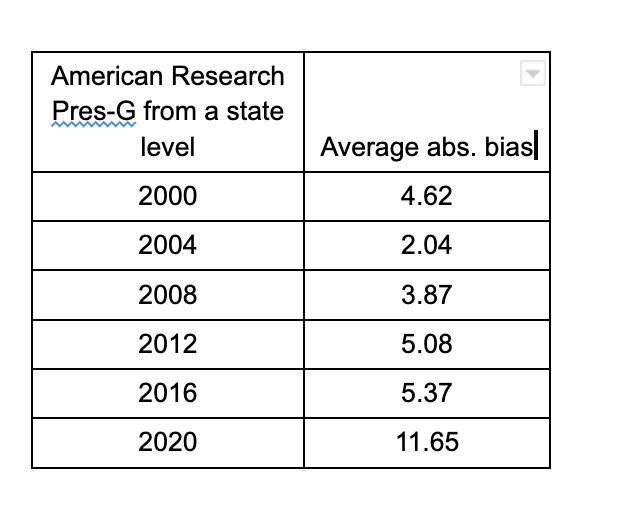
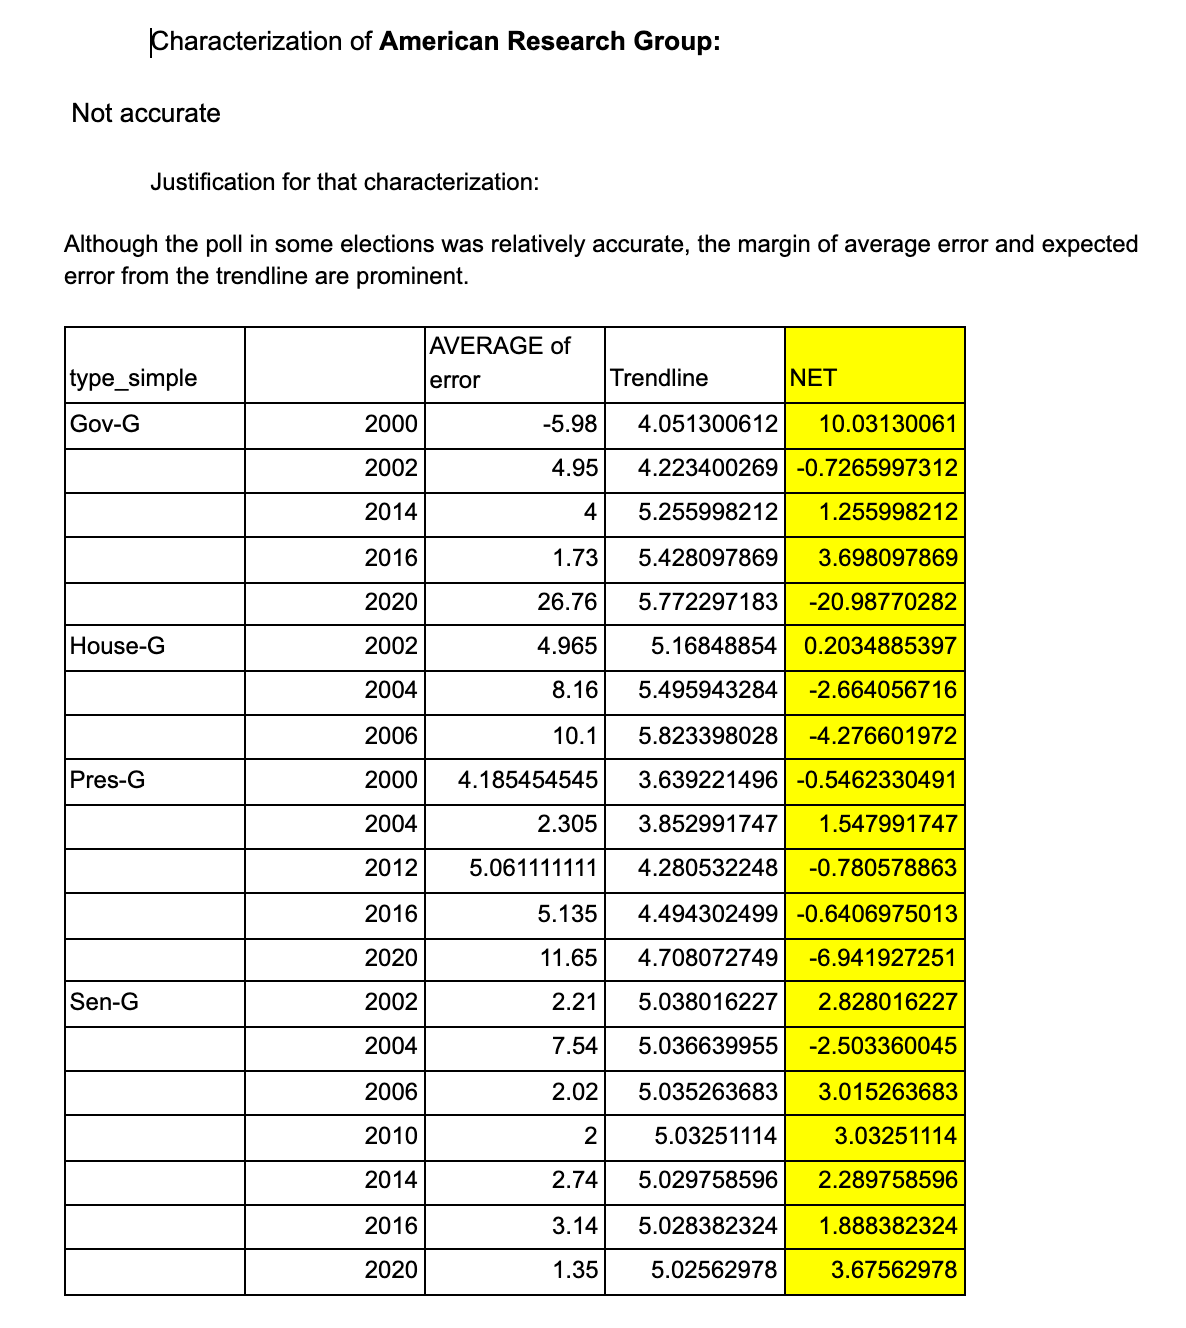
Overall, in comparison to all the other pollsters that predicted an electoral result for the same races American Research Group did, this company did a good job, with a median average of the value "absolute bias" (how far their predictions fell from the final result in any direction) of above 4.5 points while the median average of all the other polls was around 4.1. If we keep a close eye to the ARG polls for presidential elections from a state level (the kind of election this company seems to be specialized in), they accurately predicted the tight victory in 2004 of John Kerry, better than the median average of all the other pollsters. Also, it did much better than the others in predicting the 2002 New Hampshire 1st and 2nd congressional district and Senate election, with an average median of the value "absolute bias" of around 4 points closer to the actual result. Overall, we can conclude this is a reliable poll, even when it didn't predict correctly for New Hampshire, where this company is based, the political feeling toward the 2020 Governor or Presidential elections. For each of these races American Research Group did only one poll, with an "absolute bias" value of around 19 and 10.5 points higher, respectively, than the average median of the other polls.
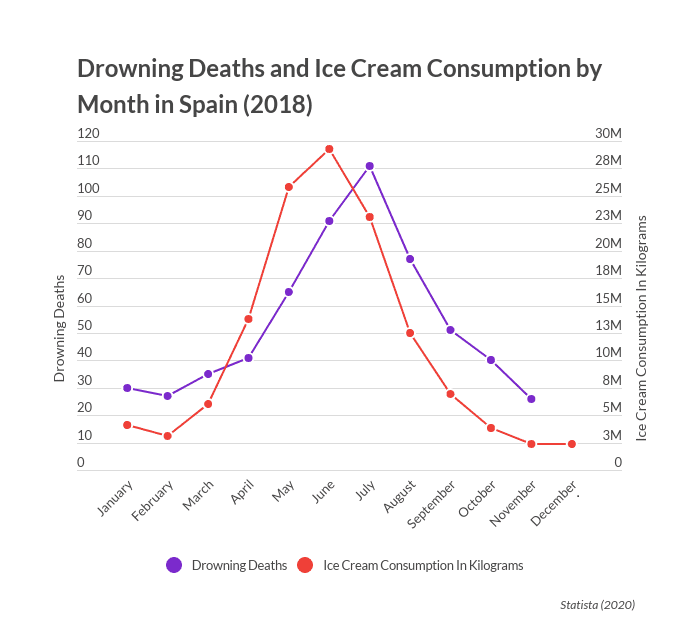
When you use summary statistics, you lose nuance. If you're not looking at the raw data, you're messing up.
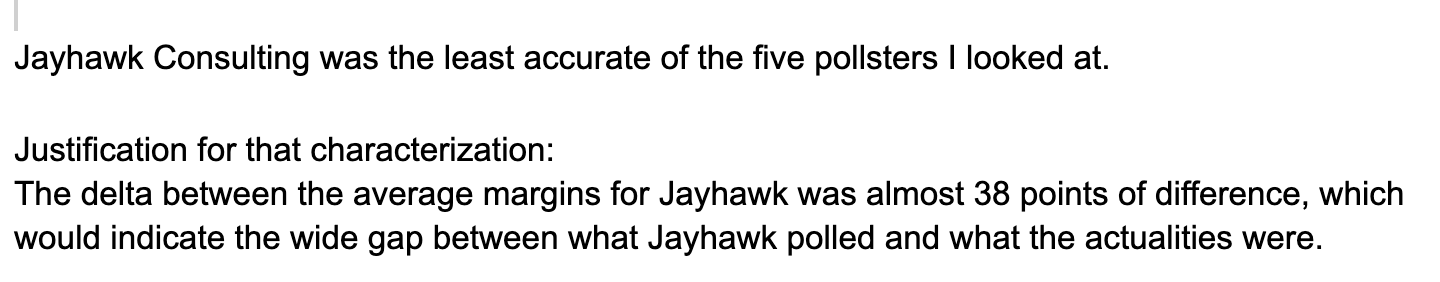
Jayhawk Consulting
Different approaches tell you different things, but some approaches are methodologically incorrect ⛔️
Brown University
Not accounting for confounding factors is an easy mistake to make and will lead you to telling the wrong story...
American Research Group
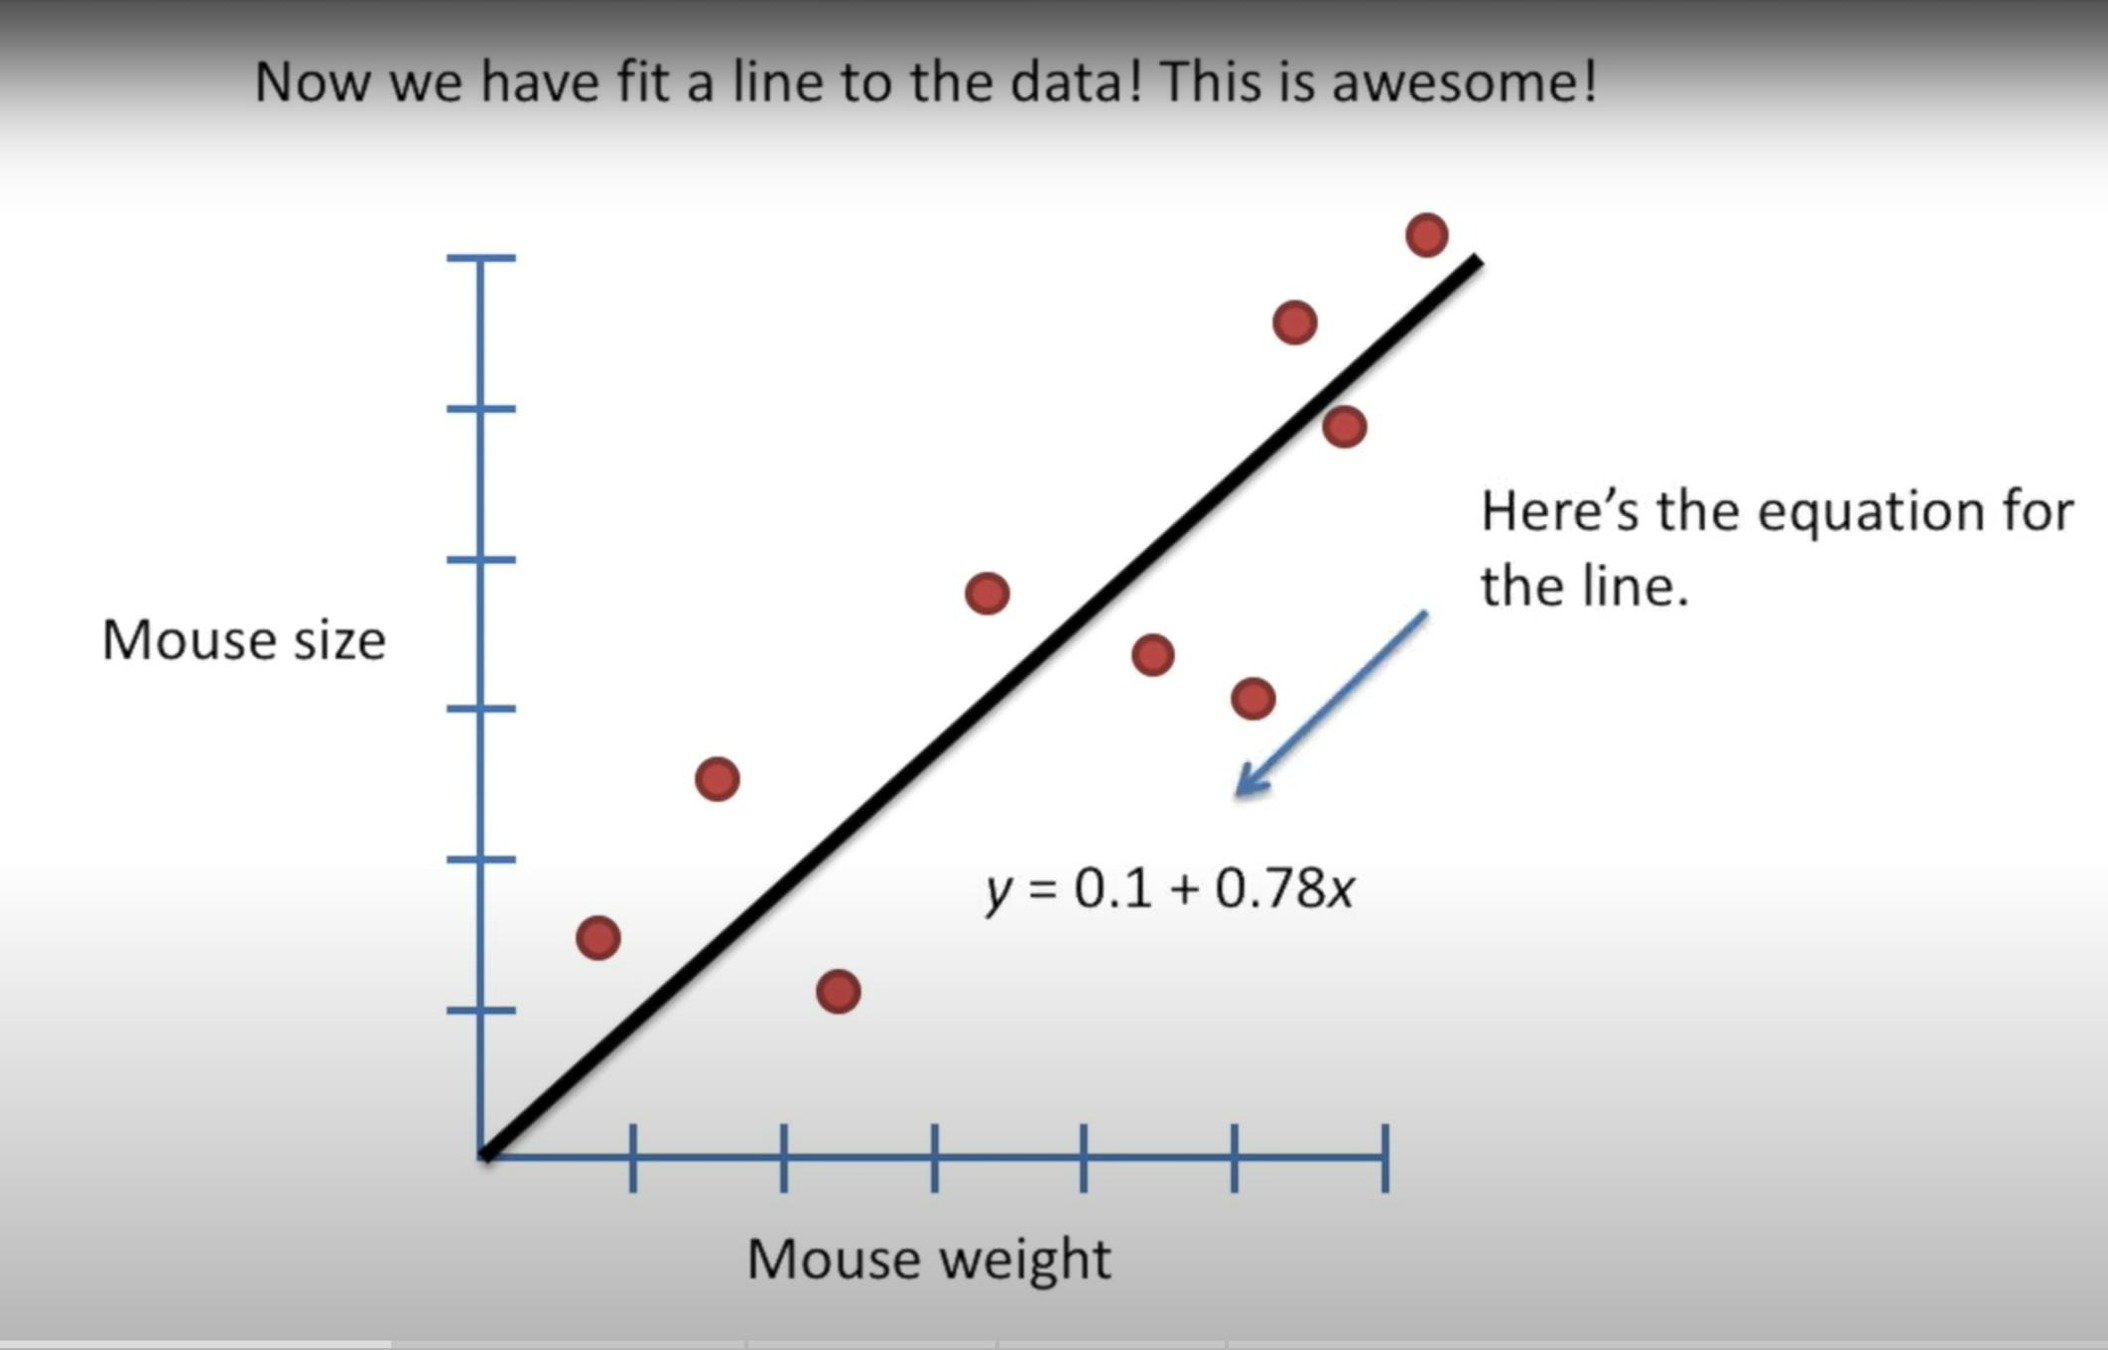
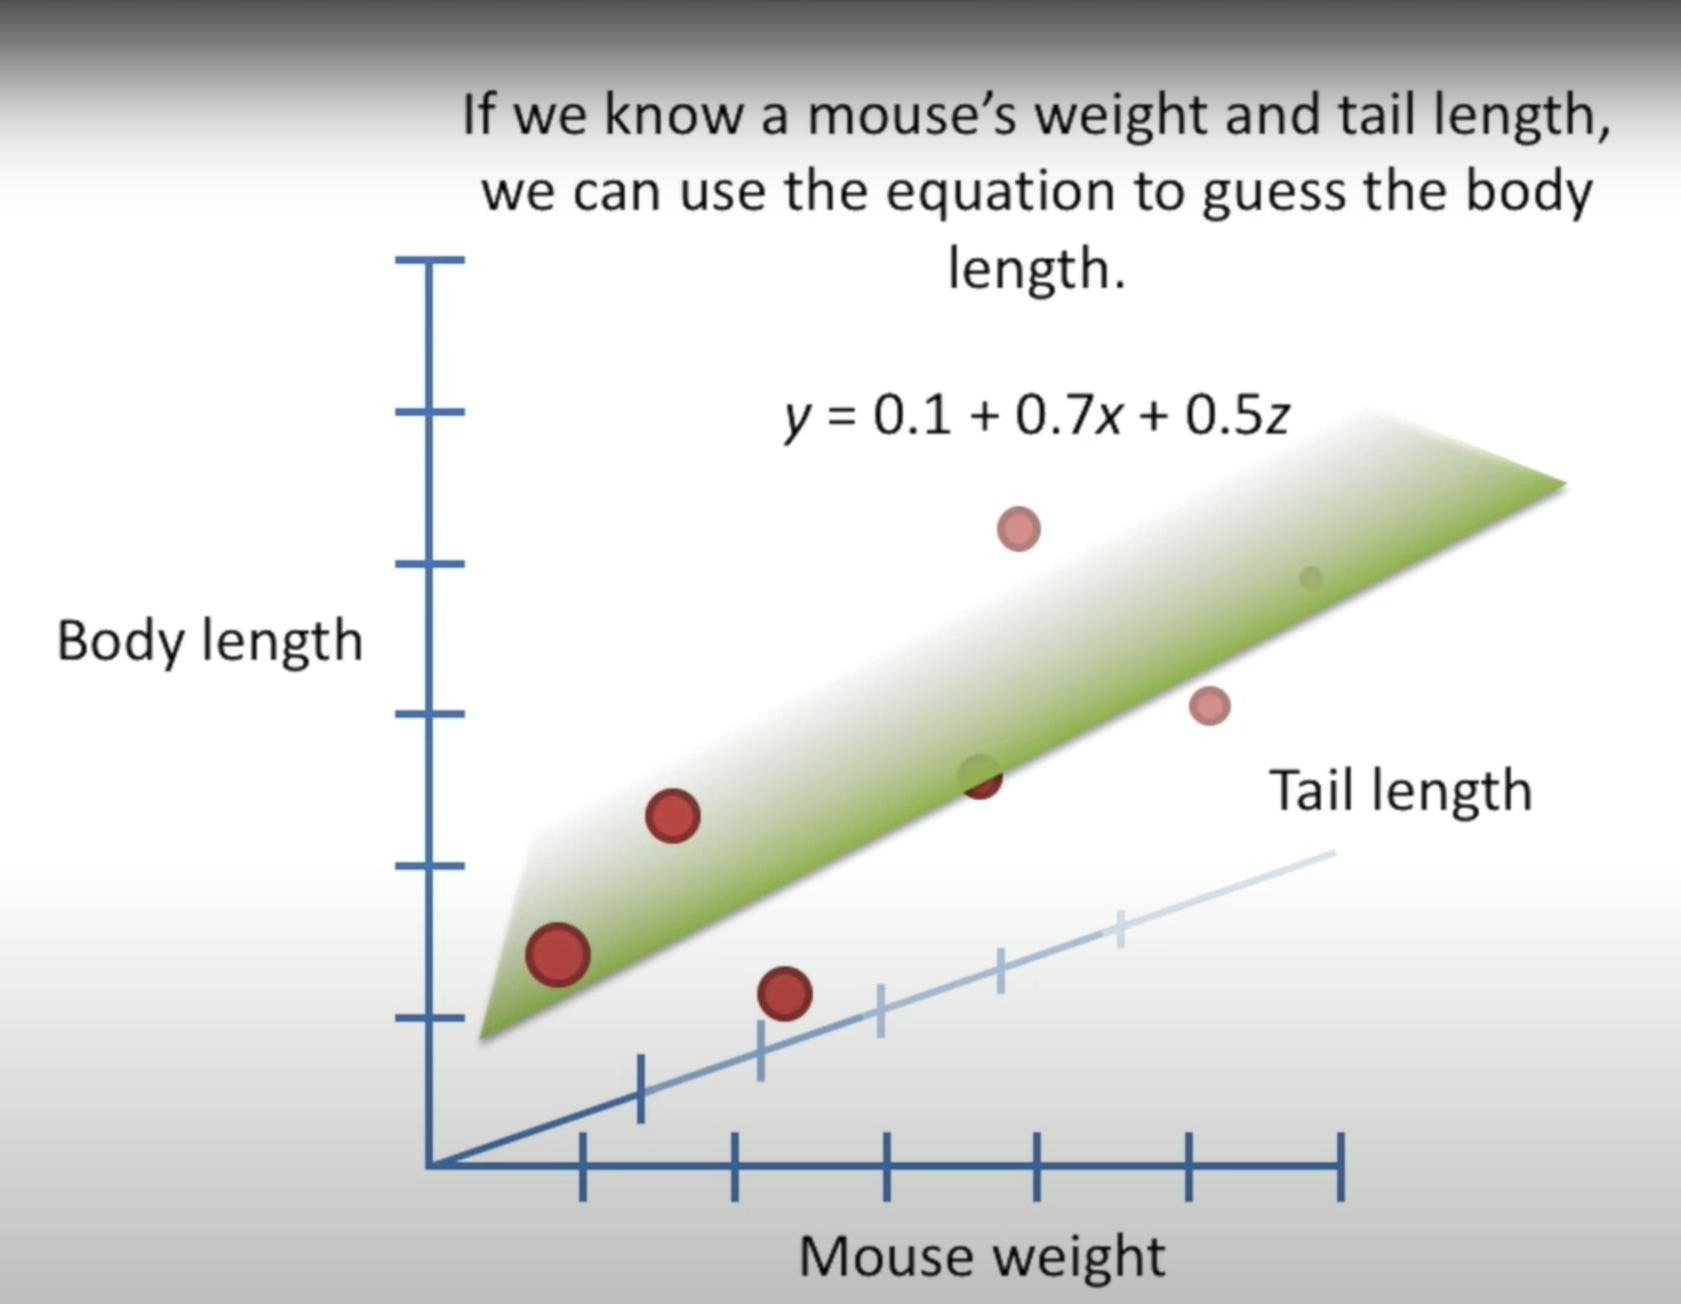
What is a regression?
(Linear regression)
Linear Regression
Multiple Linear Regression
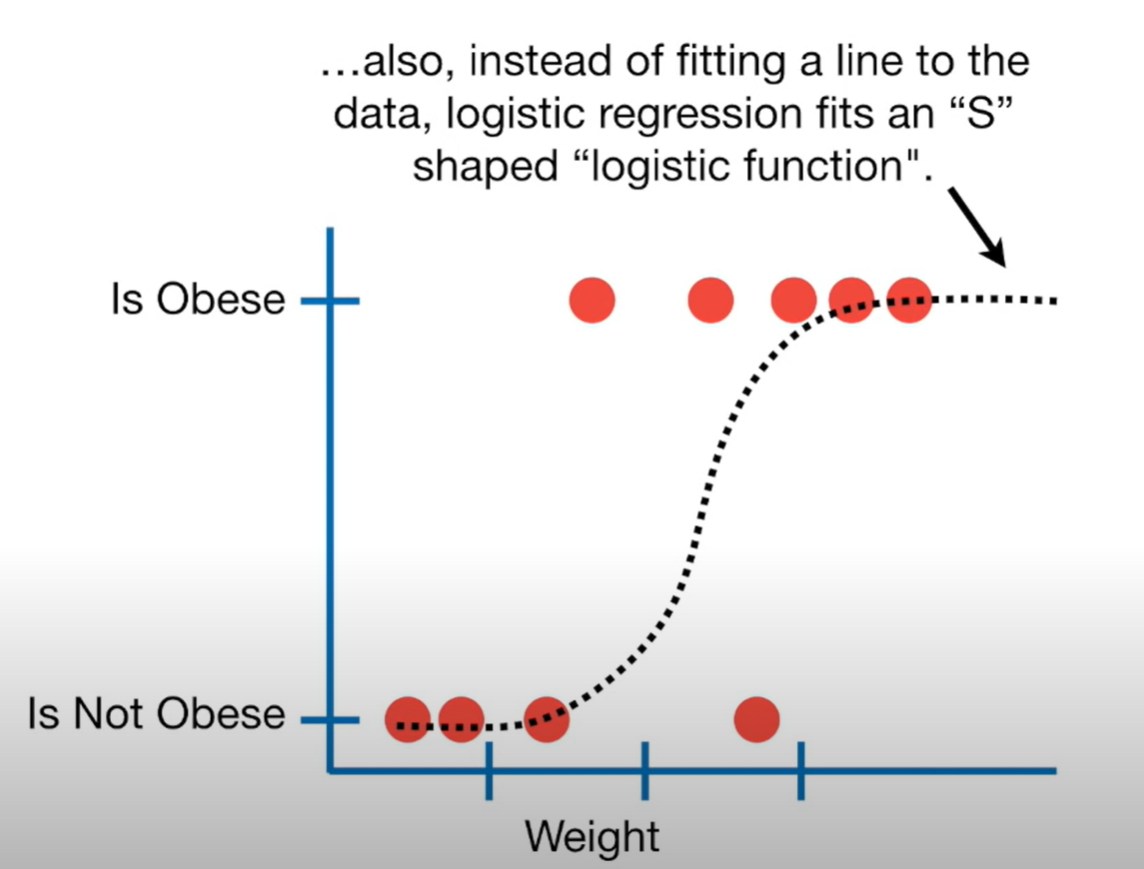
Logistic Regression
Etc...other types of models that are not regressions...
| Construct | Measurement |
|---|---|
| How well you have grasped the learning objectives | 1-100 grade, letter grade, emojis, pass/fail |
| What people think about a movie | 1-5 star rating or paragraph movie review |
| ... | |
| ... | |
| How reliable a pollster is | ? |
What you're trying to measure
vs
How you're measuring it ⚠️
Empirical / quantitative social science on deadline
- Andrew Flowers (Former Quant Editor @ FiveThirtyEight)
Empirical / quantitative social science on deadline
- Andrew Flowers (Former Quant Editor @ FiveThirtyEight)
Being able to identify the:
And being able to communicate those effectively
Applying Lessons from Assignment 2
Being able to identify the:
And being able to communicate those effectively
are ALSO keys to being able to pitch a data-driven story
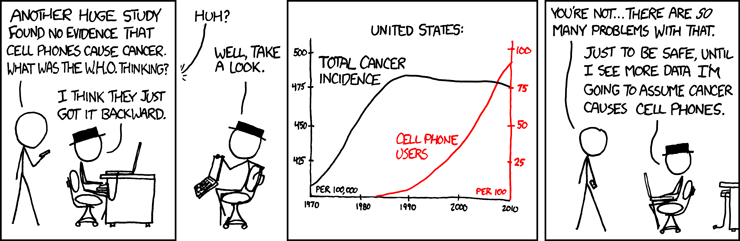
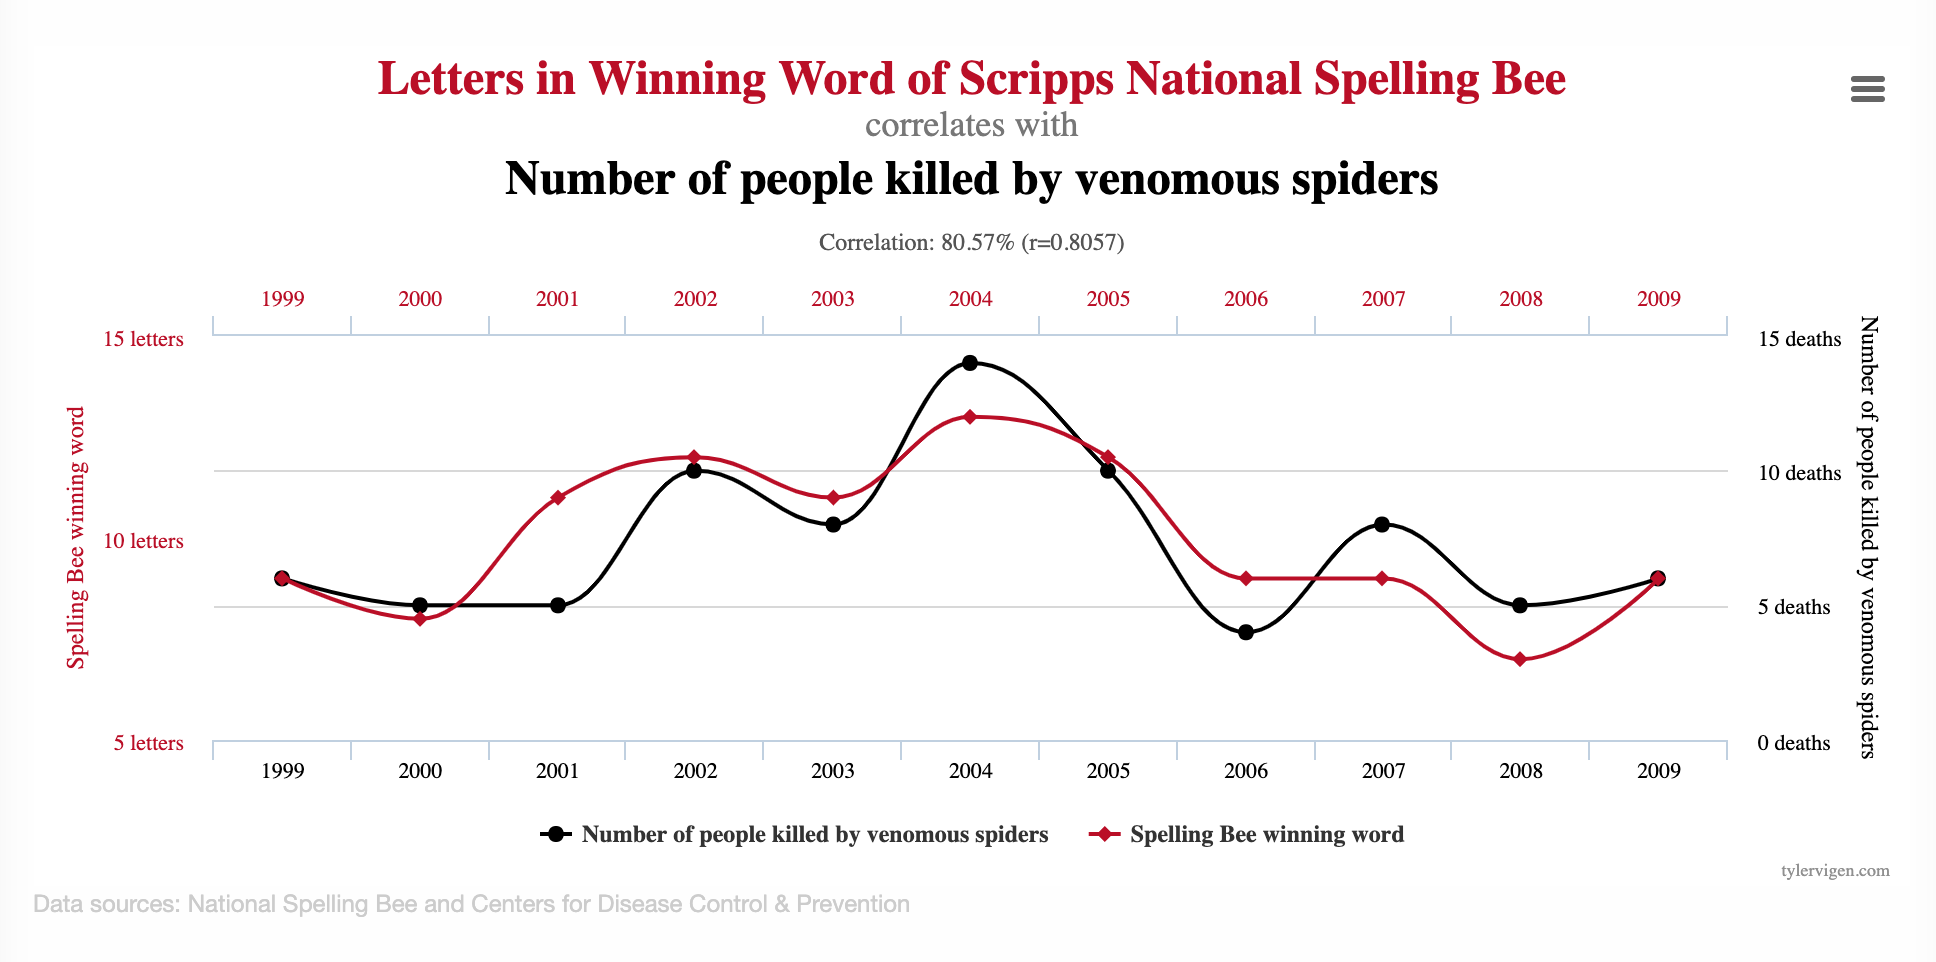
1. coincidence
3. common cause
2. causality reversed
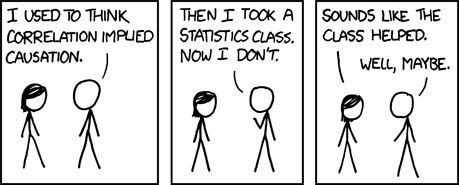
Communicating Correlation
Correlation doesn't imply causation, but it does waggle its eyebrows suggestively and gesture furtively while mouthing 'look over there'.
What is the role of reporting?
What is the "best case scenario" headline?
Is this hypothetical "best case scenario" article newsworthy?
Will brighter prospects of congestion pricing spook car buyers and sellers in New York?
The impact of COVID-19 on garbage collection and sanitation in South Bronx
College Football in the Time of Covid: How Home Games Have Impacted College Towns in 2020 and 2021
Who should we thank for the reducing anti-Jewish hate crimes in New York City?
Using tools from Assignment 2
Finding a pitch in a dataset
Using tools from Assignment 2
Finding a pitch in a dataset
https://docs.google.com/document/d/1Lk--iCwpbOYjln2xfurvuWbSpb4V3wl7LmQQ8_IDpTI/edit
No new datasets
Assignment 2
Assignment 3
Project
Upcoming Homework
video/reading
exercises using the datasets you're already familiar with
short q&a's / checks for understanding
By Dhrumil Mehta


