
Dhrumil Mehta
Database Journalist, Politics @ FiveThirtyEight
Welcome Back!
How are you doing?
Please fill out today’s survey in
#reporting-ii-2023
- Project-related and homework-related announcements
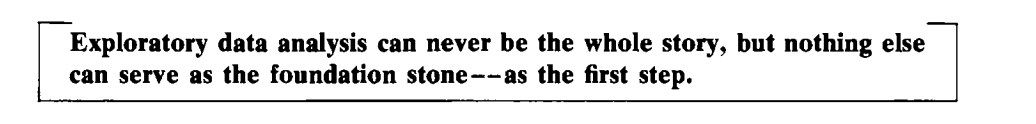
- Exploratory Data Visualization
(visualizing data for yourself)
- Data Visualization
(visualizing data for the reader)
- Guest Speakers: Visual Journalists Ryan Best and Humera Lodhi from FiveThirtyEight
(Milestones and Deadlines)
OCT 30: Outline Due
Nov 20: First Draft Due
Dec 6: Project Presentation
Dec 11: Final Draft DueImportant Dates
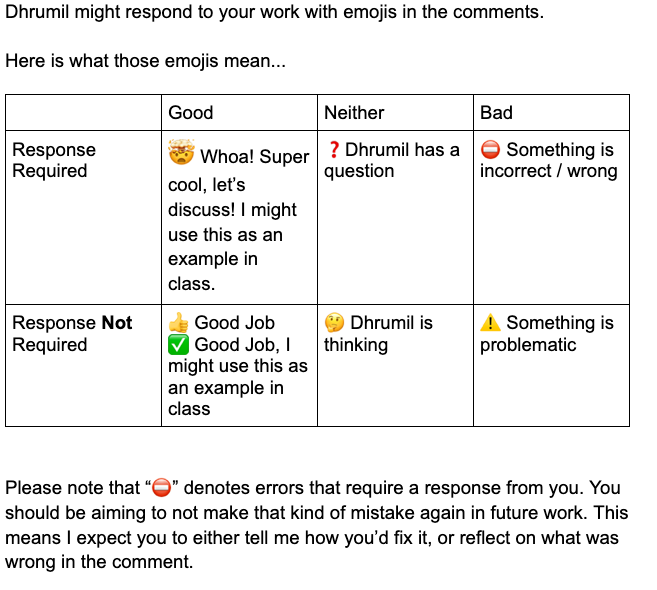
Reminder: Don't forget to respond to ⛔️, ❓and 🤯
Your response can be a rewrite of that section or a reflection or discussion in the comment to demonstrate that you understand thoroughly what the issue was and how to prevent it from happening again.
A quick polly about your exploratory data visualization homework...
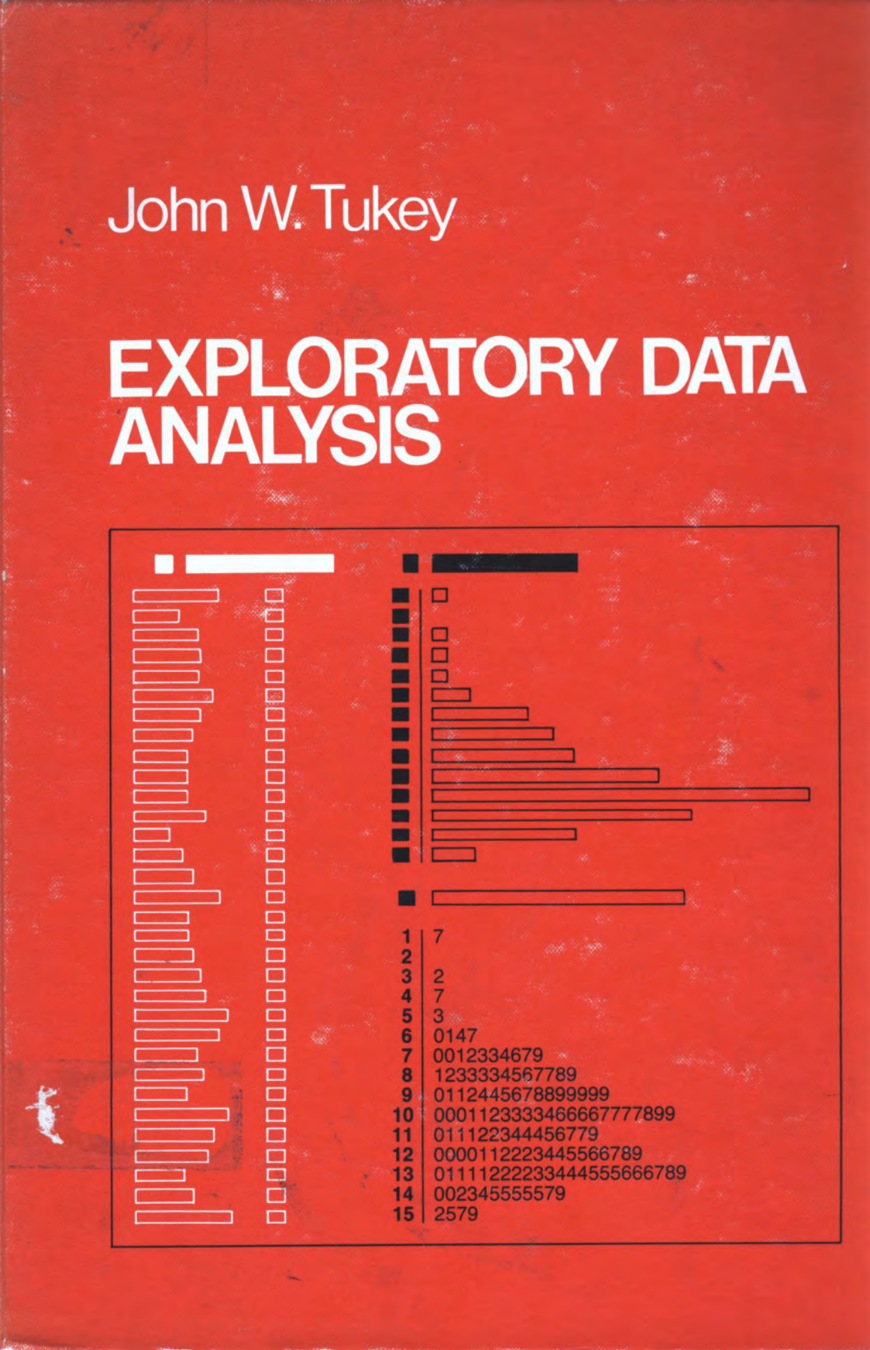
1977
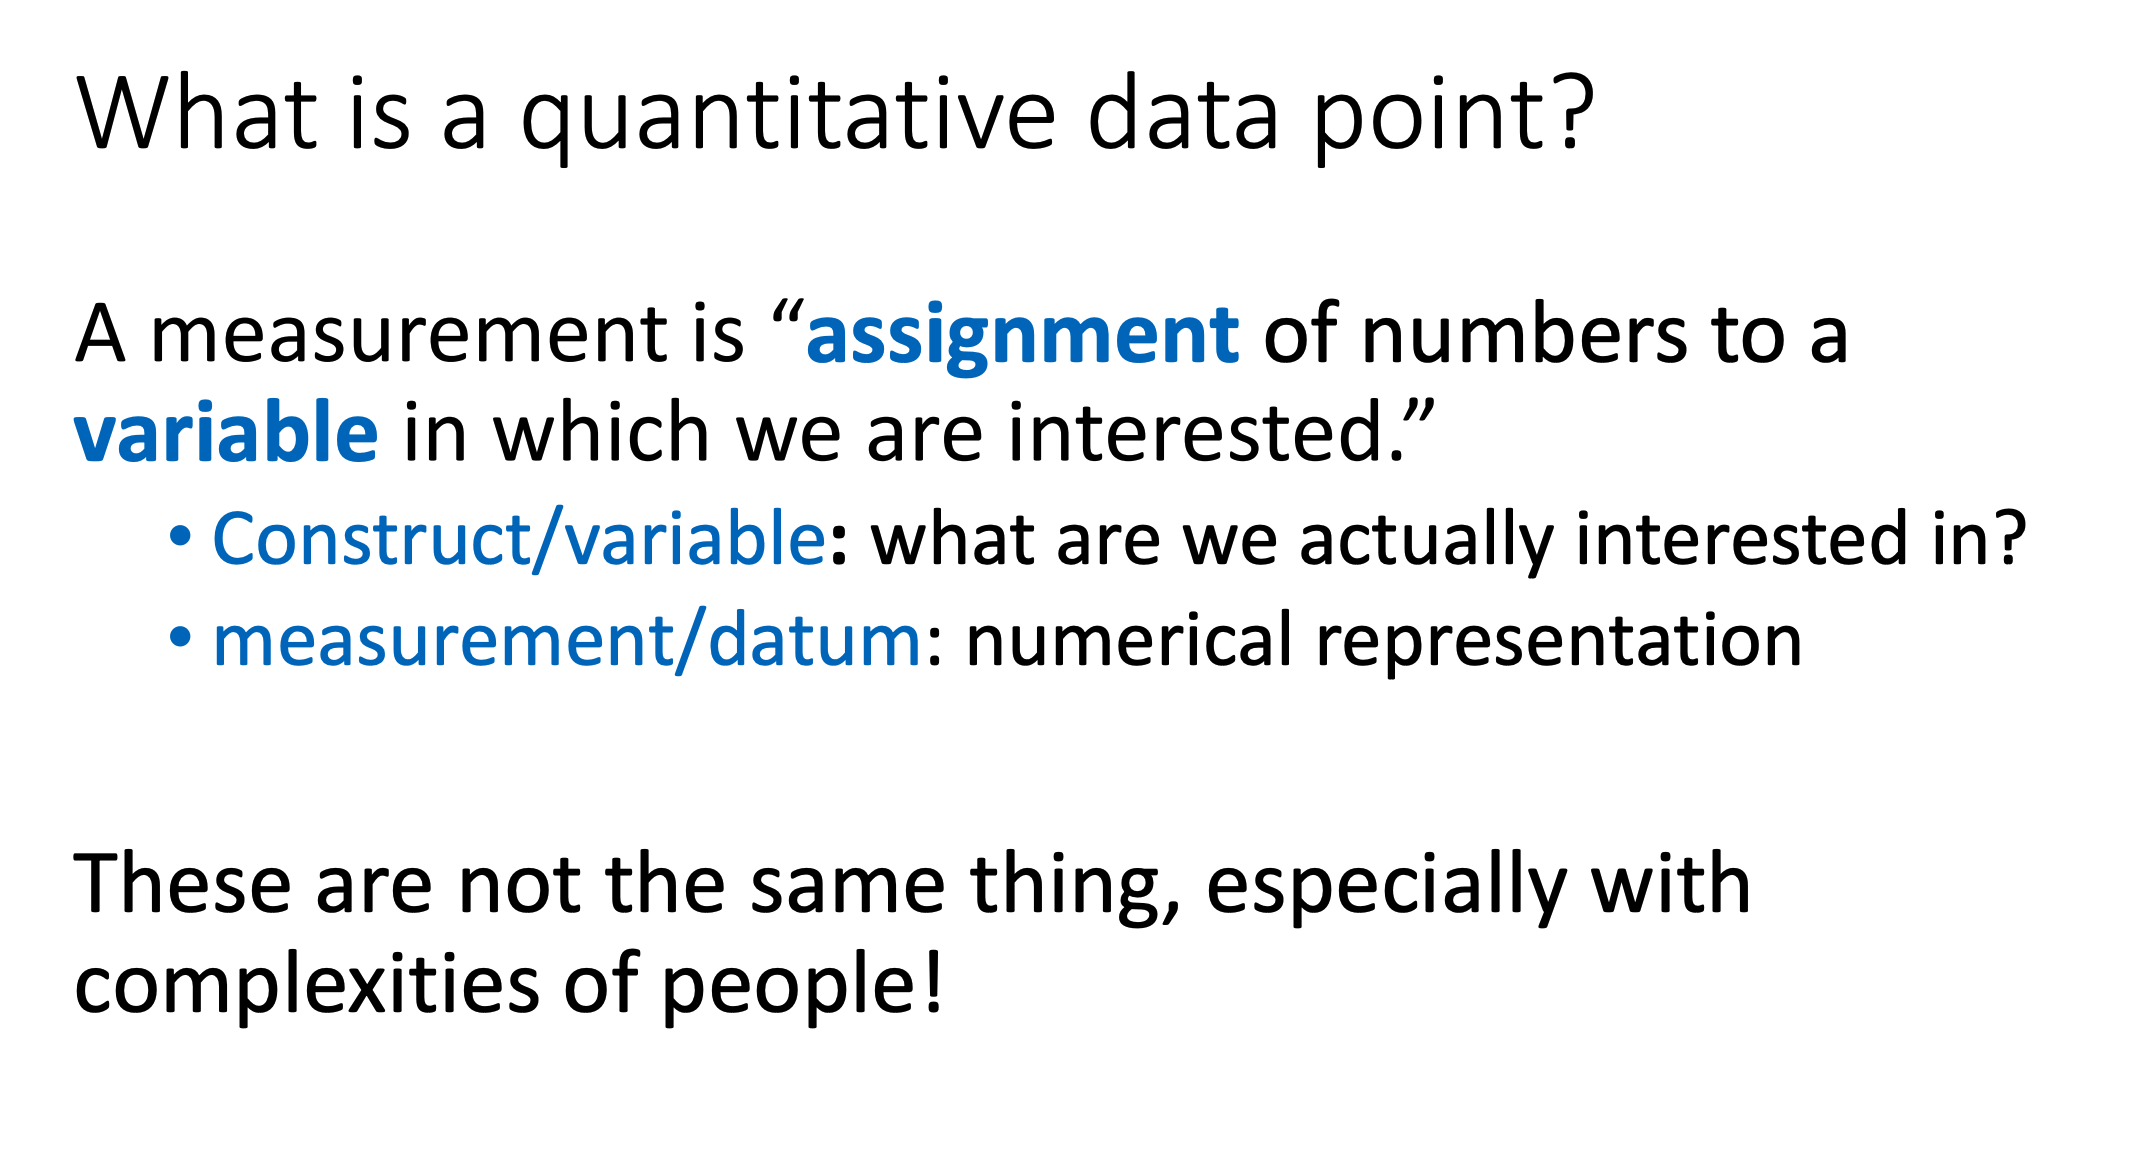
slide credit: Nikhil Garg https://orie5355.github.io/Fall_2021/static_files/lectures/Lecture2_WhatIsData.pdf
slide credit: Nikhil Garg https://orie5355.github.io/Fall_2021/static_files/lectures/Lecture2_WhatIsData.pdf
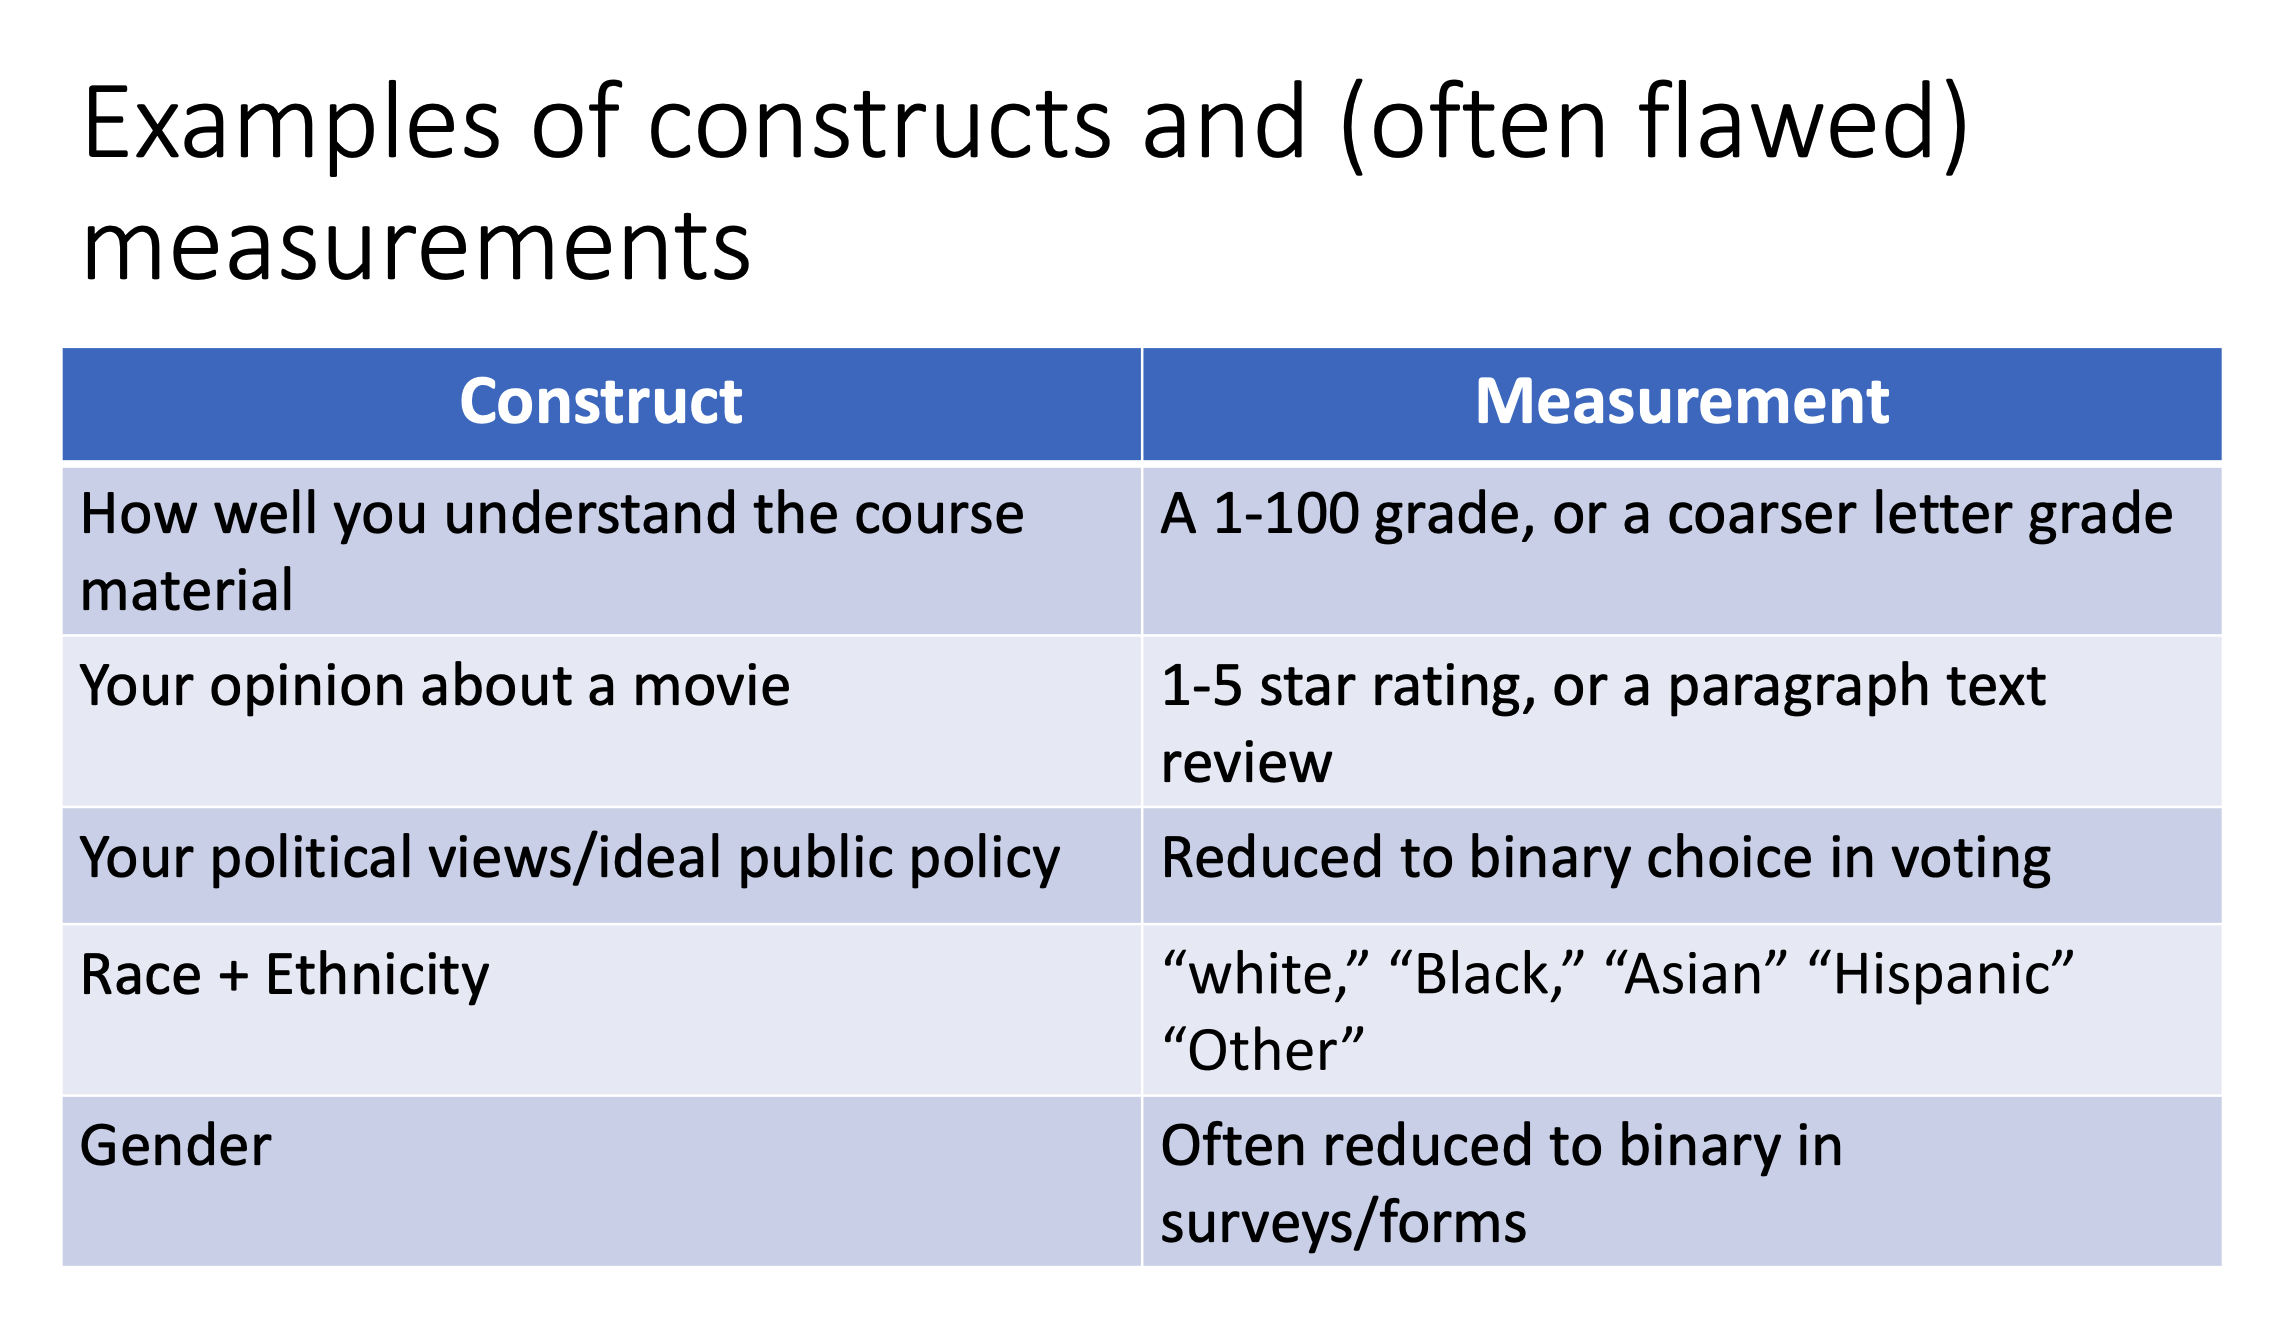
- What is this data?
- What does this data measure?
- What constructs will it help me understand?
- Is there other data that might measure something else but help me get at the same constructs I'm interested in analyzing.
- Are there other datasets I can merge with this one?
- how was it put together?
- what is each row?
- what is each column?
- what kinds of unique values are in each column?
- what are the caveats?
⚠️ if you make any methodological choices when cleaning the data, explore the implications of each choice you made - each choice will follow you all the way to whatever conclusions you draw.
- How is the data distributed?
- What are the ranges (max/min)
- What are the central tendencies?
- Sanity checks: what do I expect to see? Do I see that?
By Dhrumil Mehta


