


Dhrumil Mehta
Database Journalist, Politics @ FiveThirtyEight
(1) Please make and display your name cards!
(2) Make sure you're on Slack:
https://ledeprogram.slack.com/
(3) Keep PollEverywhere open
If you have any questions, just raise your hand 🖐!
Welcome! Let's get rolling!
<--- Rough Draft ---->
<--- Final Draft ---->
<- Respond to Edits ->
<--- Reporting / Data Analysis ---->
Pitch Approval
Pitch
Report
Produce
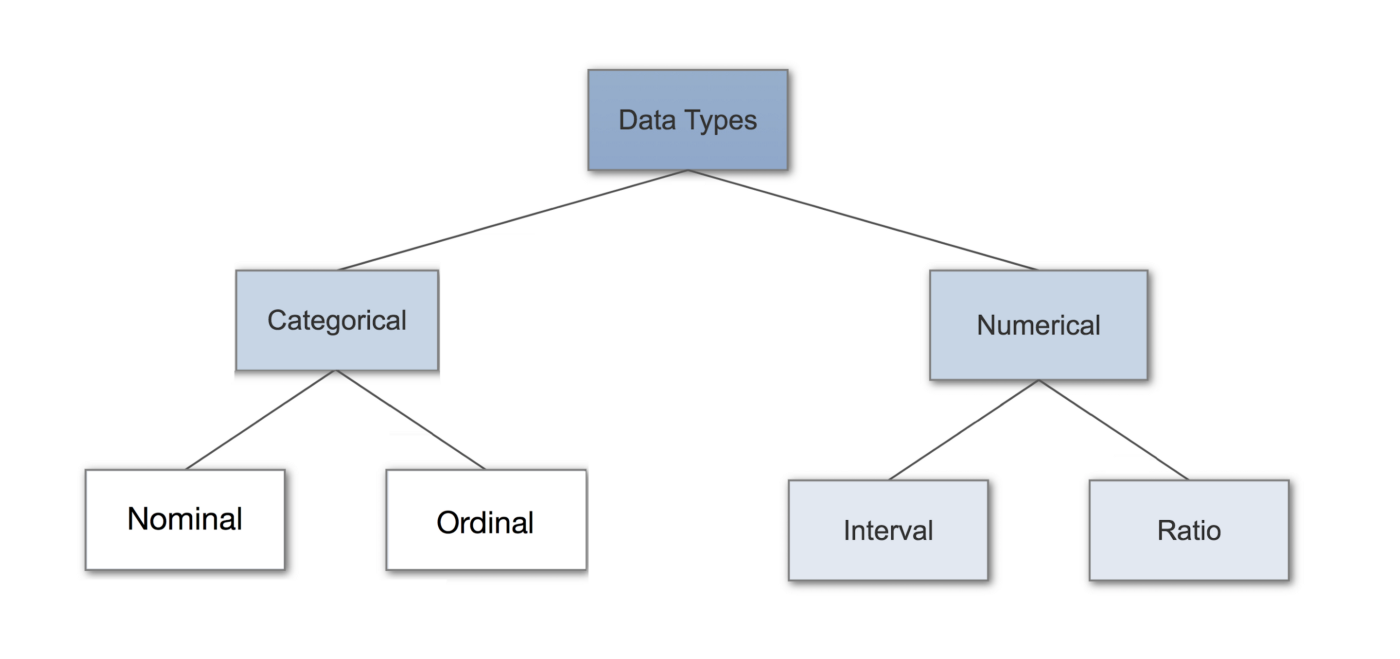
Learning Objectives:
1. Working with relational data from one source
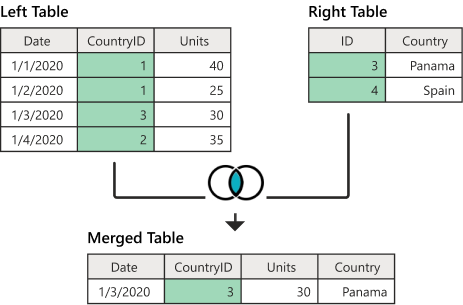
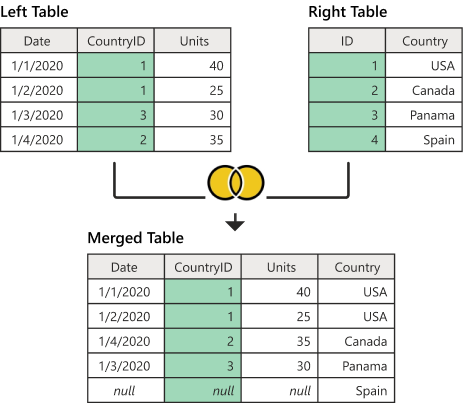
2. Merging data from different sources
Poll
Pollster
Question
Race
Answer
Candidate
Questions Answers
one-to-one
one-to-many
many-to-many
Poll
Pollster
Question
Race
Answer
Candidate
Questions Answers
Biography
Poll
Pollster
Question
Race
Answer
Candidate
Questions Answers
Biography
Poll
Pollster
Question
Race
Answer
Candidate
Questions Answers
Biography
Poll
Pollster
Question
Race
Answer
Candidate
Questions Answers
Biography
(Through)
Poll
Pollster
Question
Race
Answer
Candidate
Questions Answers
Biography
Documentation:
https://support.google.com/docs/answer/3093318?hl=en
VLOOKUP(search_key, range, index, [is_sorted])
Bonus Learning Objective
- [ ✔️ ] Reading technical documentation
Bonus Learning Objective
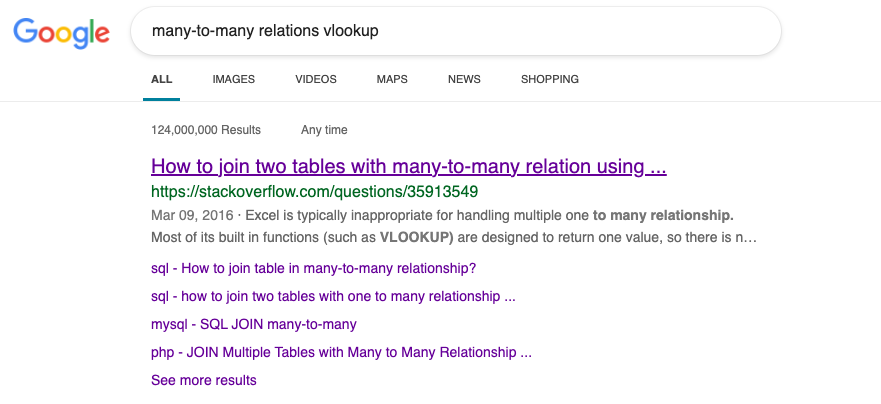
- [ ✔️ ] Reading Technical Blog Posts (Like StackOverflow)
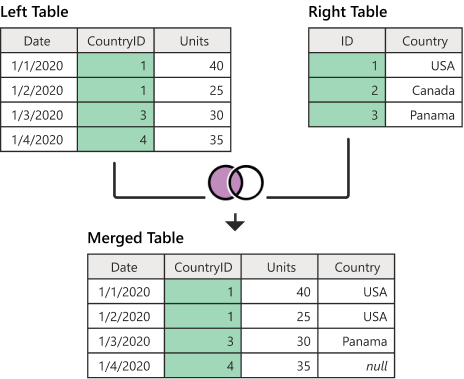
https://docs.microsoft.com/en-us/power-query/merge-queries-left-outer
Excel / Google Sheets
=VLOOKUP(B1, 'Right Table!B2:C4, 2 ,FALSE)"
SQL
SELECT * FROM left_table lt LEFT JOIN right_table rt ON lt.CountryID = rt.ID
Python / Pandas
left_table.merge(right_table, how='left', left_on='CountryID', right_on='ID')
R / TidyR
left_table %>% inner_join(right_table, by = c("CountryId" = "Country")
https://docs.microsoft.com/en-us/power-query/merge-queries-right-outer
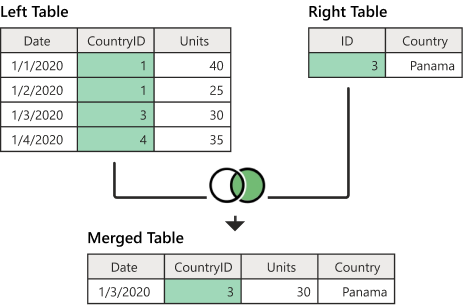
https://docs.microsoft.com/en-us/power-query/merge-queries-inner
https://docs.microsoft.com/en-us/power-query/merge-queries-full-outer
Within a Dataset
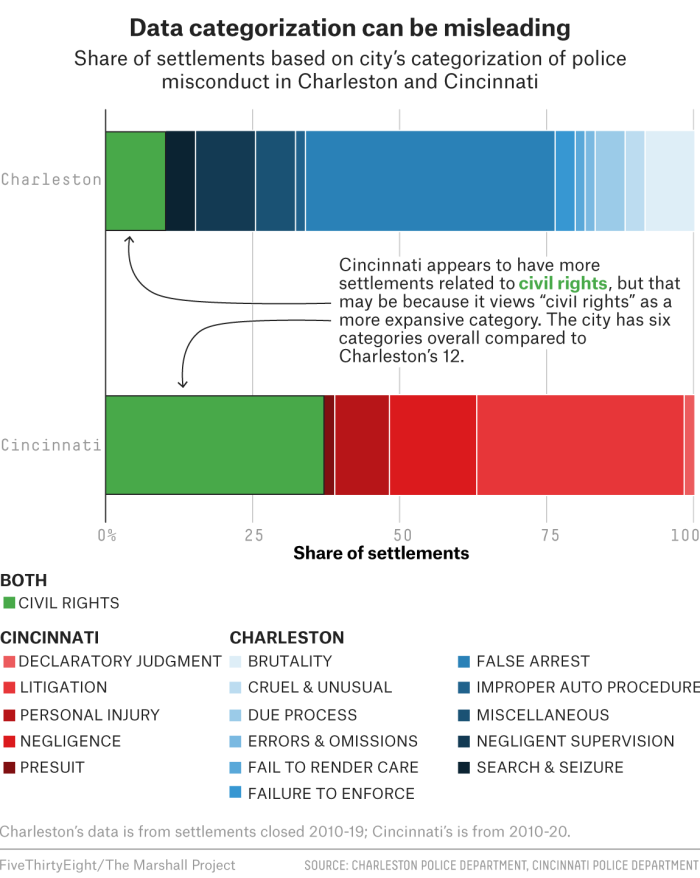
Cities Spend Millions On Police Misconduct Every Year. Here’s Why It’s So Difficult to Hold Departments Accountable.
Story
Data + Caveats ⚠️
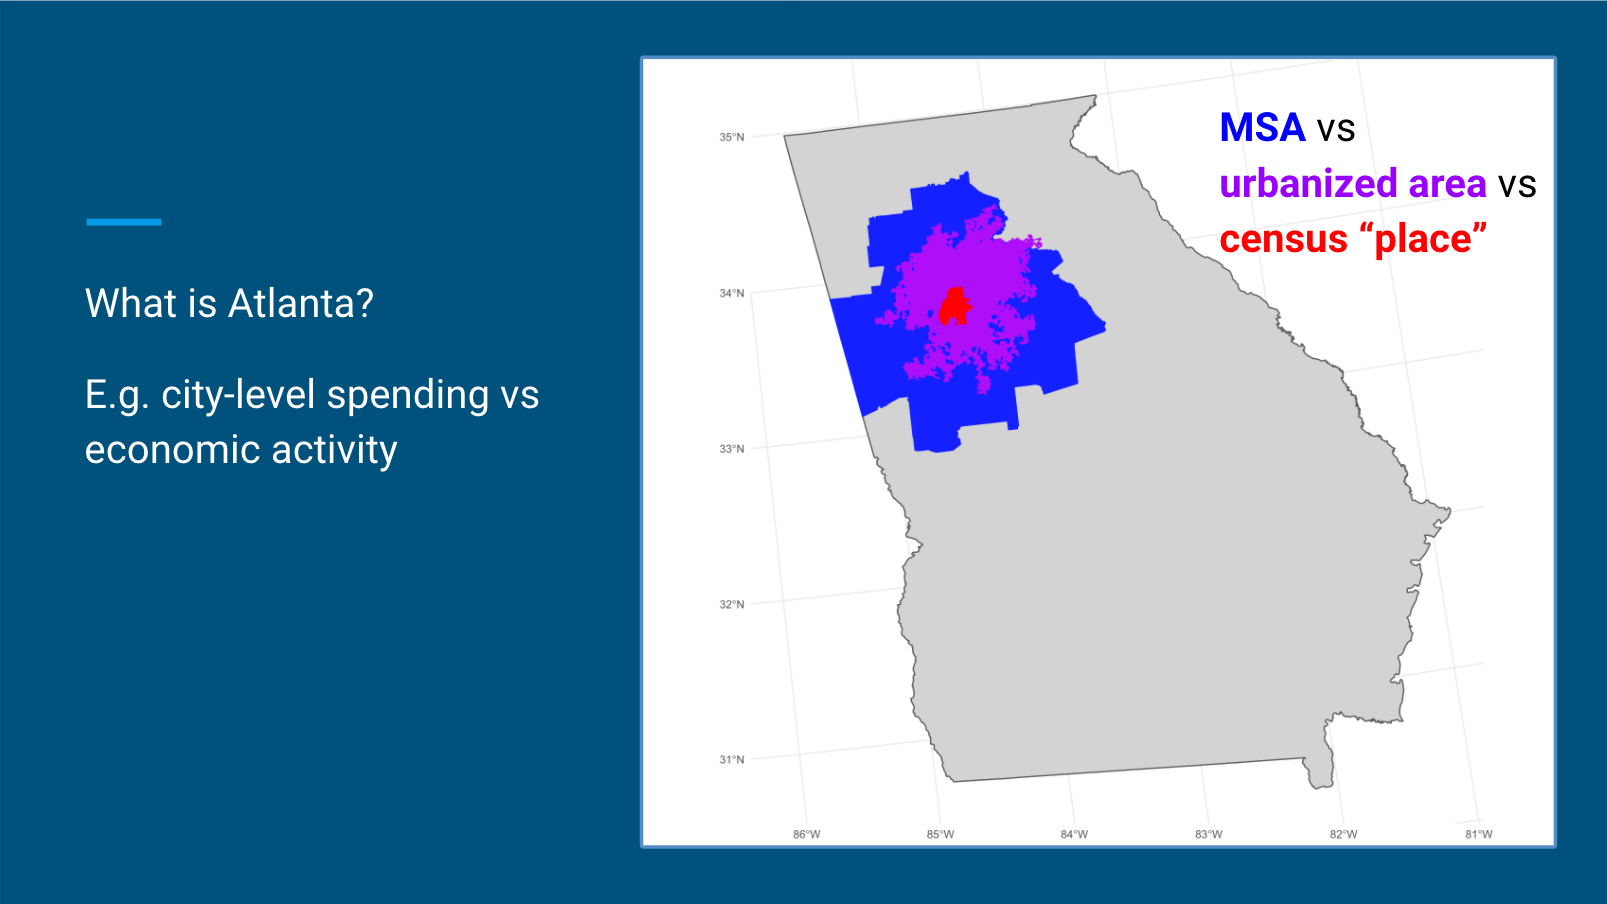
Atlanta
From Laura Bronner's slides about quant editing
What the heck is Atlanta?
Within a Dataset
tidylog (R), pandas-log (python)
because there is no Assignment 4....
ft. Derek Willis (formerly @ ProPublica)
When it's worth it...for me, almost always.
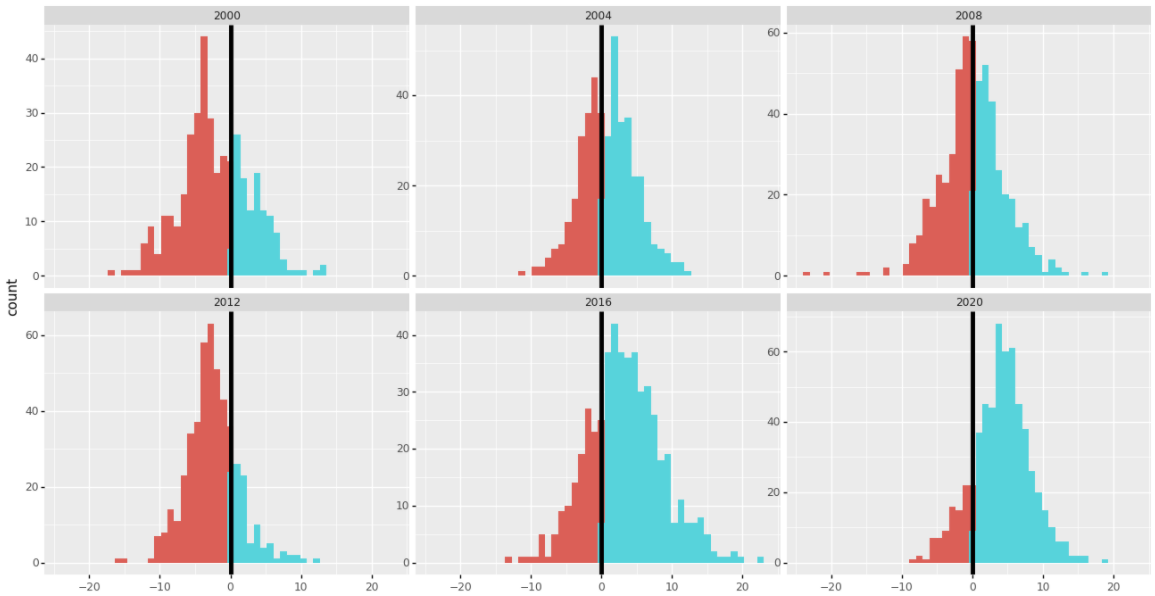
Do you need a model?
Is it regression time?
?
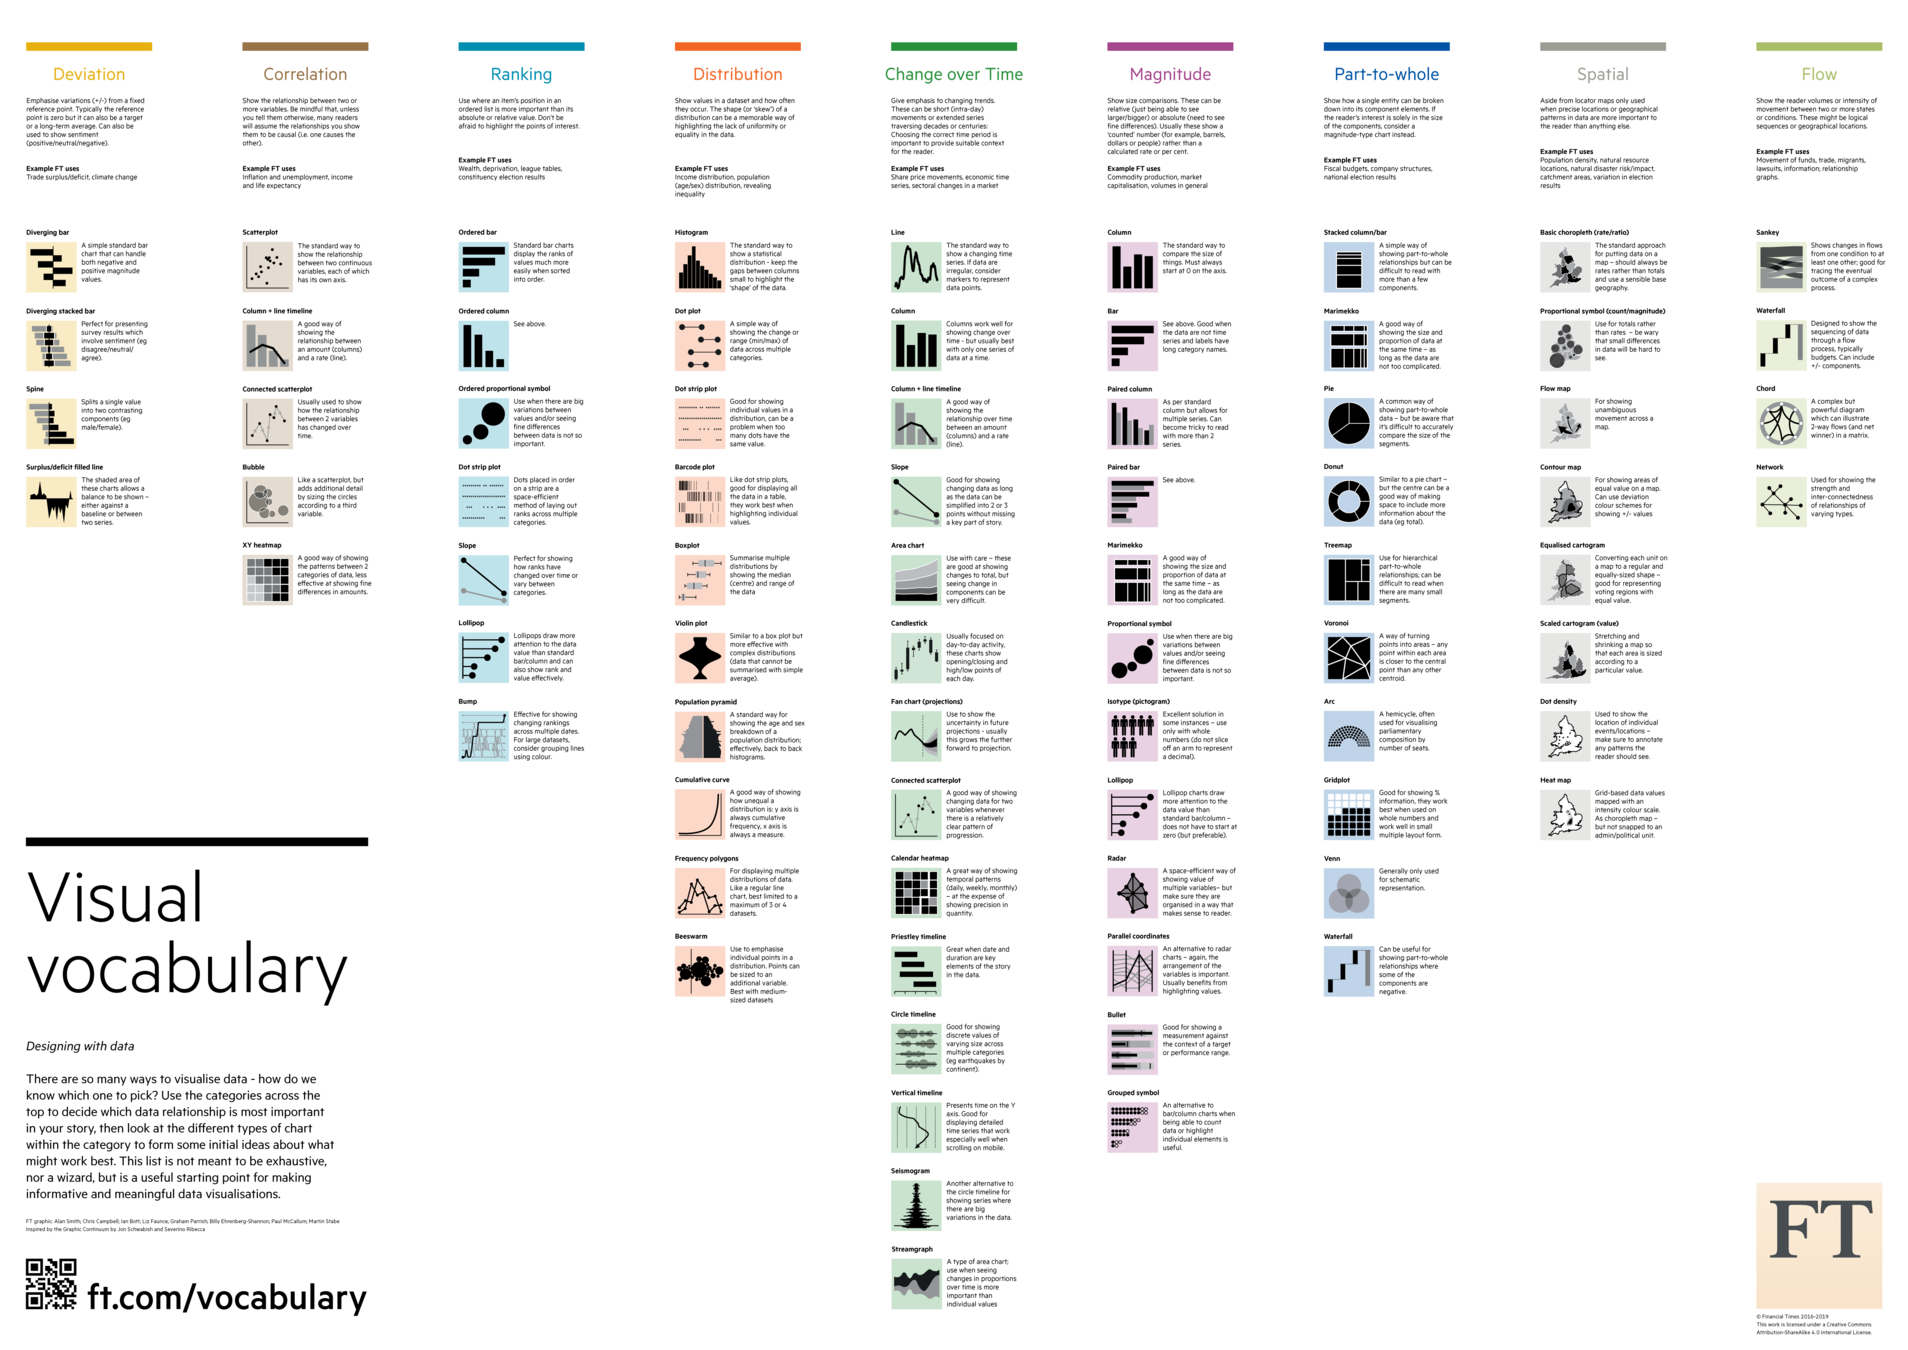
Annotate with text labels OR
Anything you want to run by Dhrumil & Aseem?
The Wall Street Journal Guide to Information Graphics
The Quartz guide to bad data
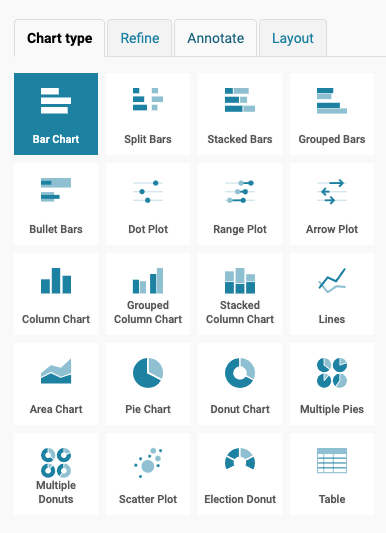
Very short Datawrapper assignment (Assignment 3.5❓👀❓👀)
Project Work [Tonight-ish]
Project Reporting / Data Analysis
By Dhrumil Mehta


