


Diego García Díaz
GIS & Remote Sensing. Python & Statistics. Surf & MTB :)
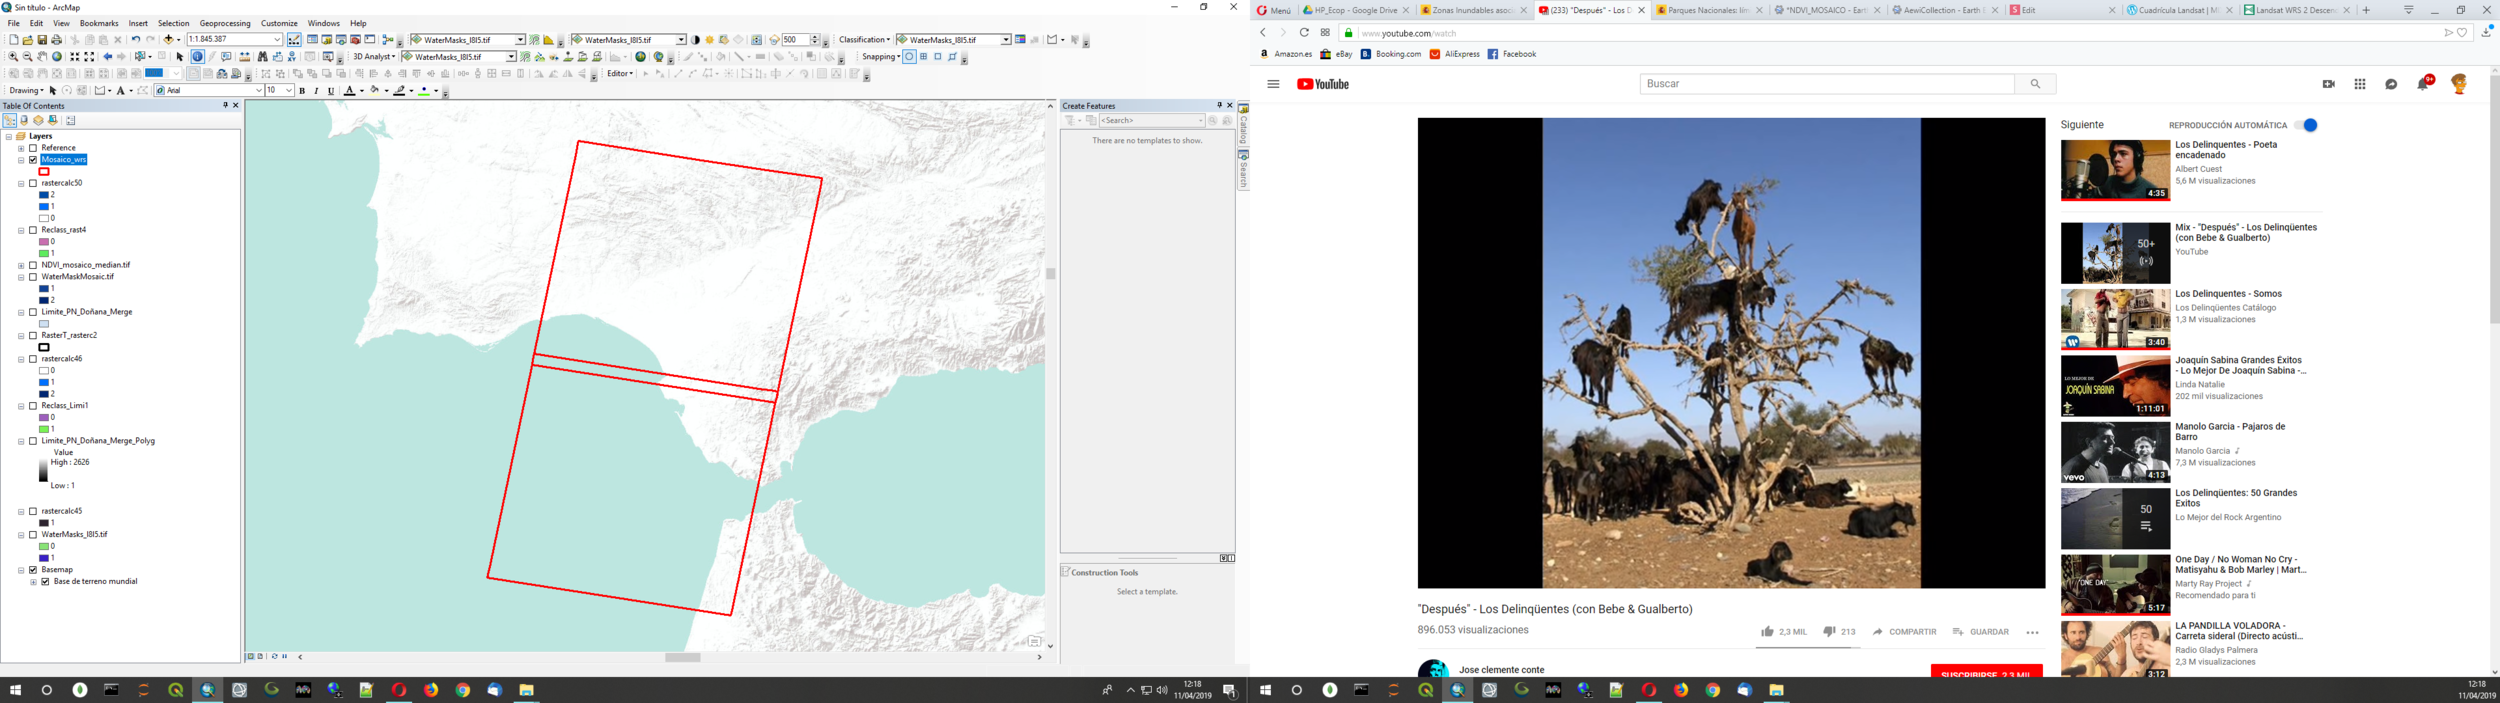
Two Landsat Scenes to cover the Gulf of Cádiz:
202/34 & 202/35 (115423041 pixels)
Our method to get the flood is based in a treeshold in the SWIR-1 band. This can lead to errors with vegetation and specially with shadows (both, topographic and clouds).
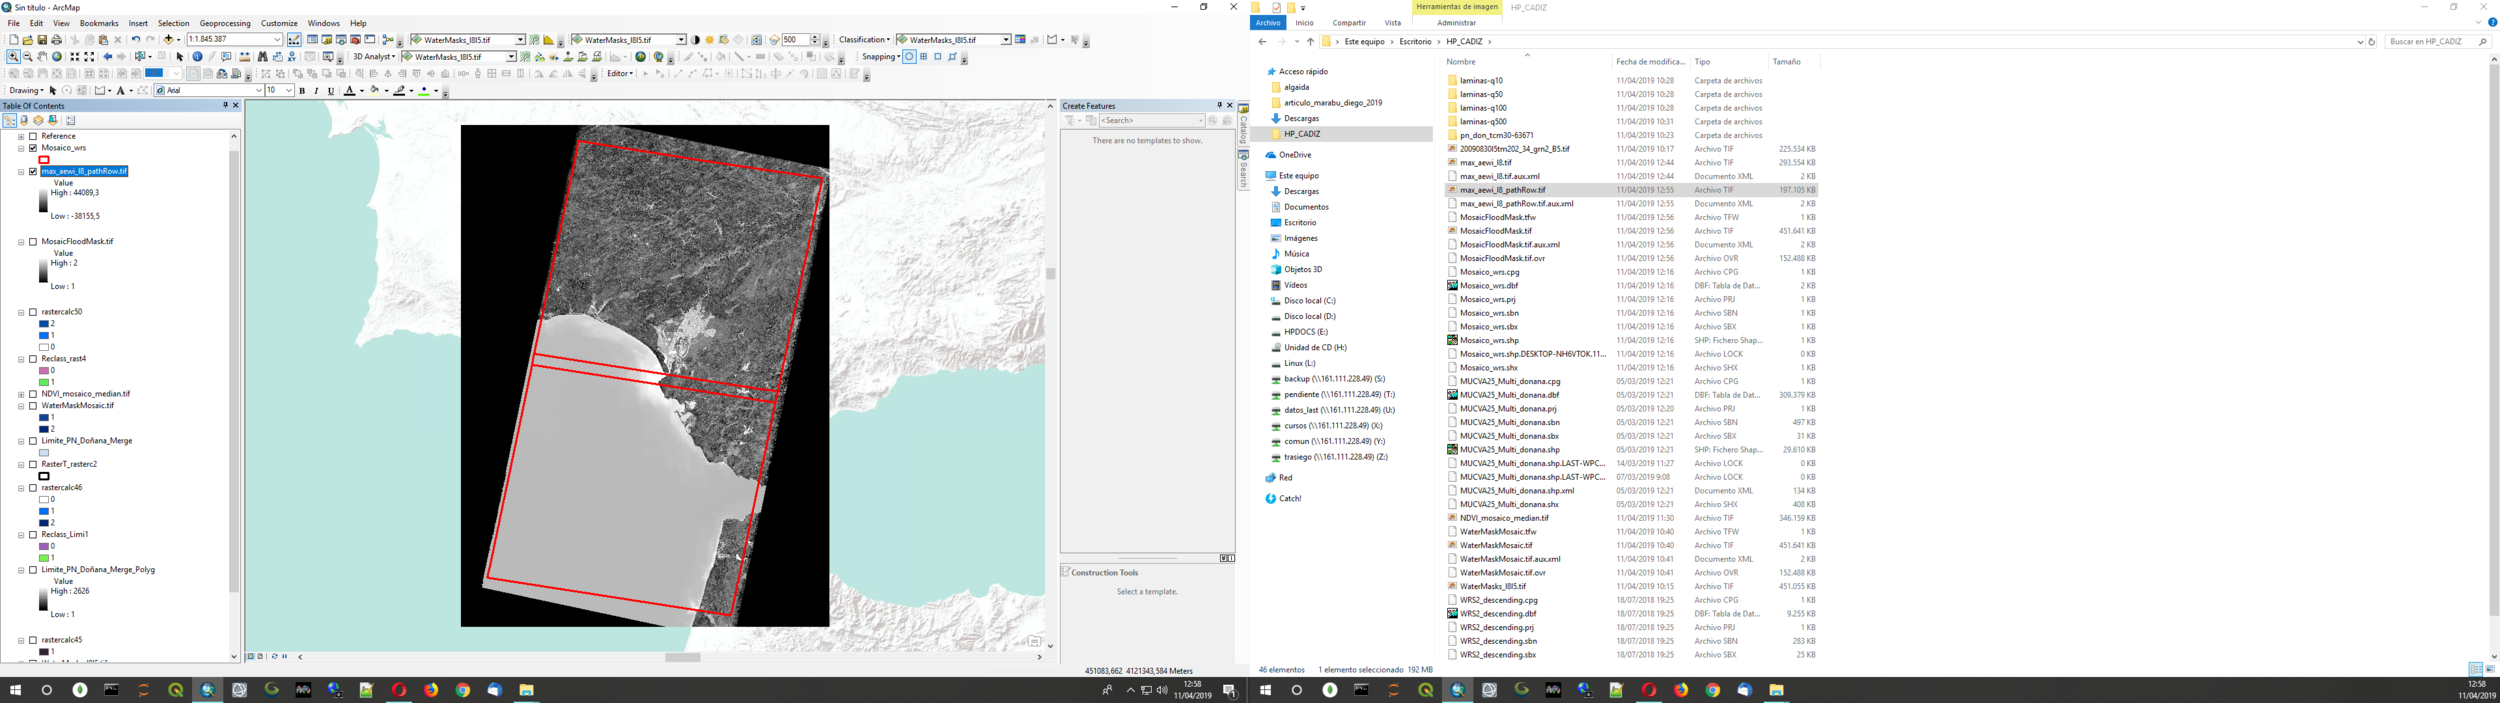
In order to avoid that, we need a Maximun Water Extent Mask. To get his mask we have perform the AEWInsh (Feyisa et al. 2014) Water Index to the whole collection of Landsat 5 TM and Landsat 8 OLI (don't use Landsat 7 ETM because we don't have an appropiate method to fight with Gapfill in th scene 202/35)
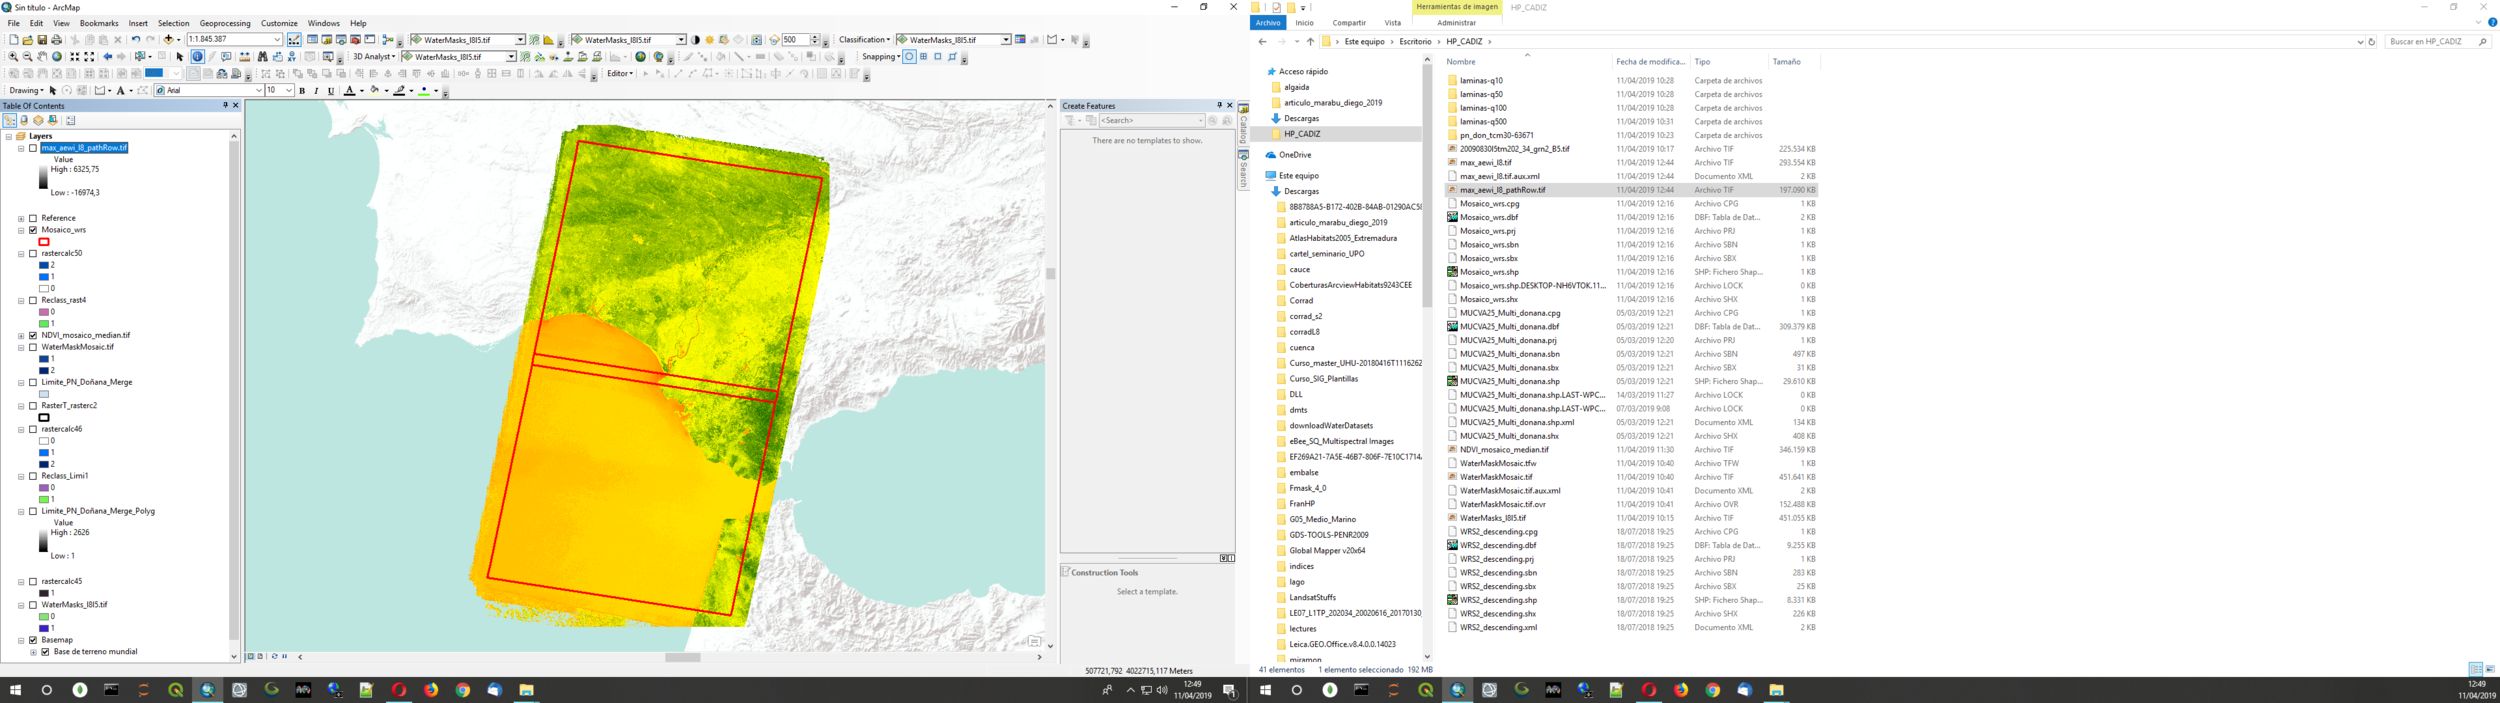
Still, we could have problem with the vegetation, so we also have calculated the median of the NDVI for each pixel, and we have removed from the AEWInsh those pixels which NDVI median for the period 1985-2018 is bigger than 0.5, assuming (and checking) than these pixels are perennial vegetation)
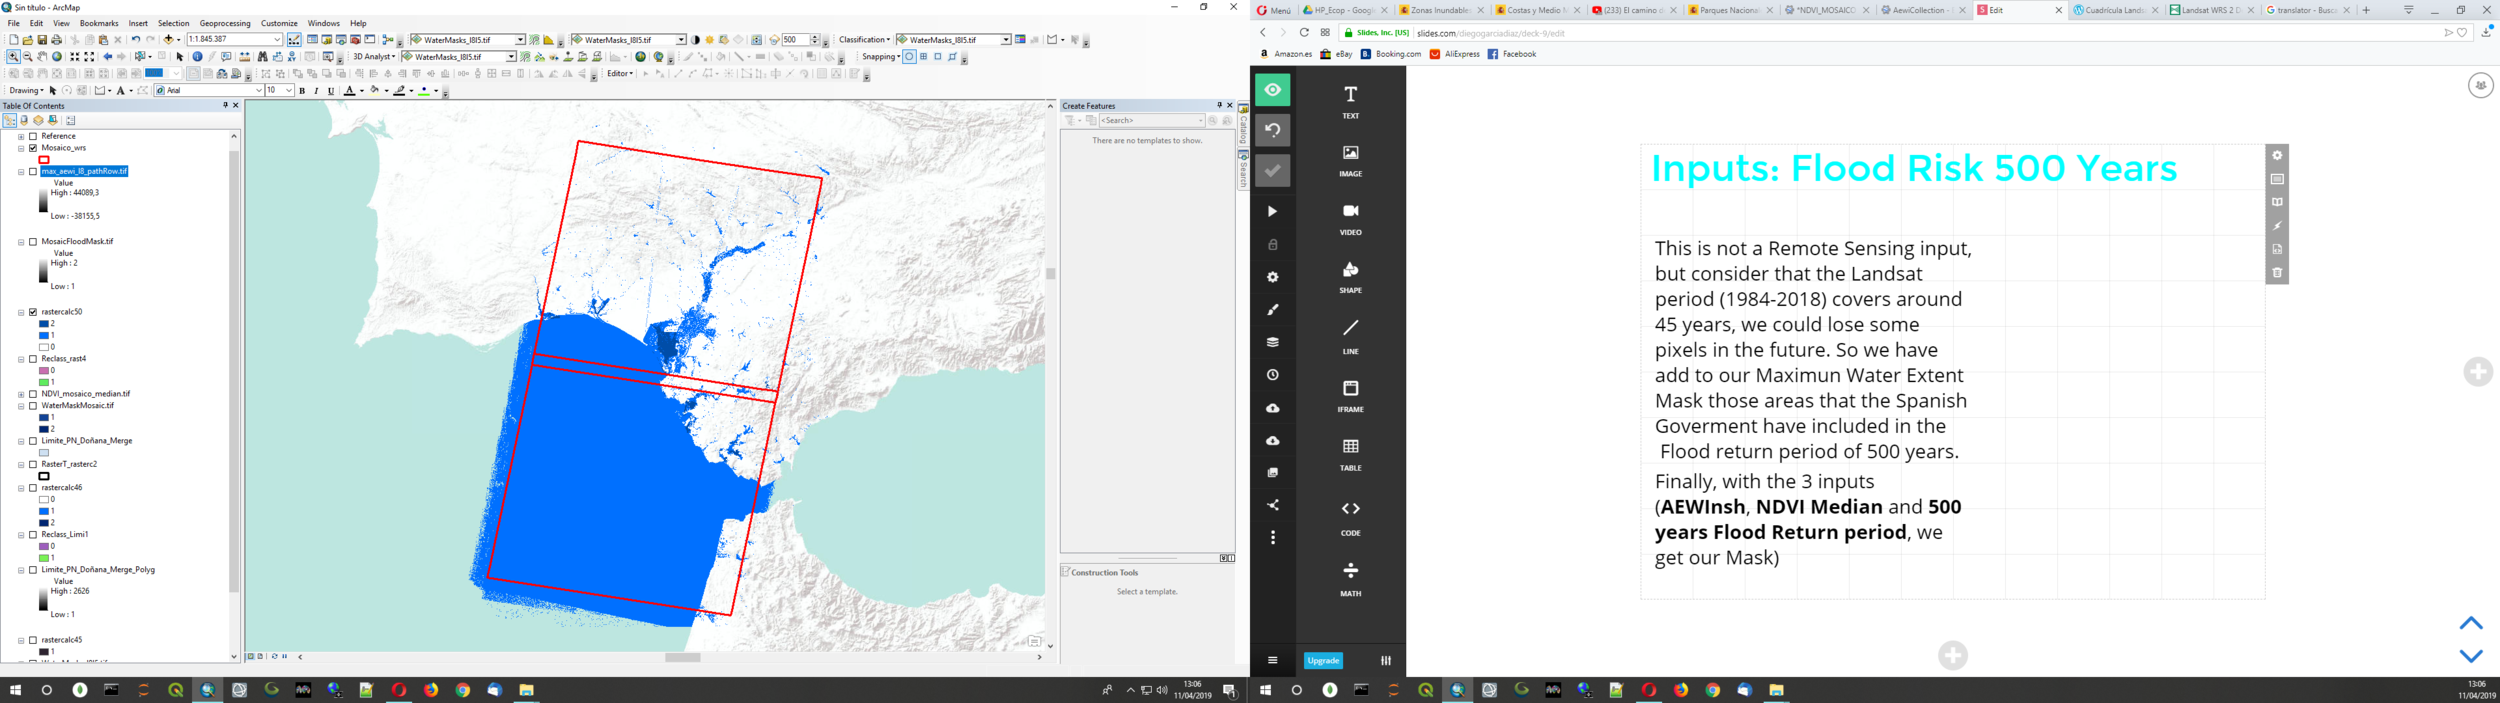
This is not a Remote Sensing input, but consider that the Landsat period (1984-2018) covers around 45 years, we could lose some pixels in the future. So we have add to our Maximun Water Extent Mask those areas that the Spanish Goverment have included in the Flood return period of 500 years.
Finally, with the 3 inputs (AEWInsh, NDVI Median and 500 years Flood Return period, we get our Mask)
To apply the treeshold to the SWIR-1 to determined the water, we perform a normalization of the whole Landast Time Series with some Pseudo Inavriant Areas from a reference scene (referencia).
We use a Dark Object Substraction Method (Referencia Pons y Pesquer). So we need the Kl values, that we find looking in the shadows and the deep water pixels. We do it using a hillshade generated for each scene and Fmask.
We calculate the OLS between the reference image and the current scene for each band.
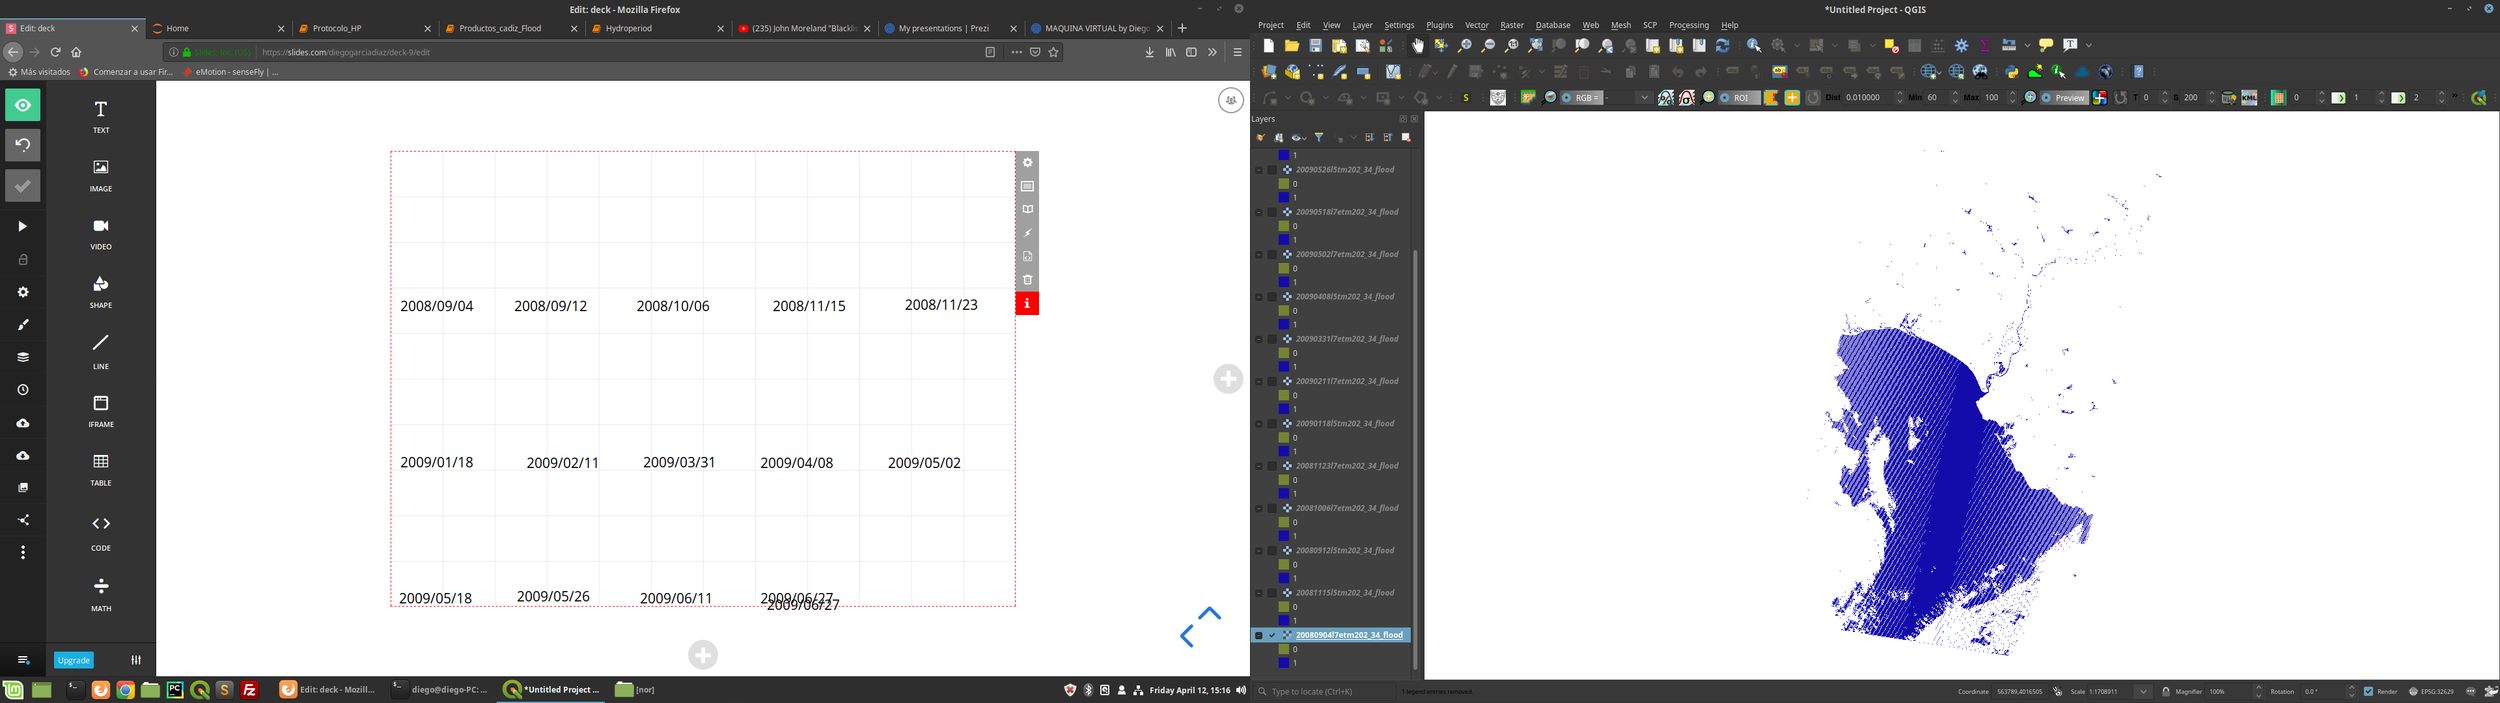
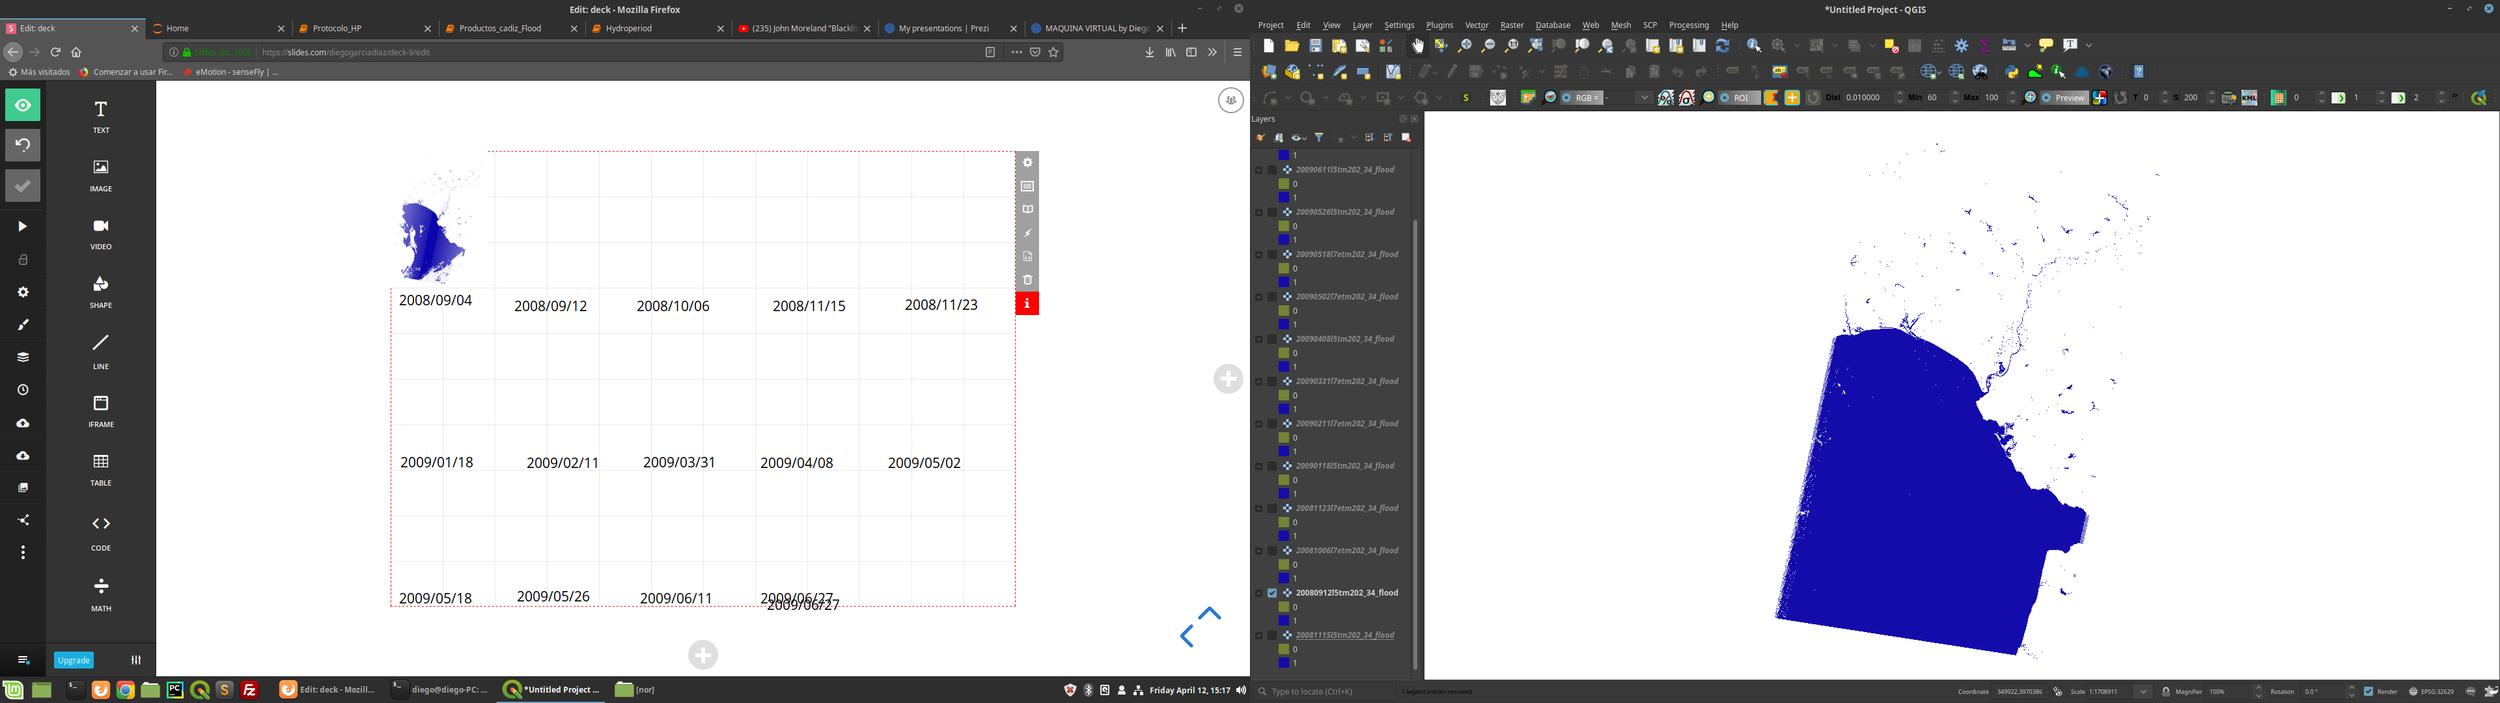
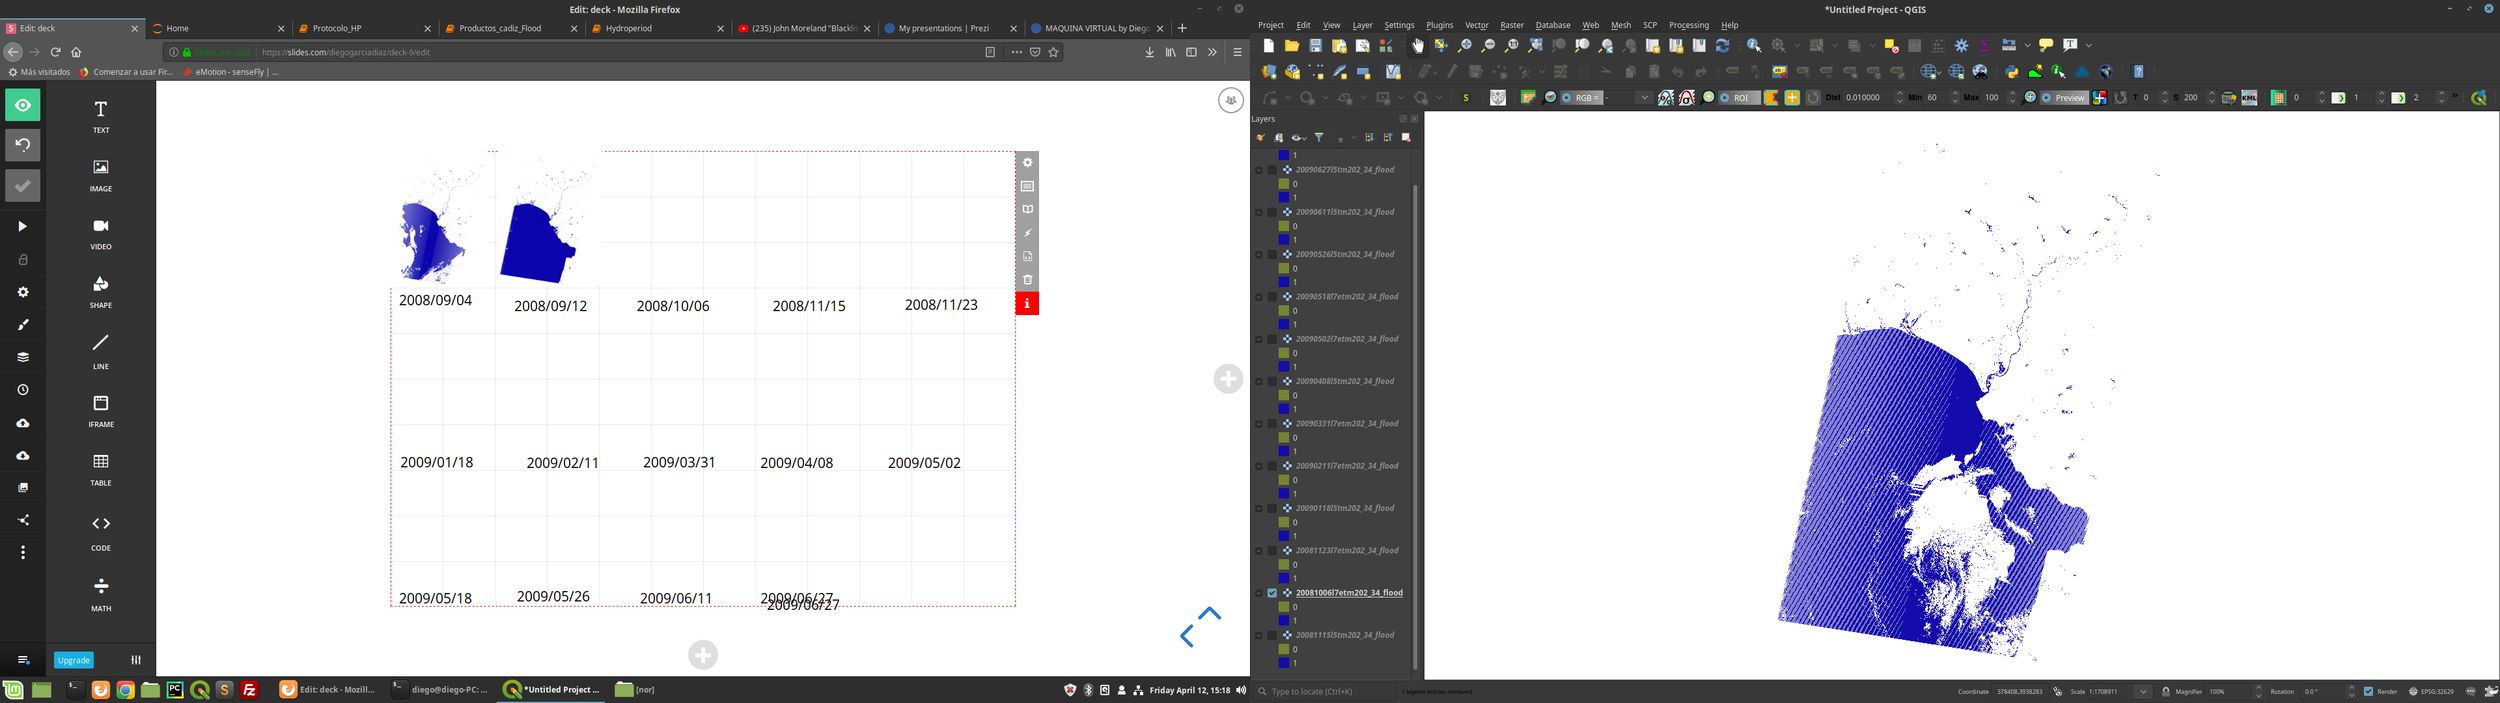
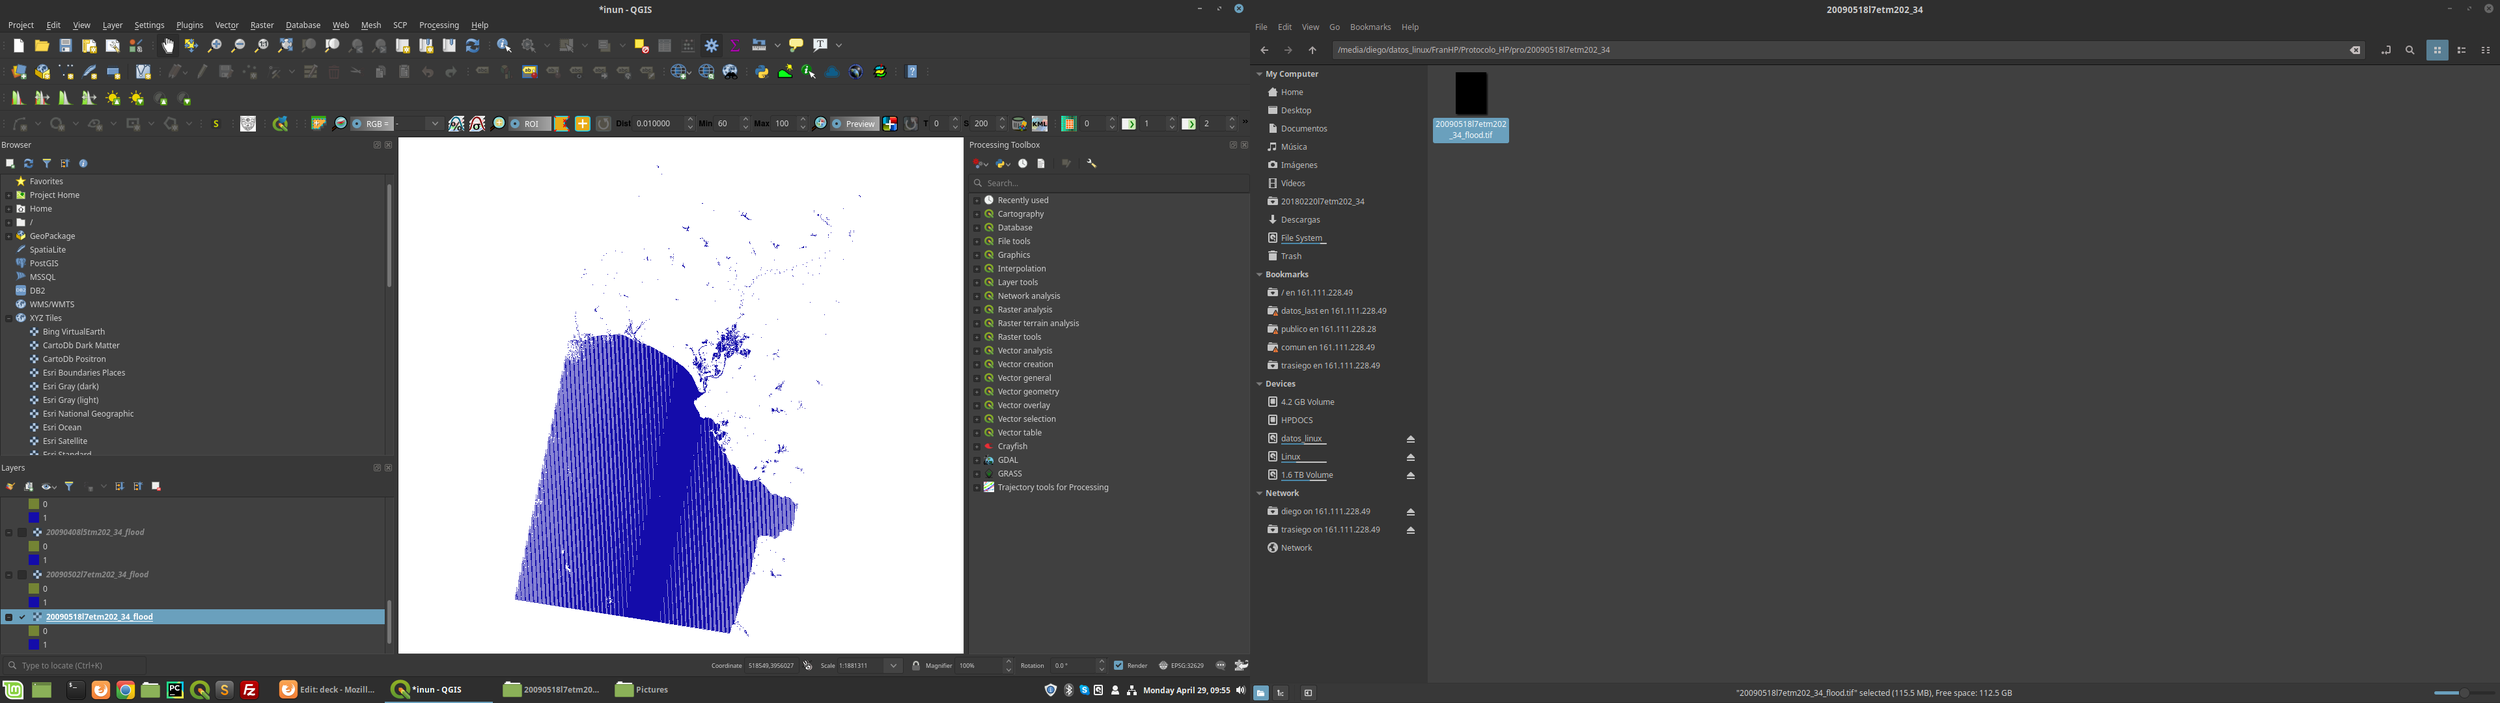
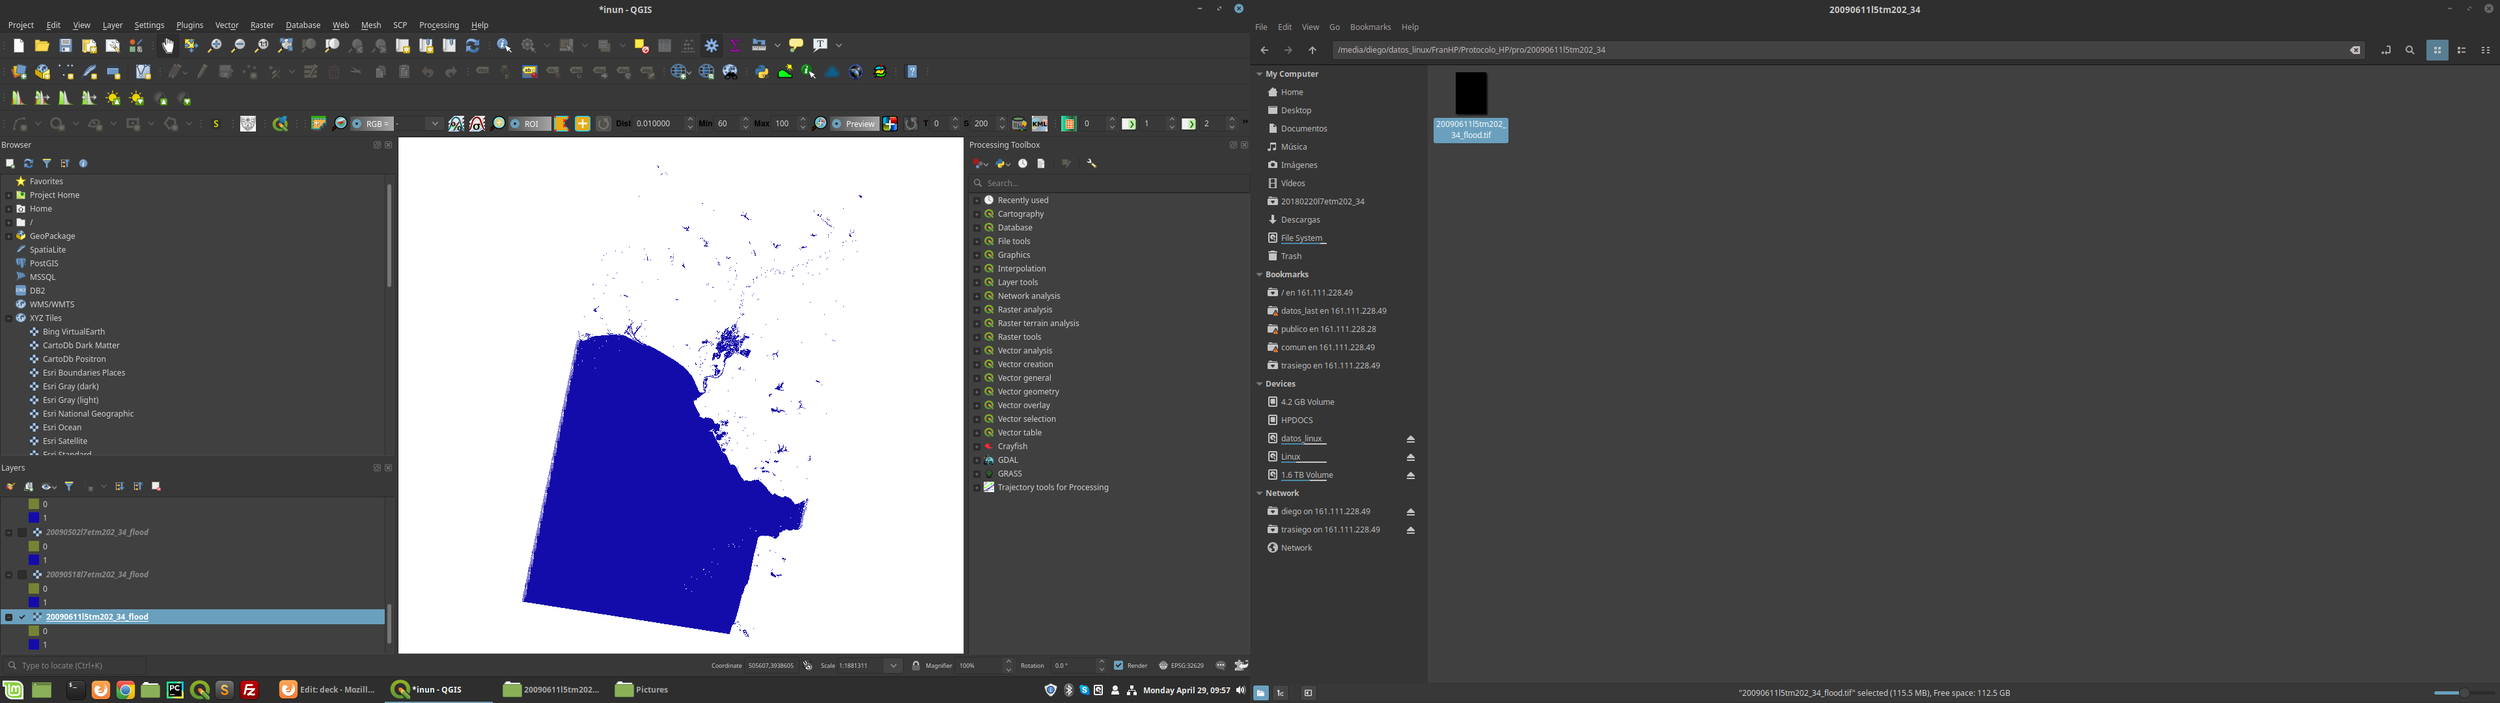
Finally, we calculate the Flood mask for the scene crossing the treeshold with the Maximun Flood Mask
kl
Surface Reflectance
Nor
Normalized Reflectance
Kl Values
DTM
Hillshade
Scene
Fmask
Flood
Maximun Flood Mask
PIAs
SWIR-1 Treeshold
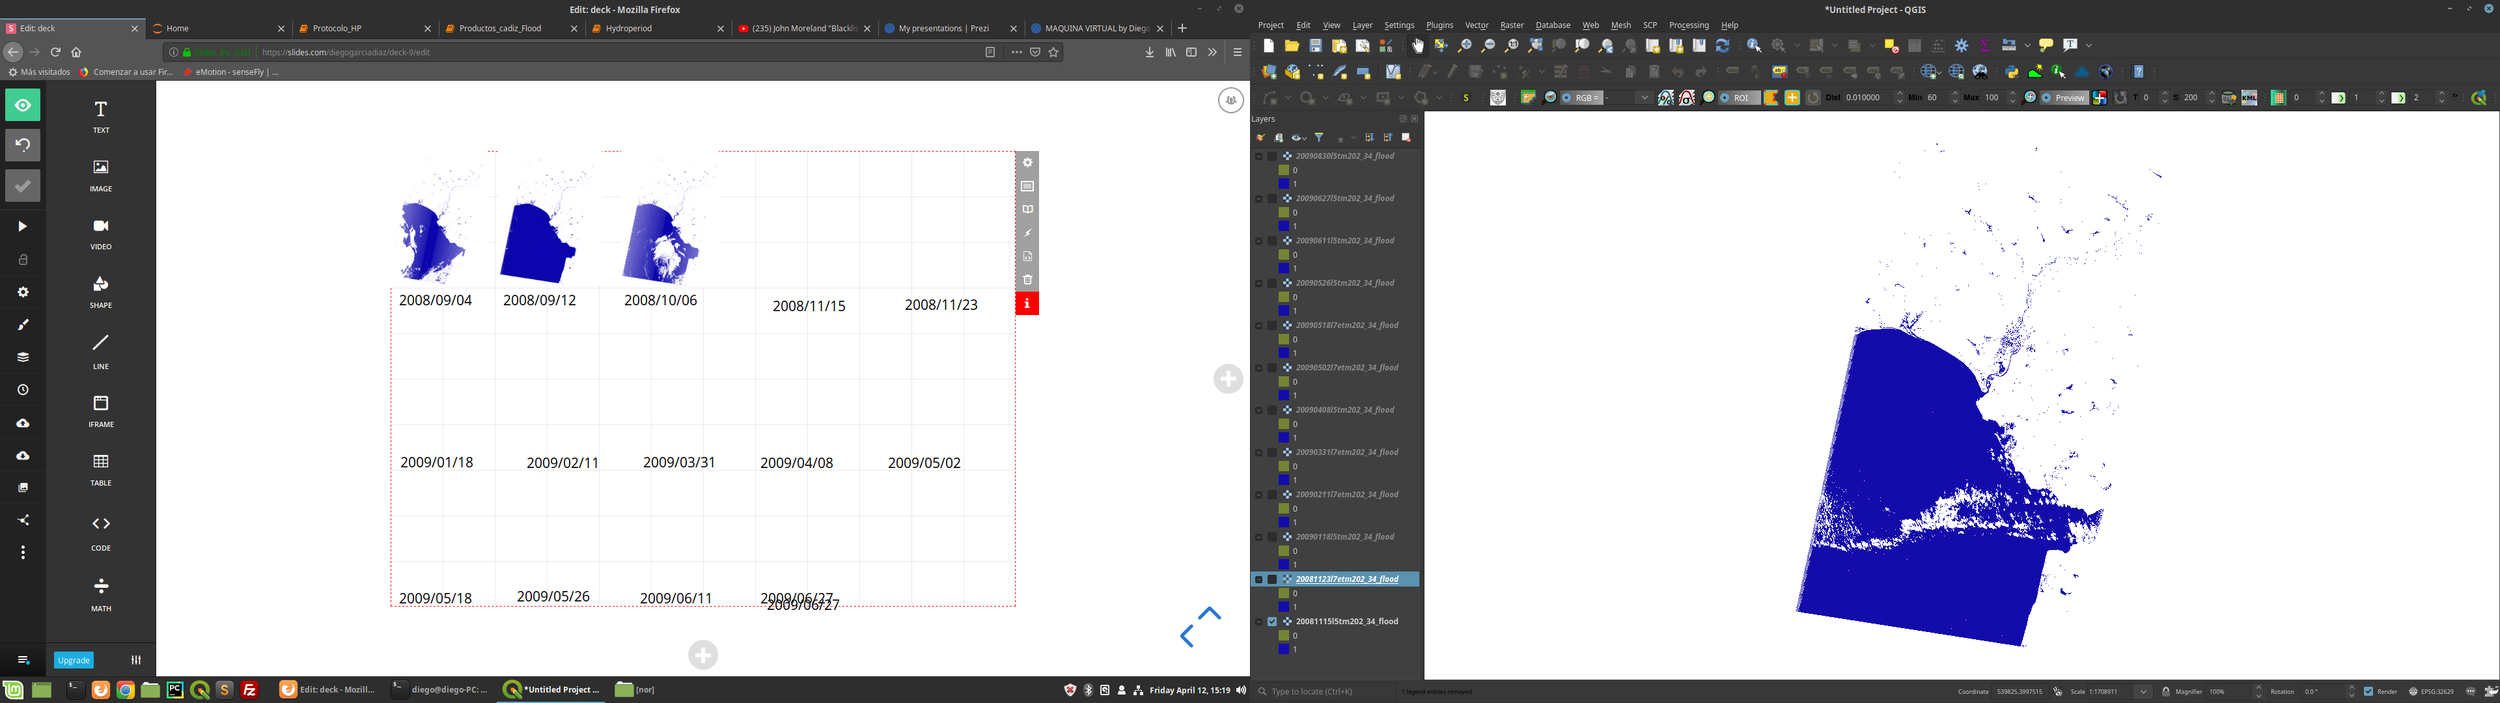
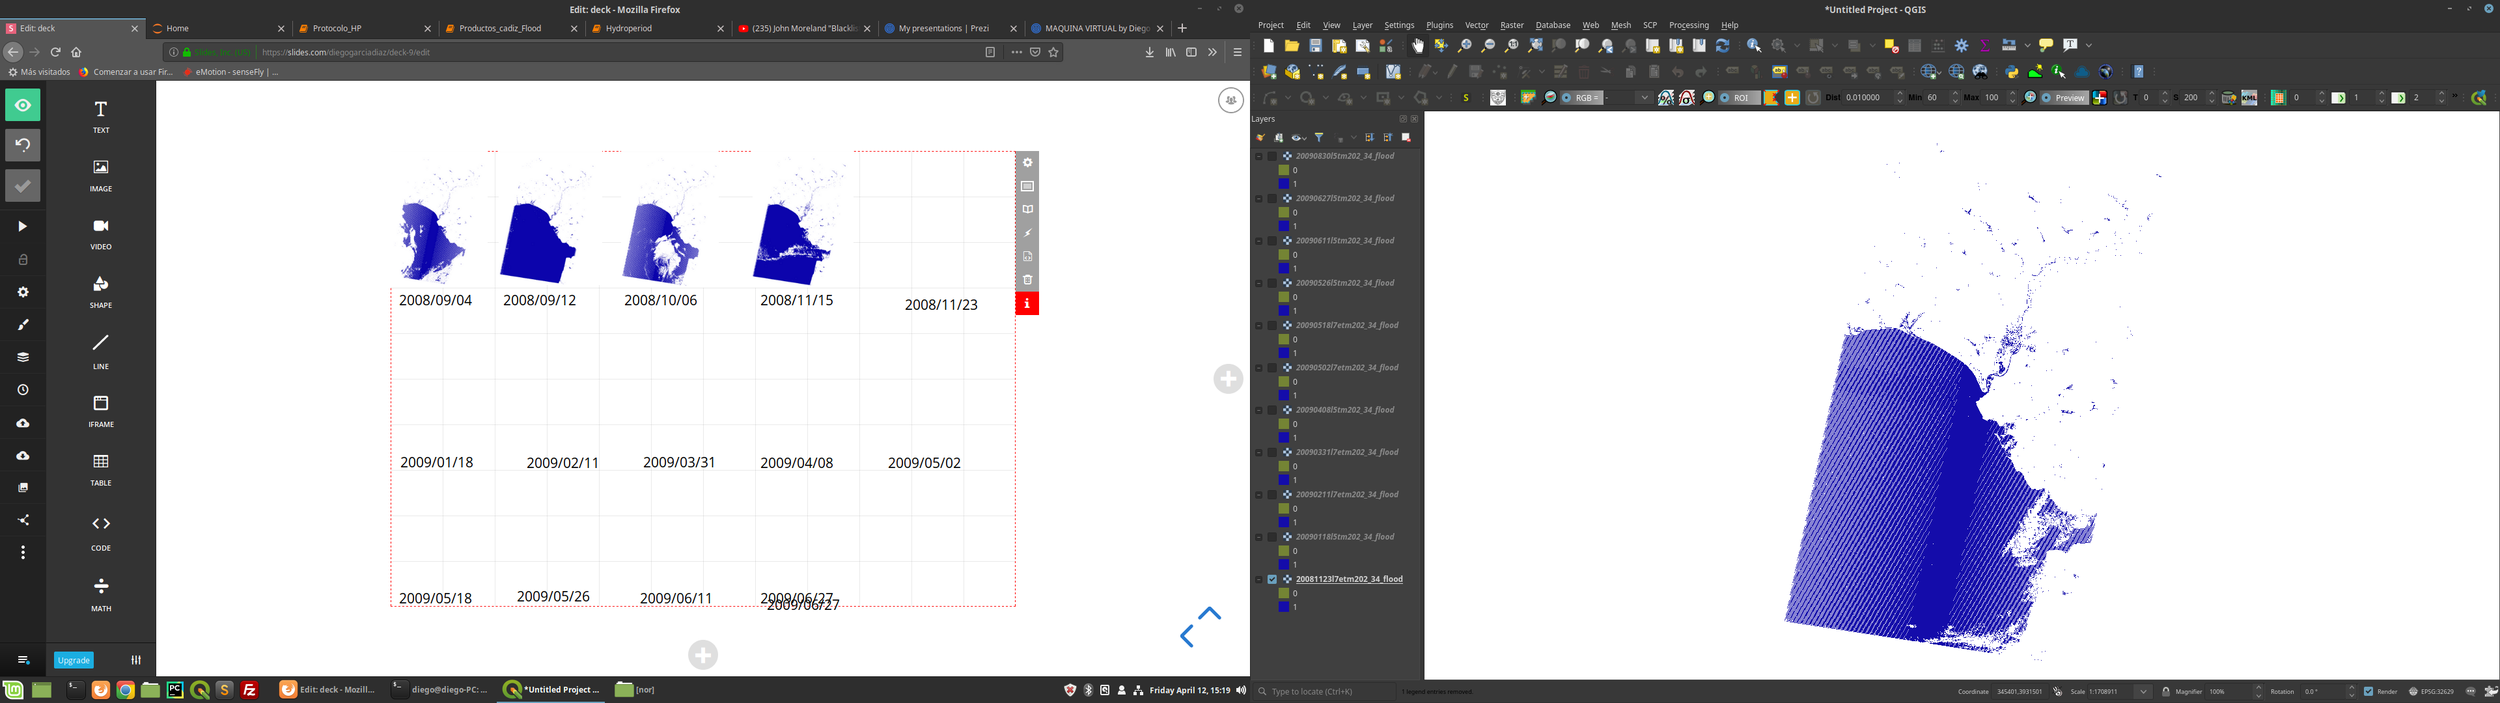
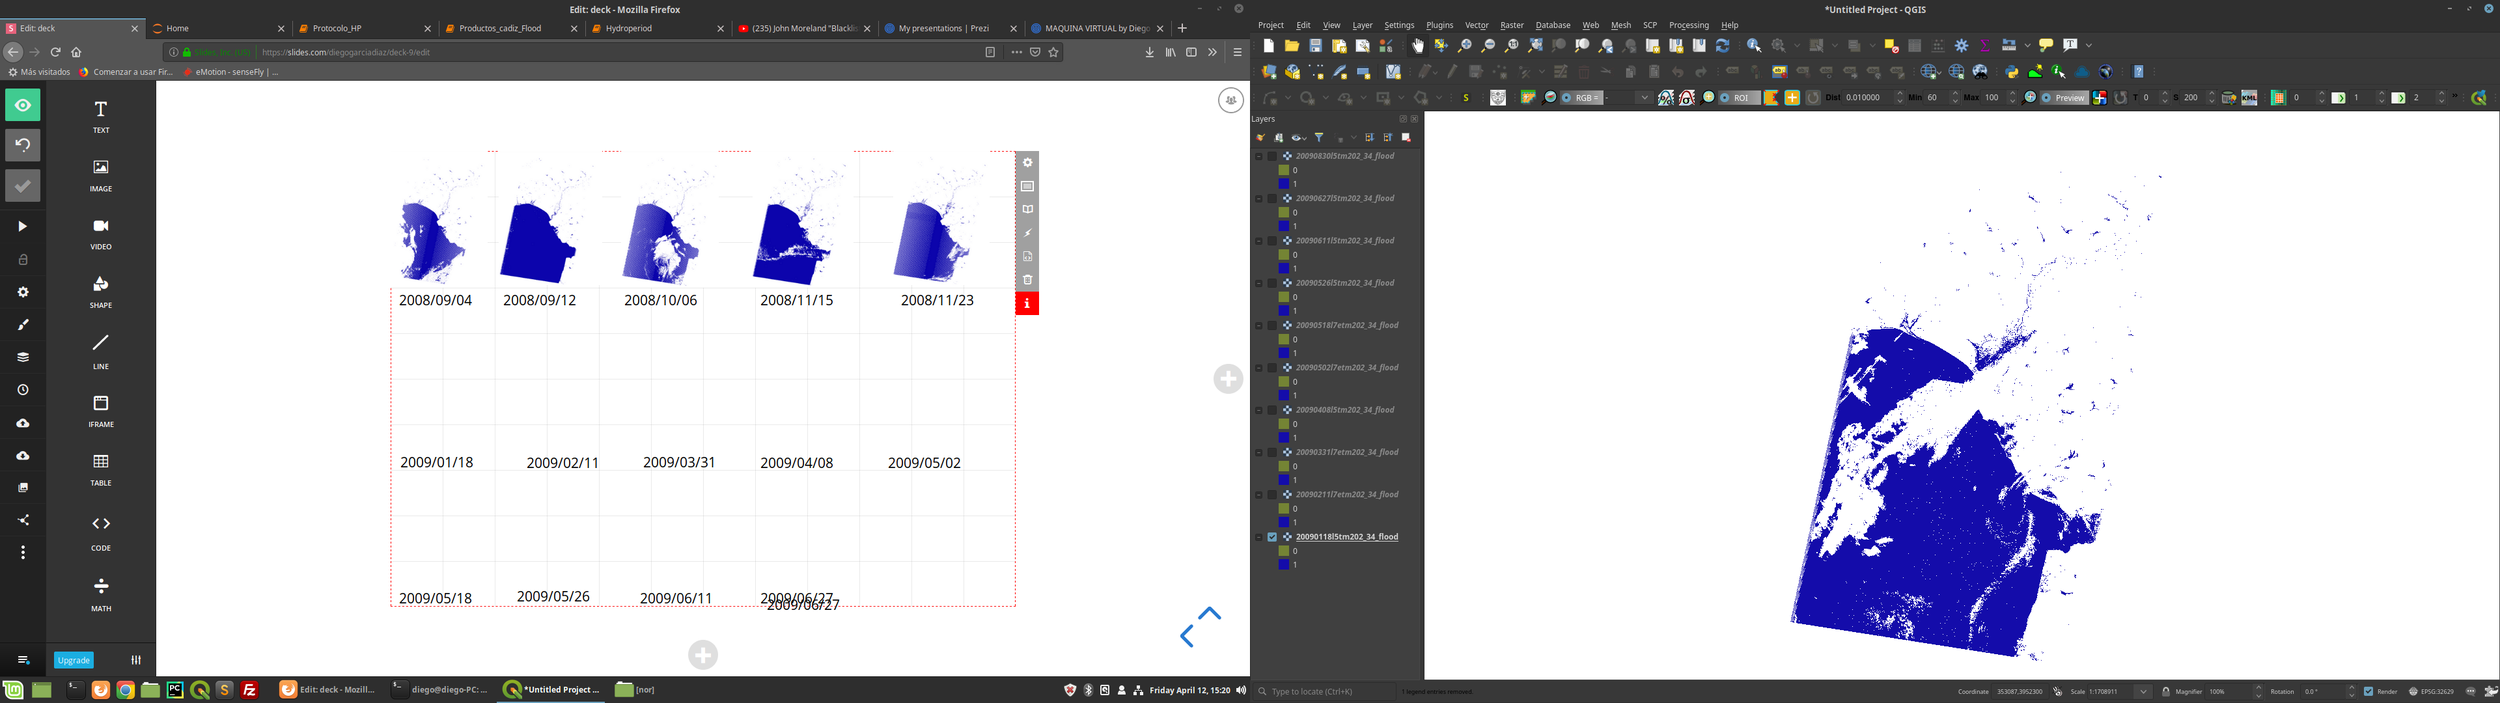
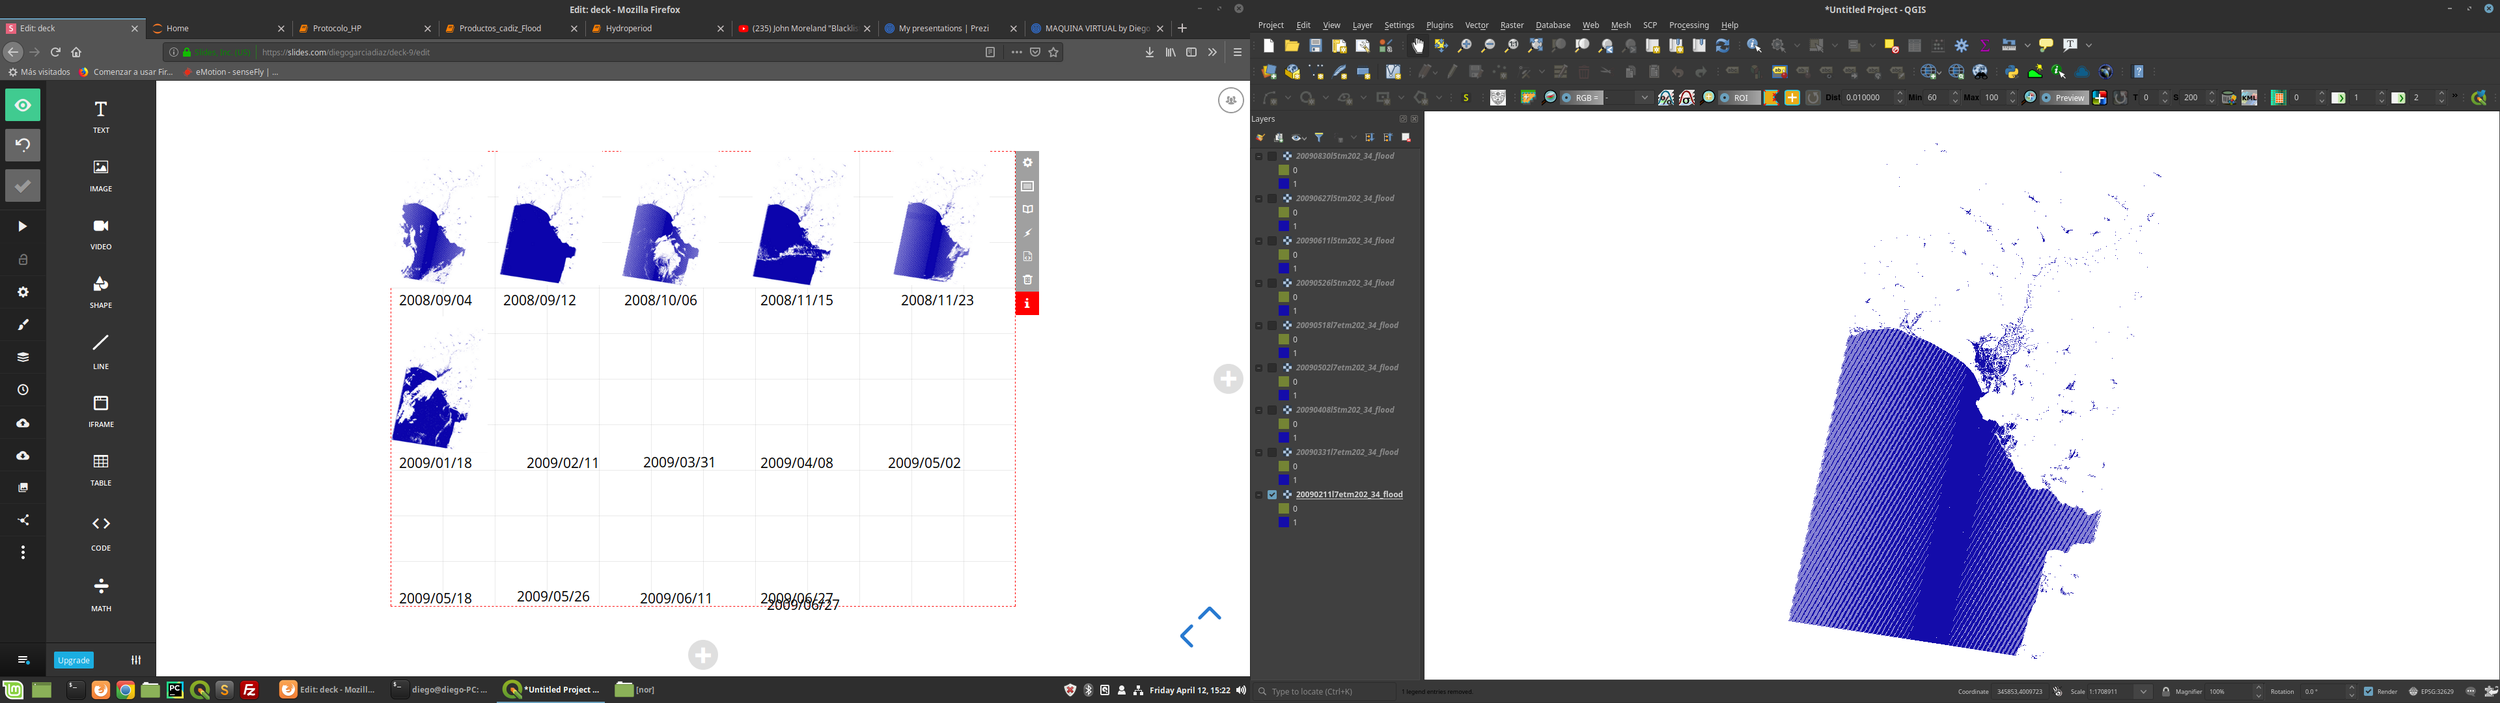
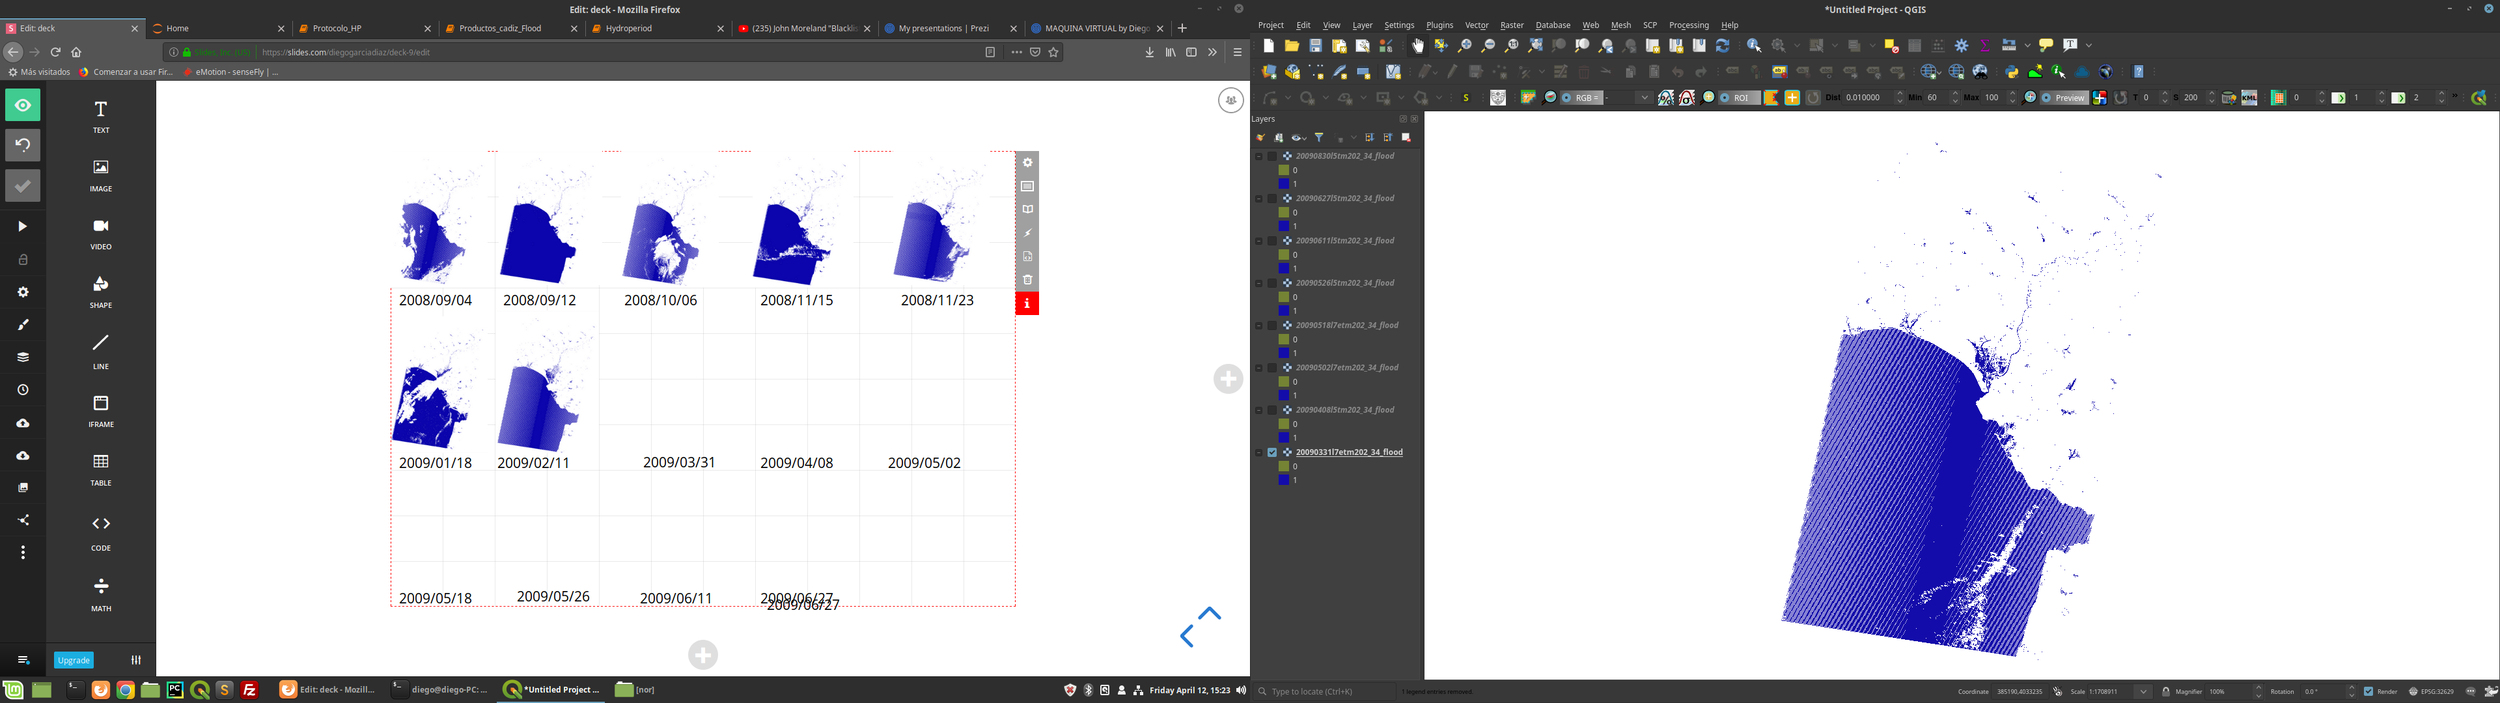
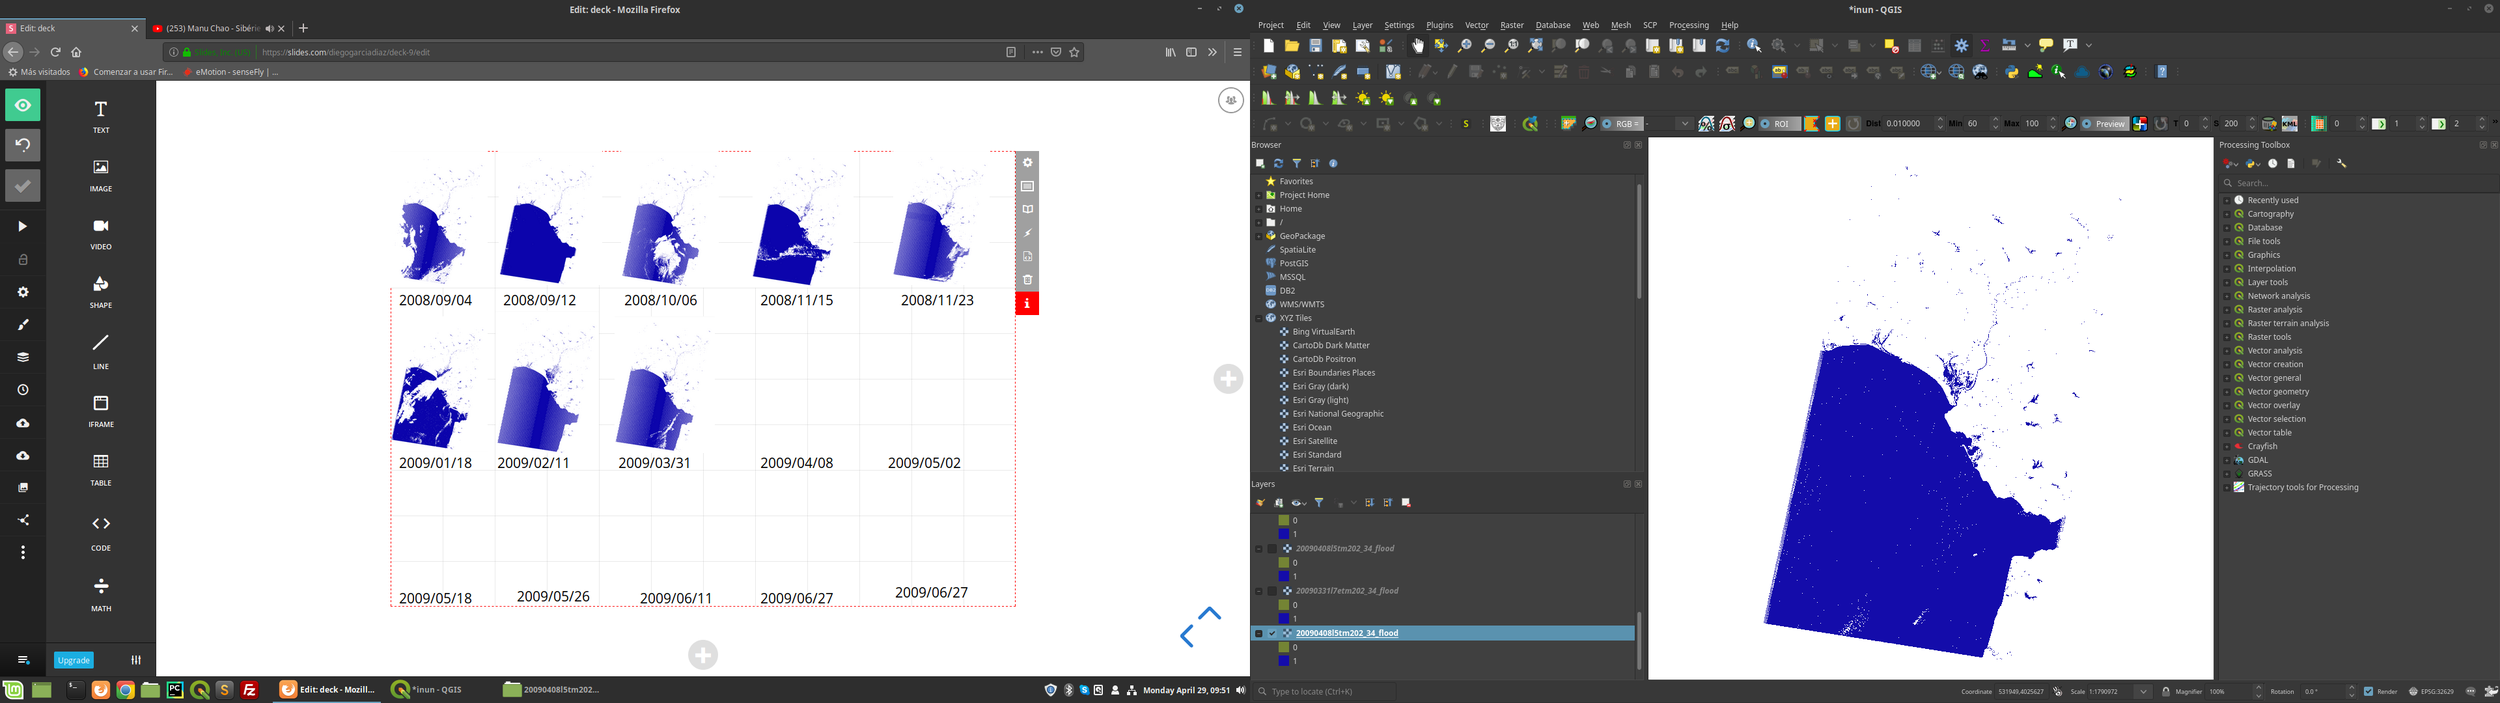
2008/11/15
2008/09/04
2008/09/12
2008/10/06
2008/11/23
2009/01/18
2009/02/11
2009/03/31
2009/04/08
2009/05/02
2009/05/18
2009/06/11
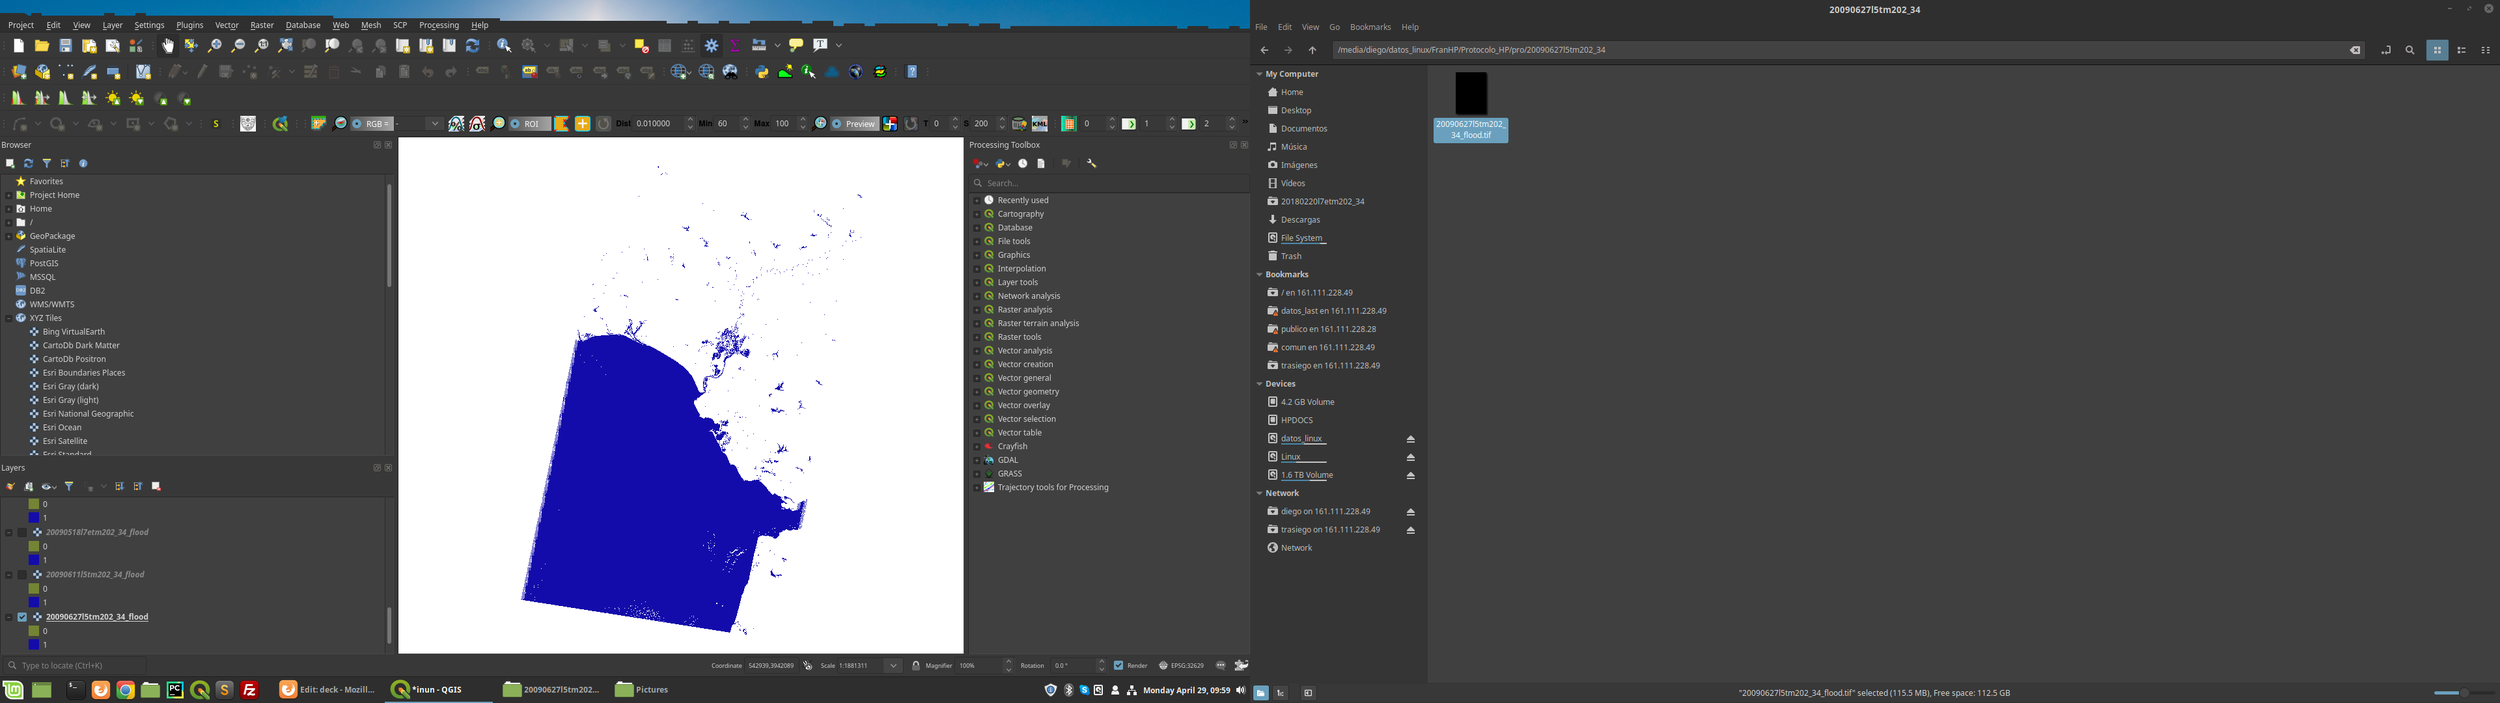
2009/06/27
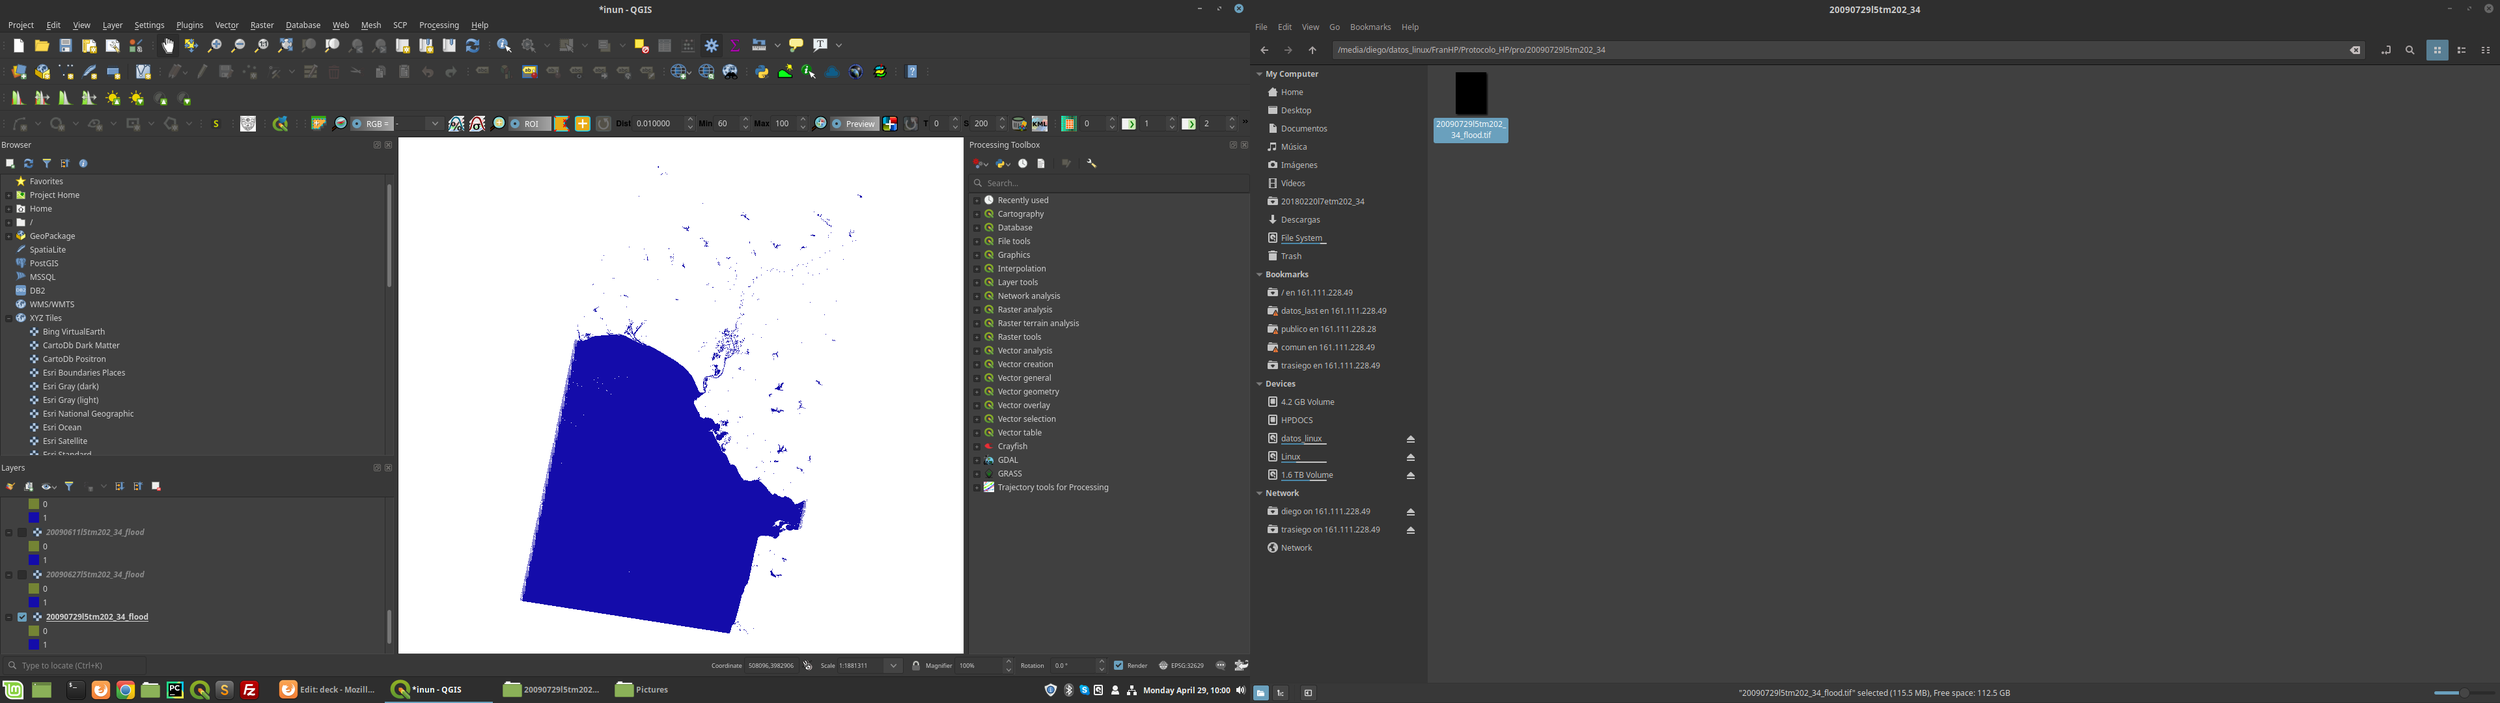
2009/07/29
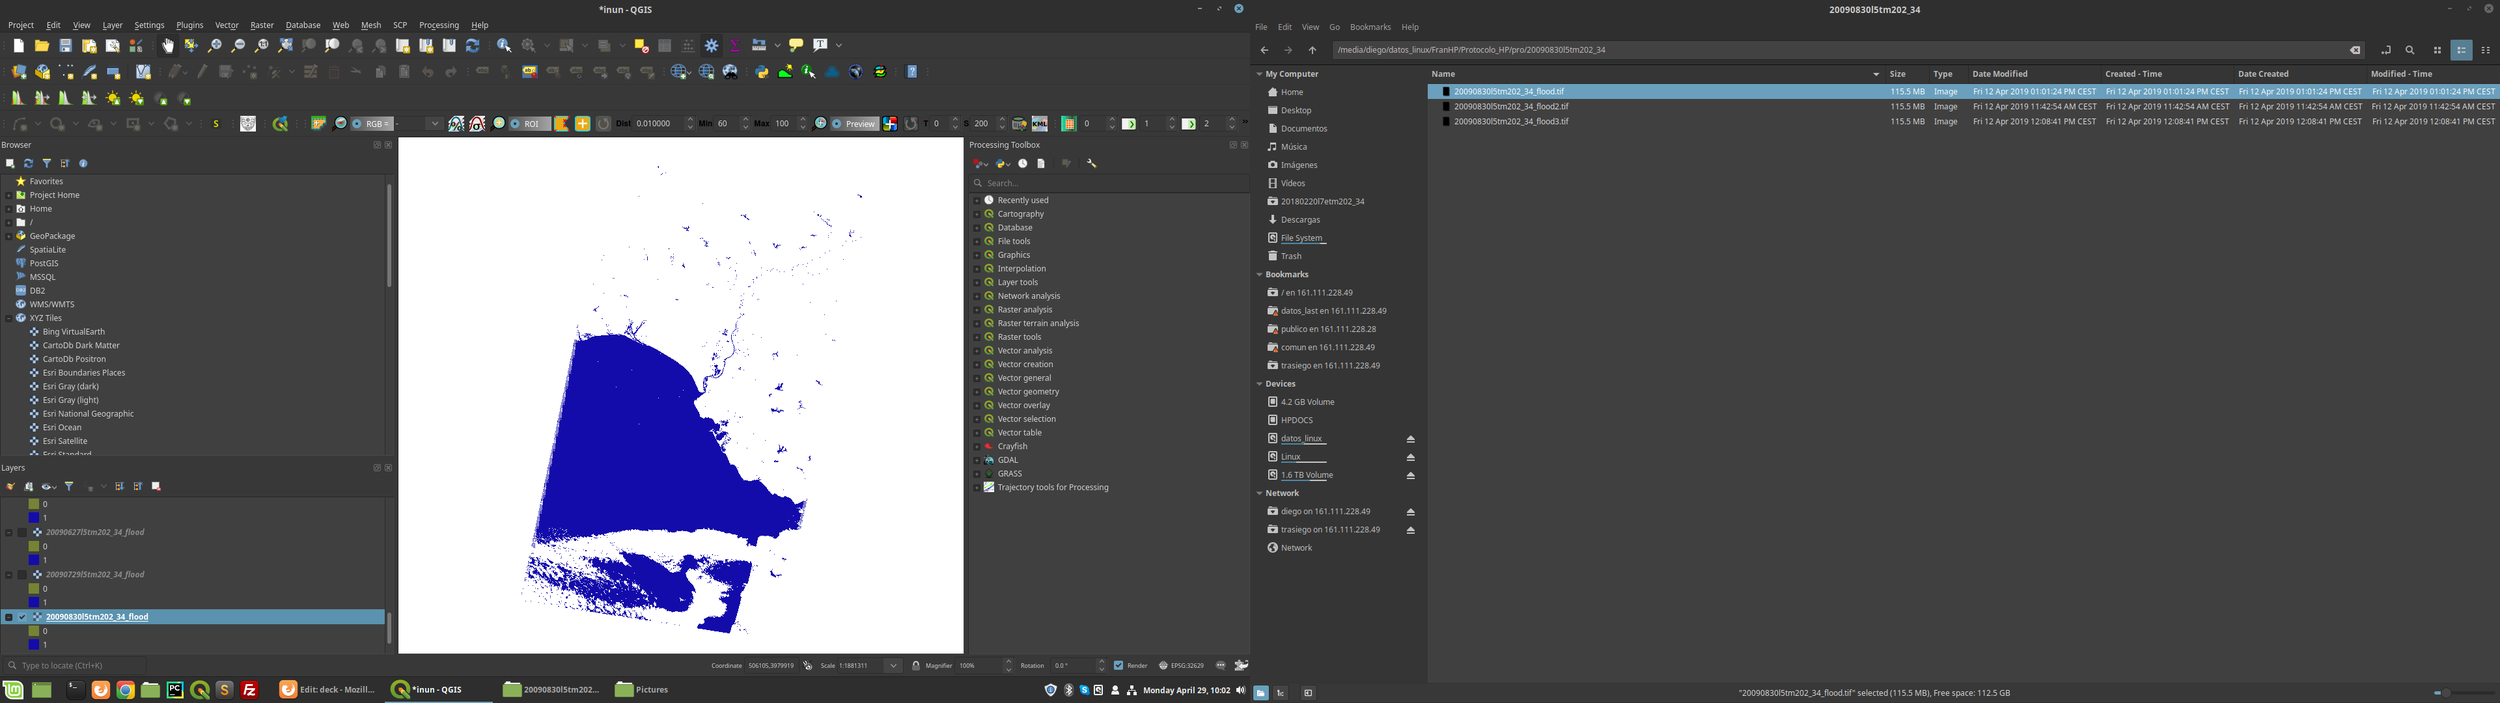
2009/08/30
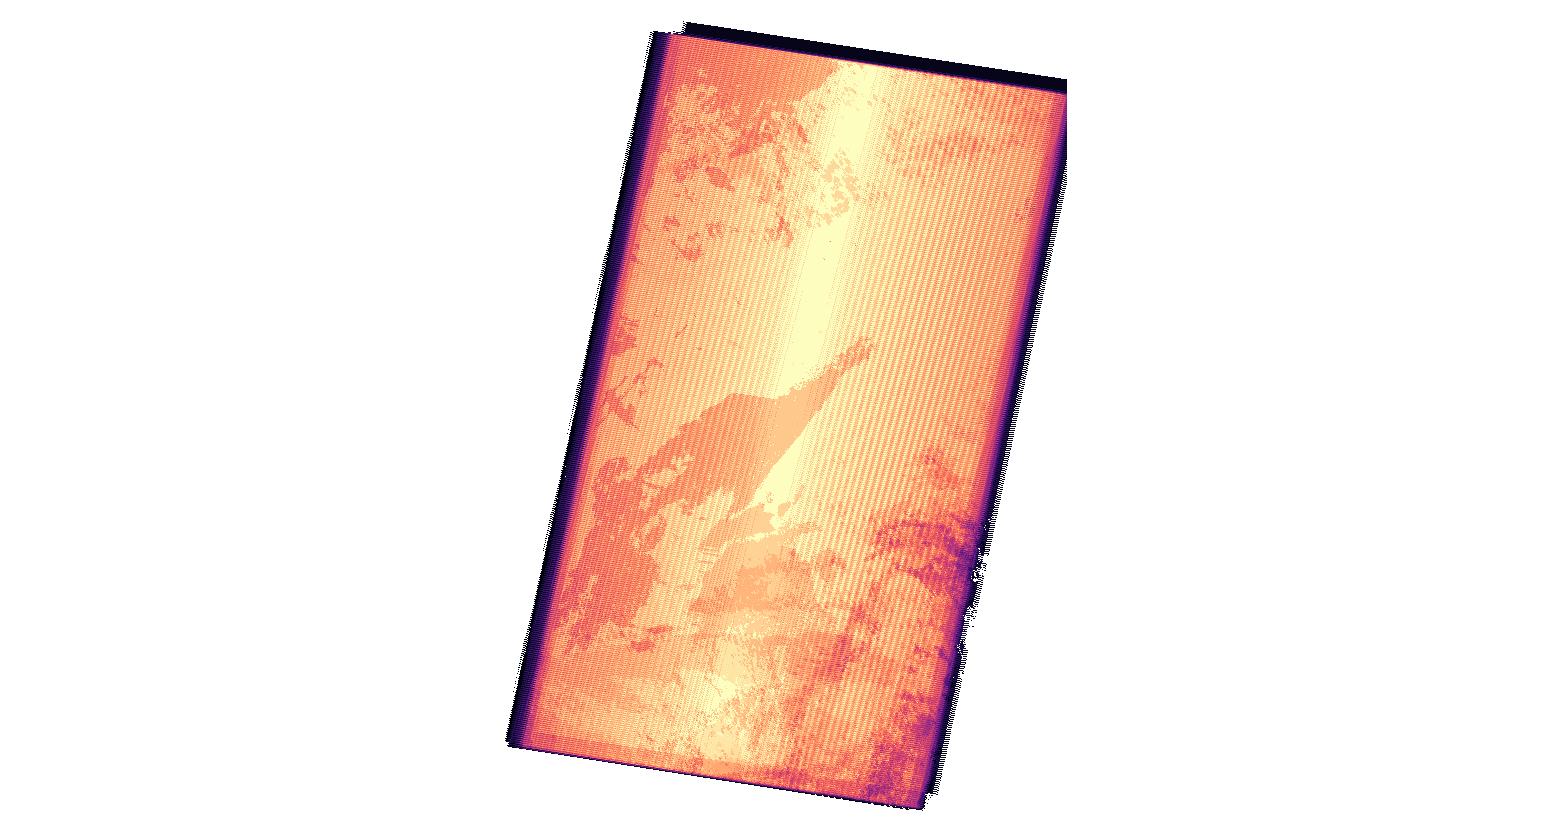
When we try to calculate the hydroperiod we have problems with NoDatas. Same with Landsat 7 Gaps, with can throws mistakes in the number of days flooded.
Our way to solve this problem, is calculate the number of days with valid data for each pixel in the scene, and then normalizae then with the hydroperiod
(Hydroperiod / Valid Days ) * 365 = Normalized Hydroperiod
Still some issues (Fmask is very good but not perfect), but quite less
We want to distinguish between:
1. Permanent fresh water (also artificial ones)
2. Temporary fresh water
3. Temporary brackish water
4. Permanent brackish water connected to the sea
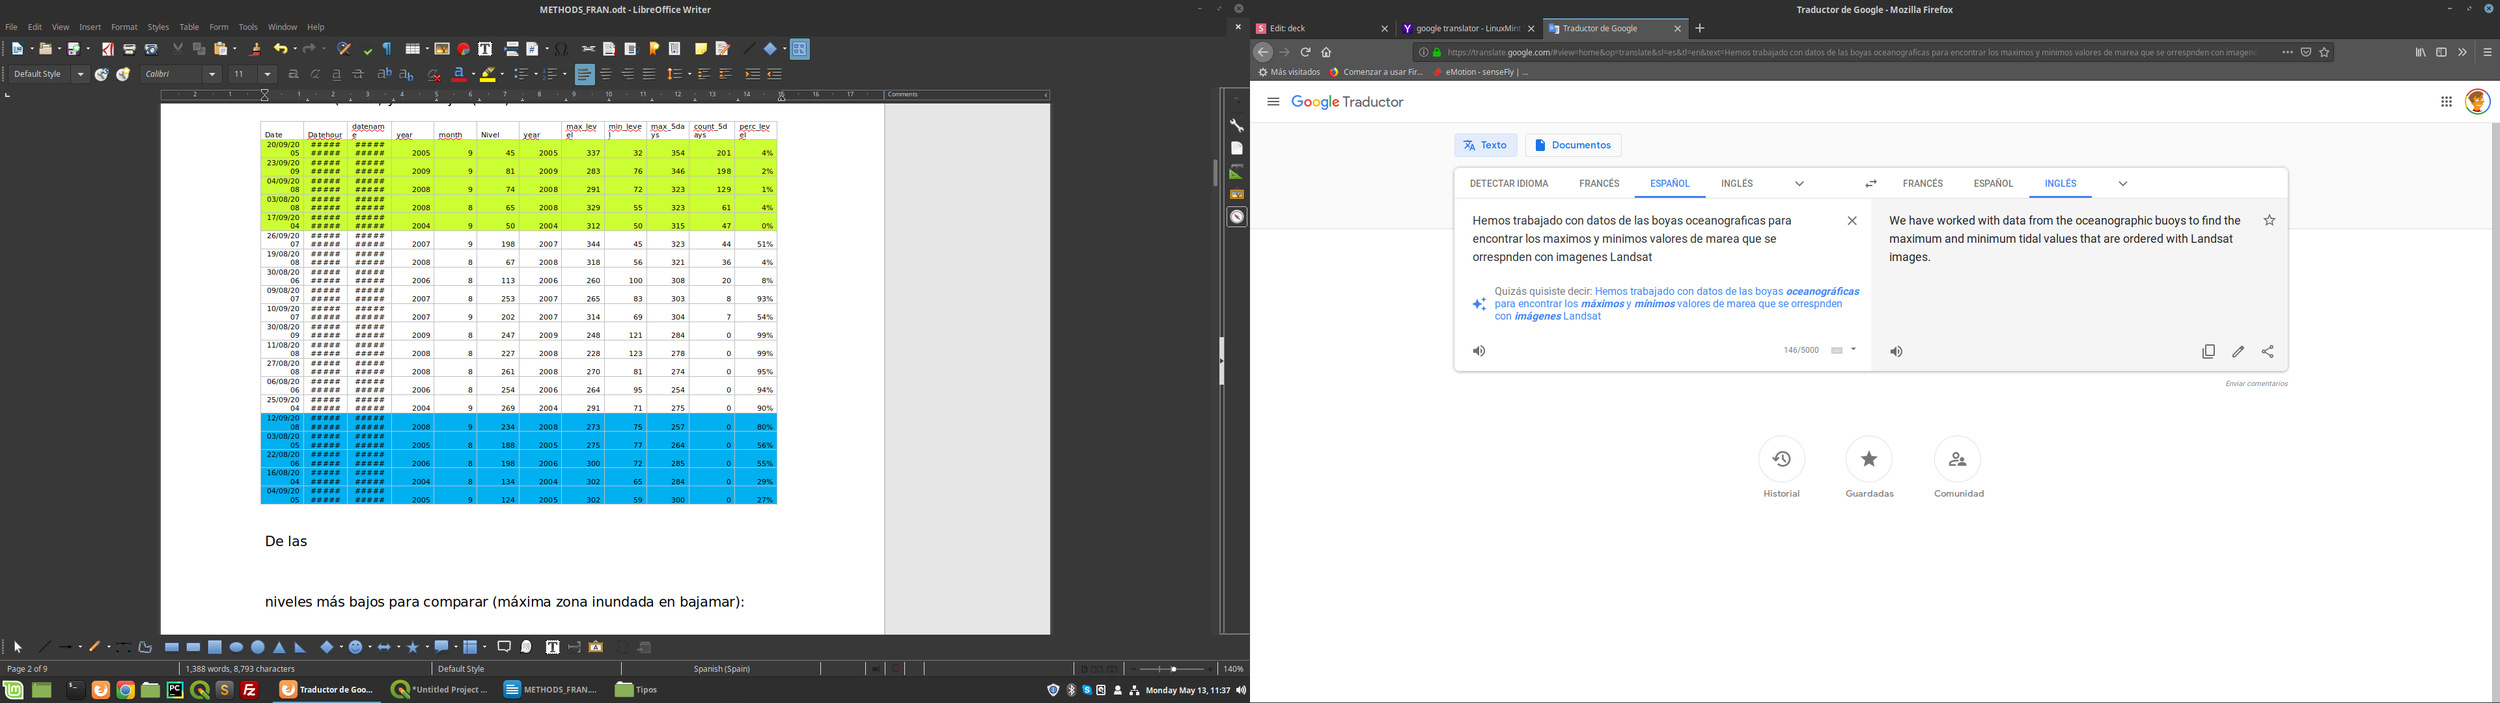
We have worked with data from the oceanographic buoys to find the maximum and minimum tidal values that are related with Landsat images. We focus in the summer to avoid water from rain or flood inundation.
Landsat Images
Max and Min level during the day and during the last 5 days
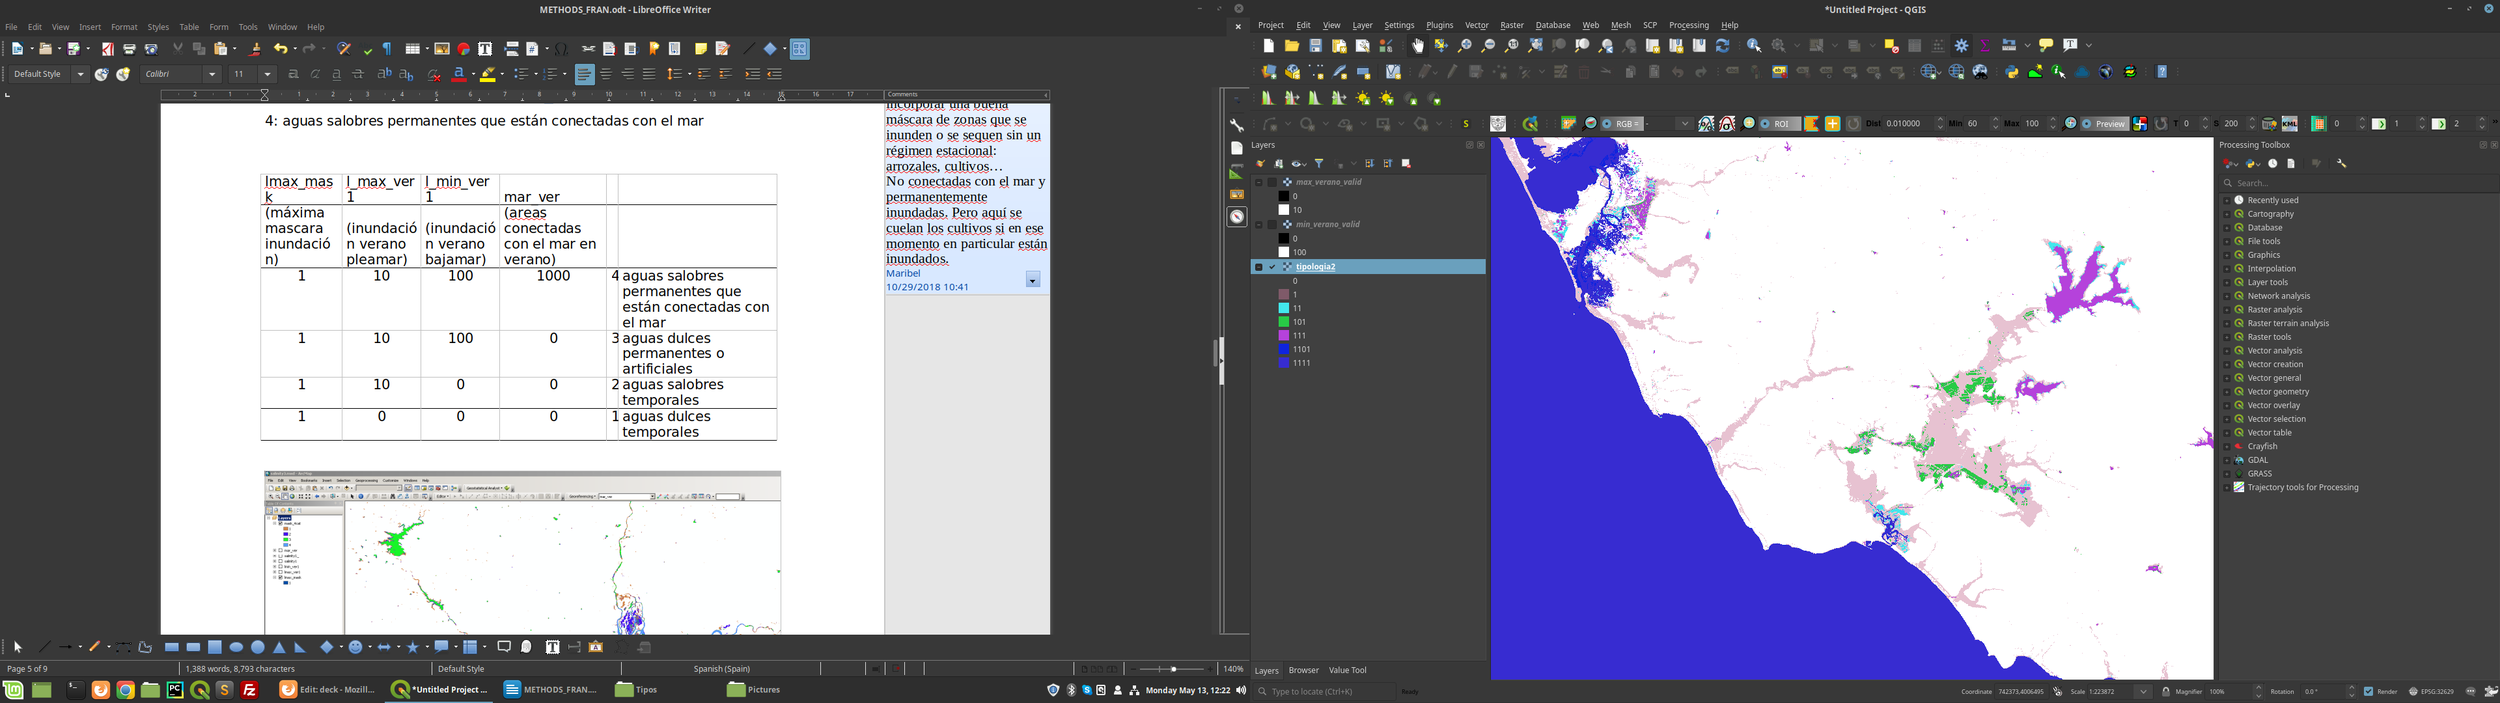
We have use the Max Flood Mask and also have calculated the connected to the sea areas, and we have use them along with the the maximun and minimun tides mask. At the end of this process we have 4 possible classes:
Low tide Summer Flood
High tide Summer Flood
Max Flood Mask
Areas connected to the sea
Flood type
X
X
X
permanent brackish sea connected
X
X
X
X
permanent fresh (artificial or not)
X
X
temporaryt brackish
X
temporaryt fresh
In order to know how connected is a water body with others, we have calculate the number and the surface of water bodies in a radius of 50 km for each one.
By Diego García Díaz


