PRS: Practicing Research Skills
Computational Approaches
in Political and Social
Sciences

Week 3A: Data Analysis / Skills tutorial on network analysis. Mon 17 June
Diliara Valeeva and Eelke Heemskerk
Plan for Week 3
Mon 17 June: Advanced Gephi Tutorial
+ How to write 'Data Analysis'
Wed 19 June: Group meetups
Fri 21 June: Group meetups
=> Submitting 'Data Analysis' assignment
Plan for today
1. Reflections
2. Skills tutorial on network analysis - 2
3. How to write 'Data Analysis'
1. Reflections

2. Skills tutorial on
network analysis - 2
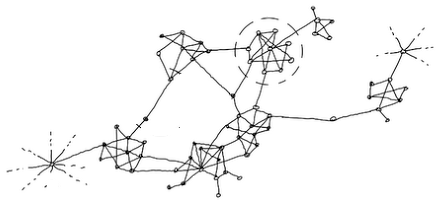
Data on
co-authorship (2015)
Canvas => Modules => Week 3 => 2015_coauthorship.gexf
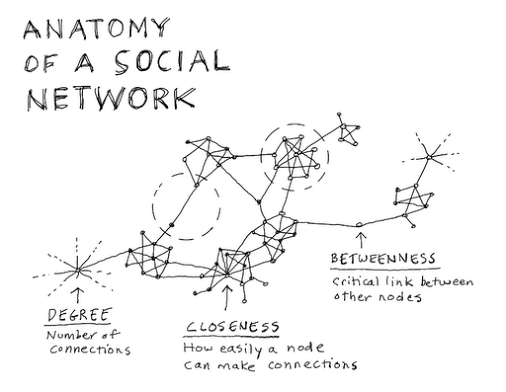
2 main types of measures
Network-related
Node-related
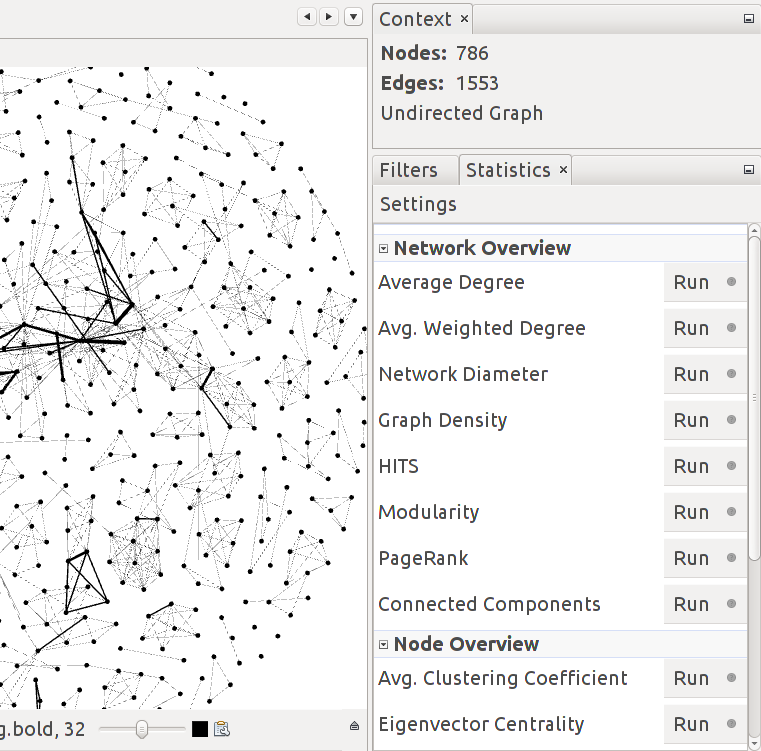
1. Network Measures
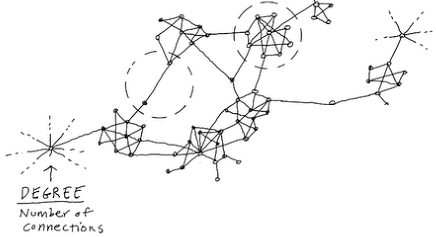
Average Degree
- Degree is the number of ties a node has to other nodes
- High degree: nodes have a large number of ties with others in a network
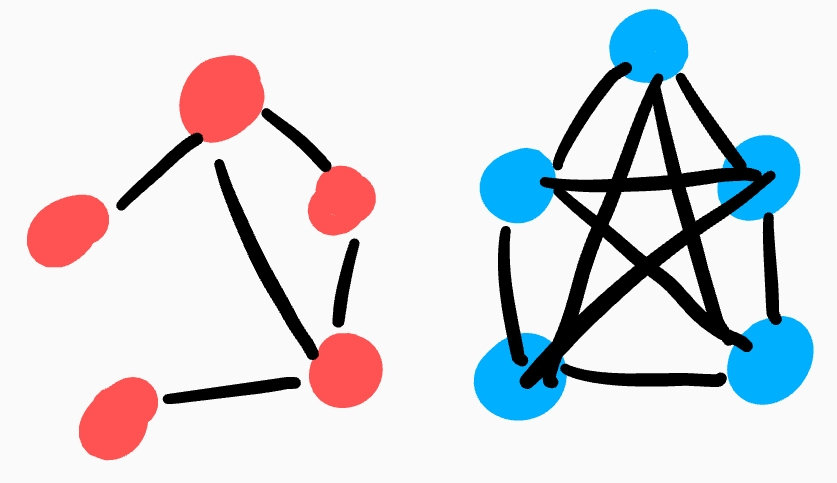
Graph Density
- Density indicates how densely nodes are connected in a network
- = Number of actual ties / Number of potential ties
- High density: everyone knows each other in a network
Network Diameter
- Diameter shows how far apart are the most distant nodes from each other
- High diameter: nodes are far away, it can take time and effort to reach each other
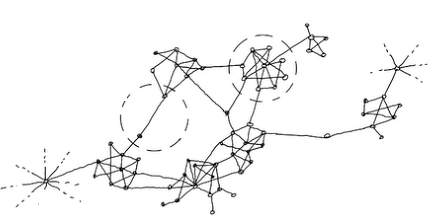
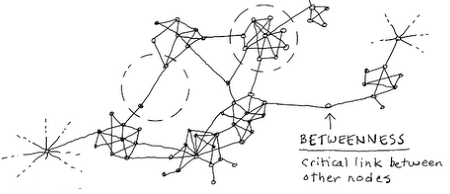
Betweenness Centrality
- Betwenness show whether a node obtains "a bridge" positions between others
- High betweenness: node has access to diverse information and resources, connects non-connected groups
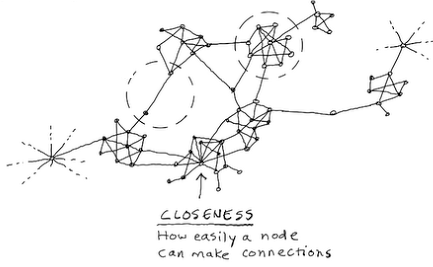
Closeness Centrality
- Closeness shows how close is the node to all others
- High closeness: a node can reach others in a network very easily
Modularity
- Shows the network communities
- Nodes are in one community if they are densely connected with each other
- High modularity: dense intra-community, sparse inter-community ties
- Higher is better

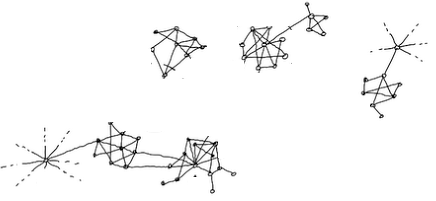
Connected components
- Nodes are in one component if they are connected only with each other
- A large number of components: network is highly disconnected
2. Node Measures
Clustering coefficient
- It is a measure of how complete the neighborhood of a node is
- The friend of my friend is also my friend" effect
- High clustering: everyone knows each other
Eigenvector Centrality
- Shows how a node is connected with other influential nodes
- High eigenvector: the node has a large number of ties and its neighbors also have a large number of ties
Where to find all the results?
- Gephi returns reports
- Network-related measures are also saved in 'Data Laboratory' tab.
- Export results using "Export Table" and explore in Excel
3. Data Analysis
Data Analysis
1. Introduction
2. Description and interpretation of the results
3. Conclusions
* max 2000 words
Deadline: Friday 21 June, 19.00
1. Introduction
- Research question(s) and hypothesis(es): A brief reminder
- Reformulate if they have changed
- Data and methods: Which dataset(s) and method(s) you used?
2. Results
- What are your main findings?
- How would you explain these findings? What do they mean? Did you obtain what you expect or not?
* Think about the research question
* Return to the literature review if needed
3. Conclusions
- A summary of the main findings
- Did you answer your research question or not? Did you confirm your hypothesis(es) or not?
- What would you recommend for future studies? What can be explored more? What would you like to study more on this topic if you would have more time / better datasets?
Group meetups
Wednesday 19 June
Success offline : 9.00 - 9.20
Success online : 9.20 - 9.40
Past and Present: 9.40 - 10.00
Neighbors: 10.10 - 10.30
Key players : 10.30 - 10.50
PRS / Week 3A: Data analysis / Skills tutorial on network analysis
By Diliara Valeeva
PRS / Week 3A: Data analysis / Skills tutorial on network analysis
PRS Practicing Research Skills. Week 3A: Sills tutorial on network analysis in Gephi (advanced) and Data Analysis. 17 June, Wednesday.


