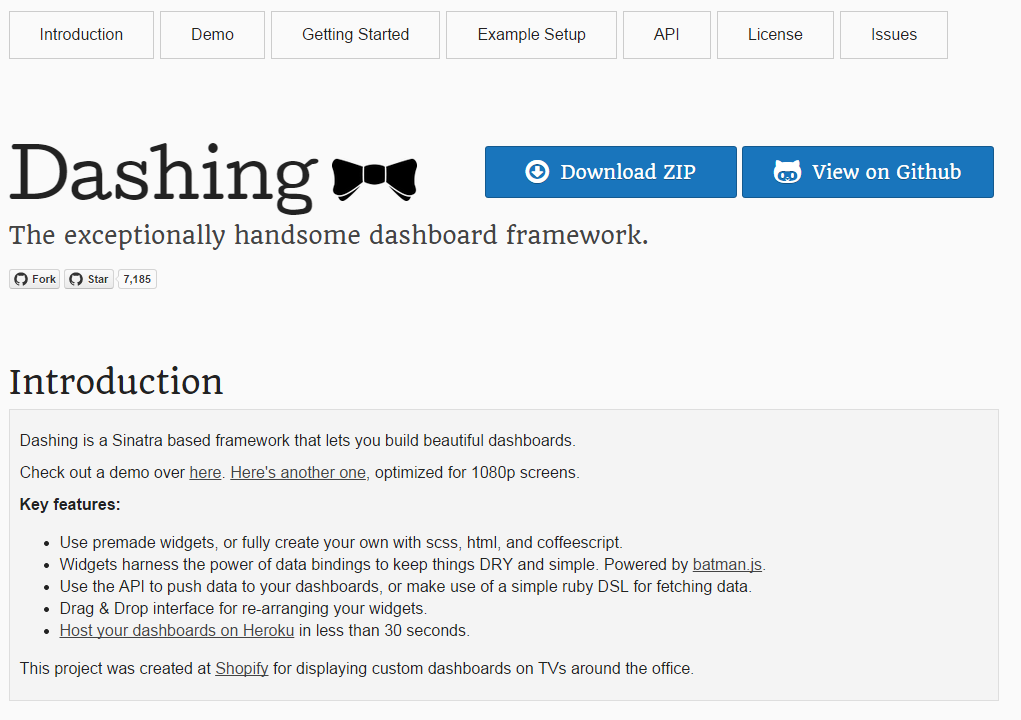
Dashing
Operations Development
The Ops Development Team has been providing services and software to Microgaming clients, third parties and Derivco offices, both local and international since, 2011. These services include solution development in automation (both IT and Test), workflow, administration and processing systems.
The Problem
Provide a unified monitoring layer for display of events and metrics

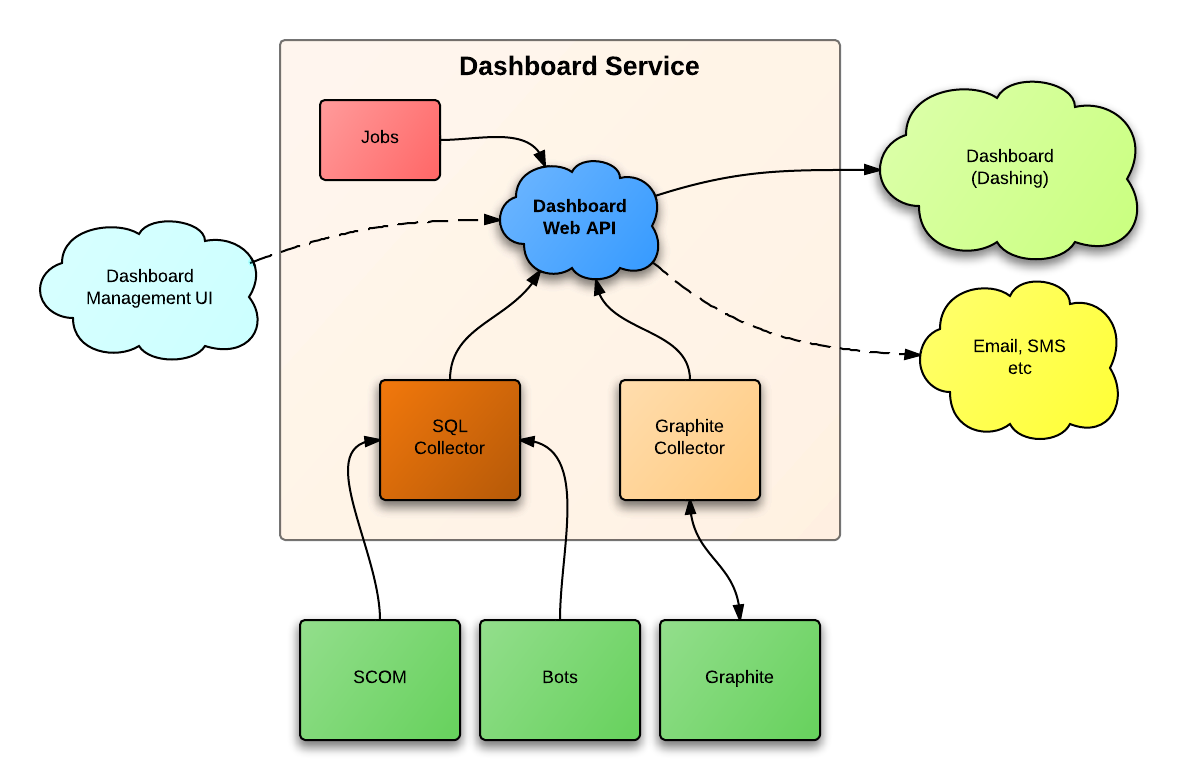
Dashing (Github)
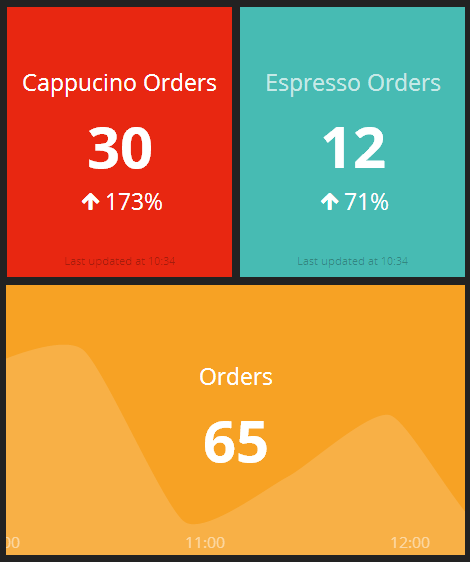
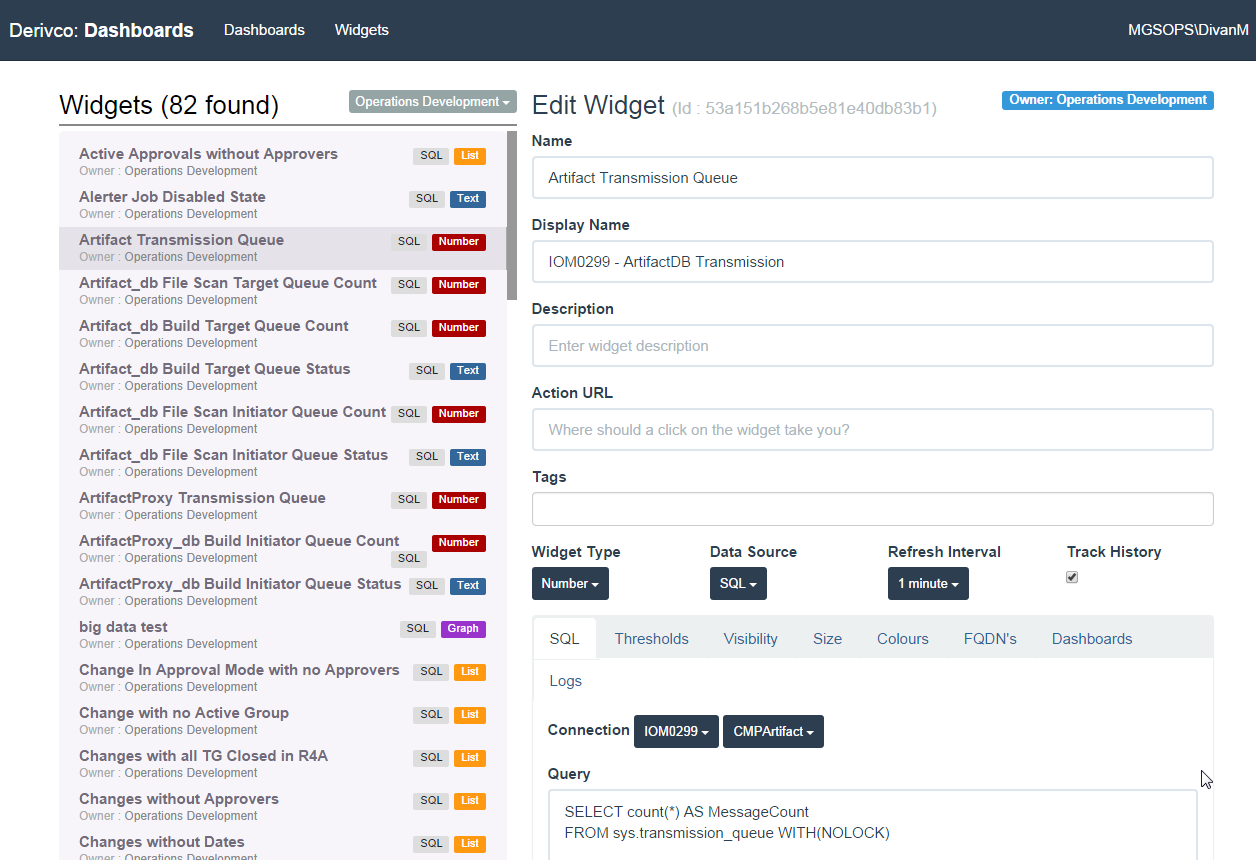
Widgets
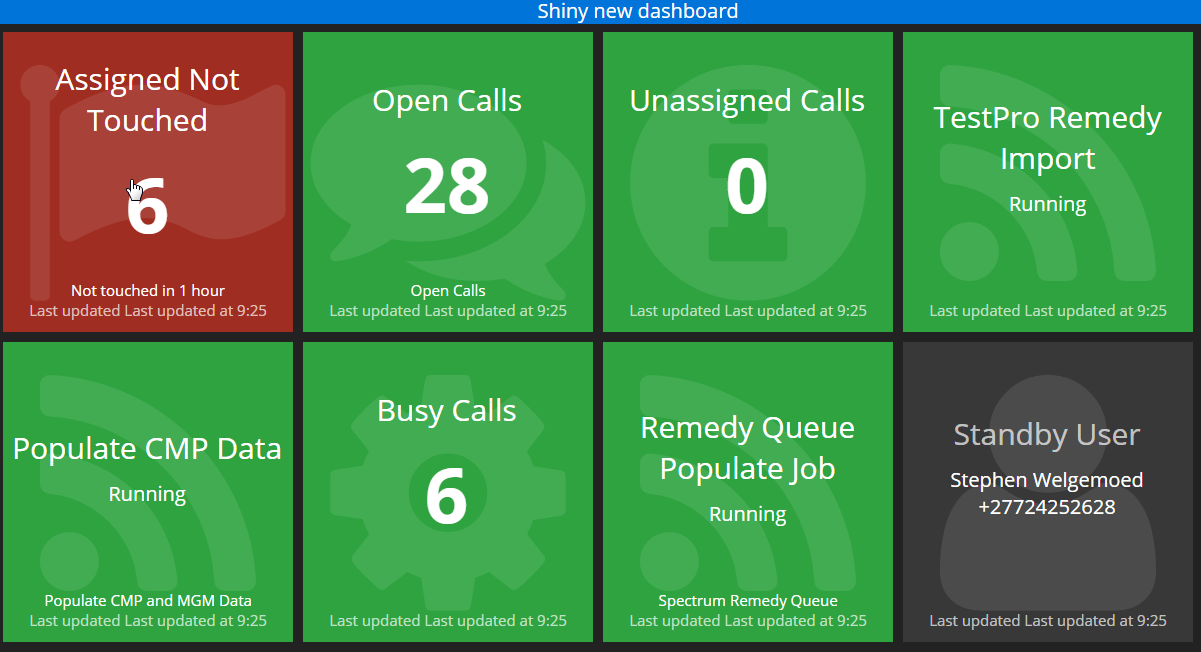
Dashboard
Monitoring Sources
- Graphite
- SQL
- Custom HTTP Post (Powershell, Curl)
Overview
http://dashman
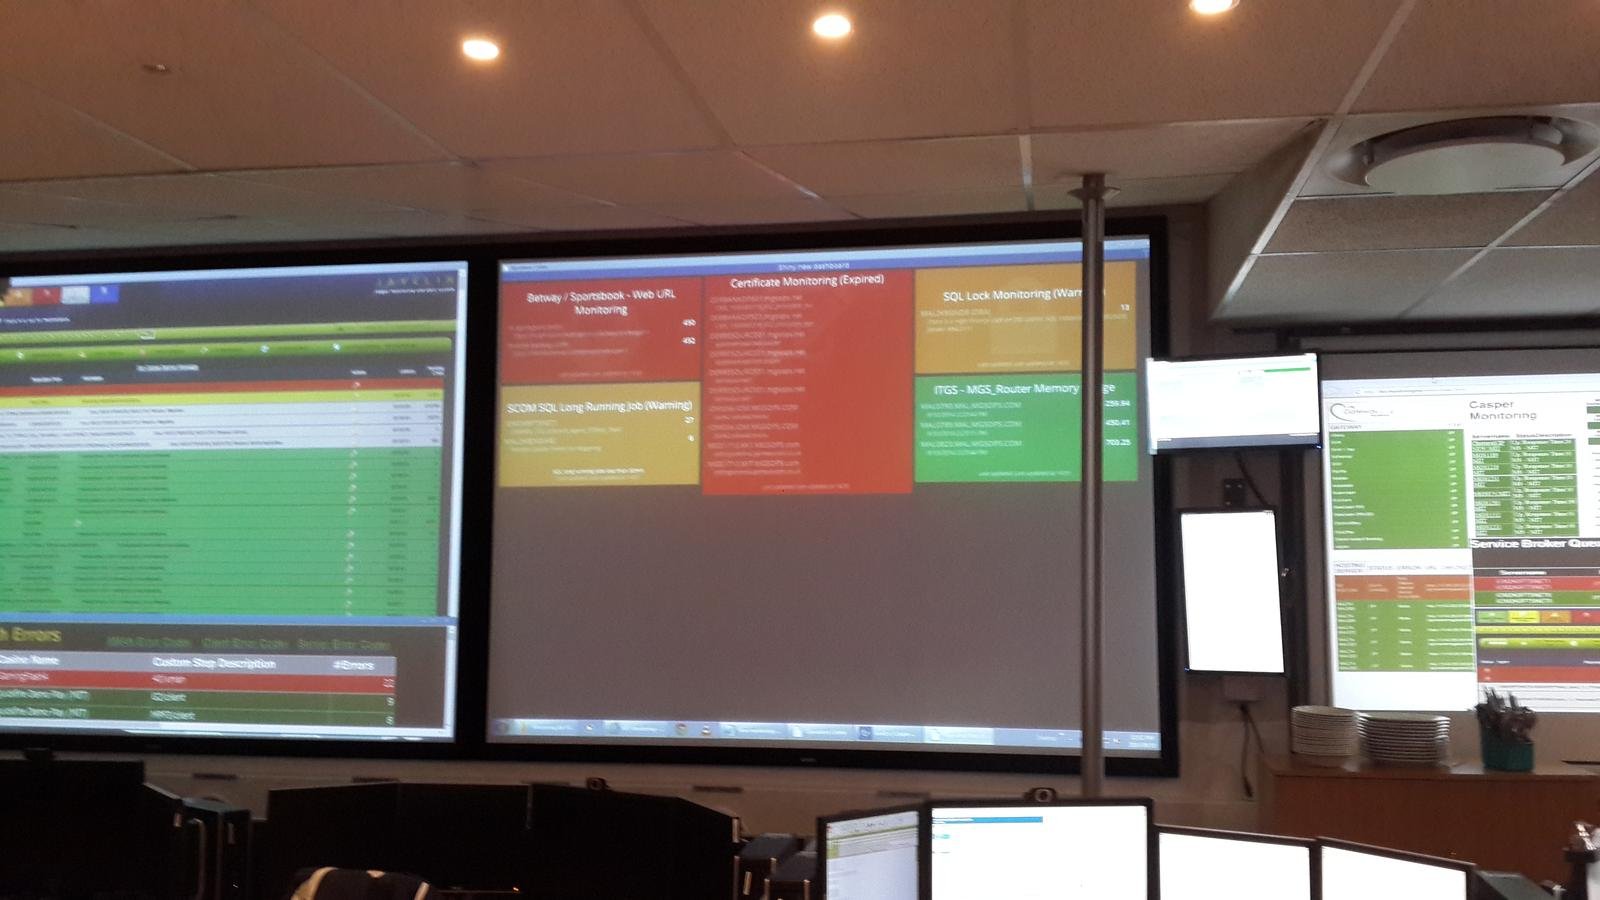
IT Operations Centre
IT Operations Centre
- AAMS VPN
- Banking Websites
- Certificate Monitoring (Critical)
- Certificate Monitoring (Warnings)
- Login Queues
- Login Services
- Website Status
- SCOM SQL Job Failure (Critical)
- SQL Lock Monitoring (Warning)
- SQL Lock Monitoring (Critical)
- SCOM SQL Job Failure (Warning)
- SCOM Heartbeat Failure
- Severities Not Set (Warning)
- Severities Not Set (Critical)
IT Operations Centre contd.
- Betway / Sportsbook - SQL Job Failure Alerts
- Betway / Sportsbook - SQL Lock Alerts
- Betway - Sportsbook - Web URL Monitoring
- Betway / Sportsbook - All SCOM Alerts
- ITSA - % CPU Usage
- ITSA - % Disk Space (C:)
- ITGS - MGS_Router Memory Usage
- BusAppDBA - Javelin Errors (Down)
- BusAppDBA - Javelin Errors (Failed)
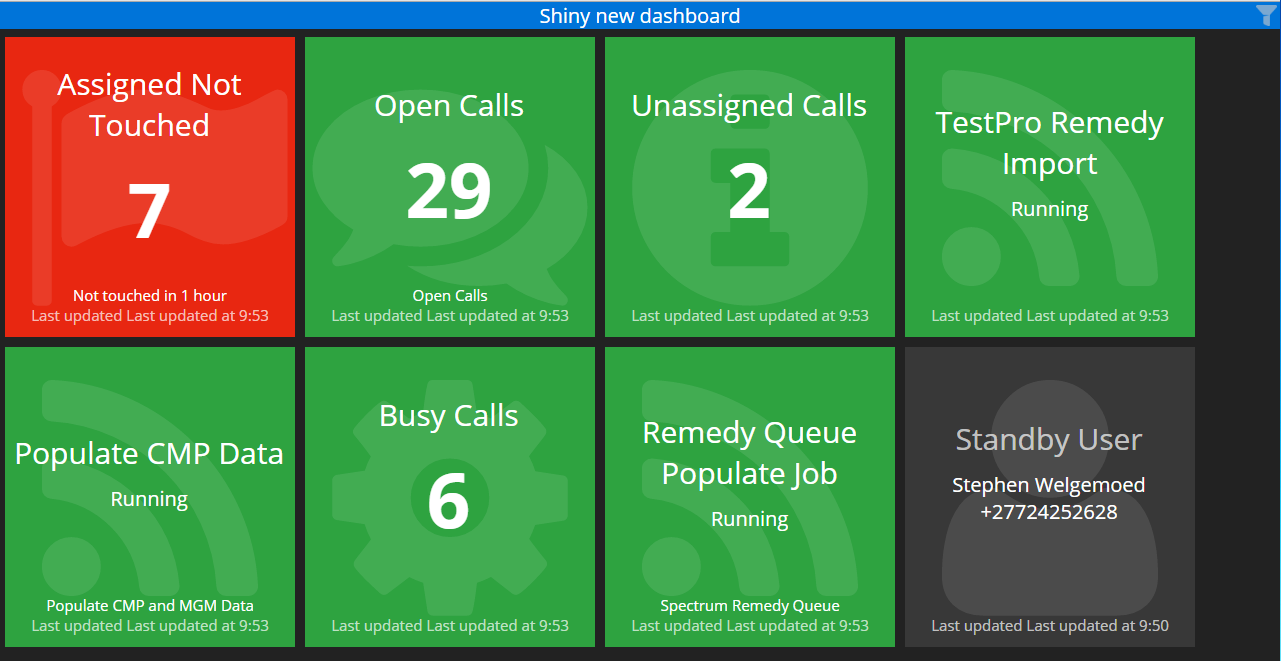
IOM
Dashing has changed the way we monitor and react to our systems. In the past few months we have achieved the following with minimal effort
- Riki Grosvenor
Subtitle
- implemented a file level monitoring on all our Veyron Gaming servers to ensure that all servers in all farms have the same version of files live
- implemented alerting off our Remedy database in order to immediately notify us when a new call or task has arrived for us to work on
- implemented service level performance counters to monitor the health of a new router service during our beta process
- implemented service status checks to raise alerts immediately to us when a specific service on a specific server is no longer running
- There is greater visibility to the greater team. Everyone who is passionate about ensuring our systems run effectivly now immediately reacts when an alert triggers.
- The immediacy of feedback. Traditionally alerts are triggered, sent to the service desk, and then gets filtered to the appropraite team. This has lead to issues being picked up before our operators do
- I see a definite future for the product within our space. All we need now is integration into other alerting mechanisms (mail, whats app groups), and a library (or a better repository management system) of existing widgets & then we are set!
In a nutshell it has been a fantastic tool for us, and pretty much provides our only actual monitoring into our live world (outside of SCCM and . We have the F5 monitoring up on a dashboard, as well as some useful stuff coming through from Statsd.
The usability, slickness, and willingness from the developers to improve and grow the product have been the most pleasing aspects.
- Jason Barber
IOM
Server Core
Provides an easy to use gateway into key performance metrics that would otherwise be difficult to display on a simple dashboard.
- Mark Rudling
Usage
- > 800 widgets
- > 200 dashboards
- Deployed at all our hosting locations
Issues we faced
- Multi-Site
- Spawn
- Load
- Abuse
Roadmap
Brown Bag- Widget Approval
- Time Machine
- Alerts
- Custom Layouts
- Grafana Support
deck
By divan