monitoriNG
Feedback Session
Church of Graphs
Measure Anything, Measure Everything
If it moves, we track it.
If something isn't moving yet, track it, just in case it decides to make a run for it.
In general, we tend to measure at three levels:
-
network
-
machine
-
application
WHAT IS AVAILABLE already?
- StatsD
- Graphite
- SCOM
statsd
-
A network daemon that runs on the Node.js platform
- Listens for statistics, like counters and timers, sent over UDP
-
Sends aggregates to one or more pluggable backend services (e.g., Graphite).
statsd concepts
- buckets: Each stat is in its own "bucket". They are not predefined anywhere. Buckets can be named anything that will translate to Graphite (periods make folders, etc)
- values: Each stat will have a value. How it is interpreted depends on modifiers. In general values should be integer.
-
flush: After the flush interval timeout (defined by config.flushInterval, default 10 seconds), stats are aggregated and sent to an upstream backend service.
graphing flexibility
A graphing tool should be flexible enough for the user to decide what metrics are important to their environment, and it should be able to accept metric data from any source.
graphite
Graphite is simple, you send a metric name, a value, and the current Unix time-stamp.
To track time-based events, the value sent for the metric can simply be "1".
With Graphite, you get:
-
Beautiful, near real-time graphs of metrics.
-
A simply awesome API to embed graphs and source data in nearly any other system.
Combined with StatsD:
-
Fire-and-forget (UDP-based) metric data emission and aggregation.
-
Metrics that make sense.
-
Brain dead simple API that works in any language
RENDER URL API
The graphite web-app provides a render endpoint for generating graphs and retrieving raw data. This endpoint accepts various arguments via query string parameters.
graphite
Show off your graphs.
Because Graphite has a fantastic API, all you need to do in order to show the number of failed logins in your admin interface is include a URL to Graphite’s render API in an <img> tag in your Admin interface.
<img src="http://graphite.mycompany.com/render?target=stats.counts.login.success&from=-6hours&format=png">

API RE-USE
StatsD API
-
statsd.timer
-
statsd.counter
-
statsd.gauge
statsd.raw
If a service has already summarized its own data for e.g. inspection purposes, use this summarised data to send to a statsd that has the raw patch, and this data will be sent to graphite pretty much unchanged.
straight to graphite?
Backstop
Backstop is a simple endpoint for submitting metrics to Graphite.
It accepts JSON data via HTTP POST and proxies the data to one or more Carbon/Graphite listeners.
bypass
For very frequent stats you can bypass statsd and instead aggregate counters at their point of origin to send directly to Carbon, which is Graphite's back-end.
This cuts down on UDP messages and CPU usage considerably when sending tens of thousands of messages per second from one process through statsd
LOGSTER
Logster is a utility for reading log files and generating metrics in Graphite.
It is ideal for visualizing trends of events that are occurring in your application/system/error logs.
For example: Graph the number of occurrences of a HTTP response code that appears in your web
server logs.
graphite tools
dashboard
-
Zabbix
-
Nagios
-
Custom Built
zabbix
-
Relatively quick & simple install on a variety of platforms
-
Agent-based, but available agentless options.
-
A fairly vibrant community
-
A large amount of templates covering most popular software
-
Integrated graphs
-
Escalation management

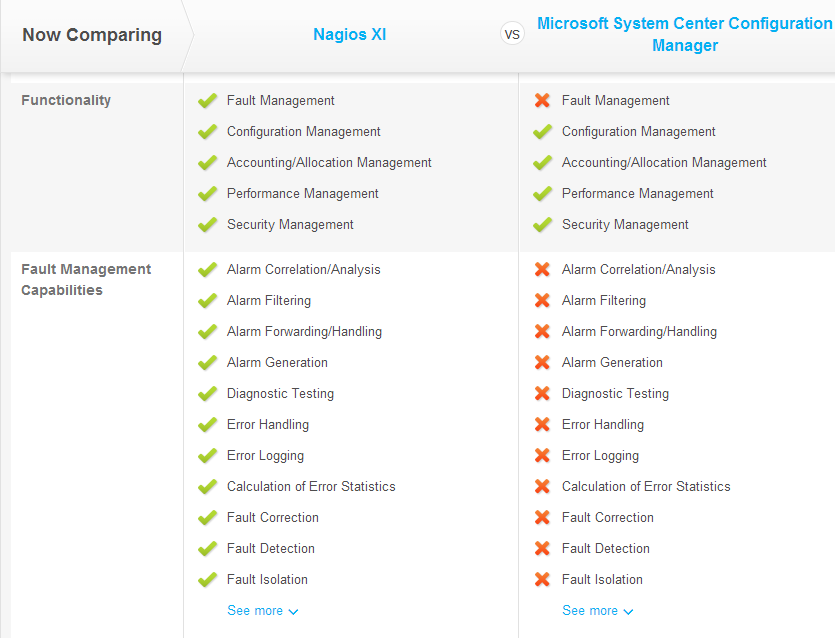
Often considered the de-facto standard for monitoring
Nagios is like an old Volvo – it might not be the prettiest or the fastest, but it’s easy to work on and it won’t leave you stranded.
NAGIOS
SCOM Community Connector
OpsMgr Framework - Feed OpsMgr alerts into Nagios
check_graphite: Nagios plugin to poll Graphite
Check_MK is a Nagios plugin that automatically inventories hosts, gathers performance data and provides a nicer UI
examples of complexity in dashboards
Flap detection
Sometimes stuff happens and a server will sit on the edge of an alert threshold. Nagios has fairly intelligent flap detection built into it which will temporarily mute notifications so that it won’t keep triggering every time it crosses the threshold and back.
Zabbix has a form of Flap detection called hysteresis, but it’s not automatic, and you have to play juggling games with the triggers to implement it.
remedy integration
Mailer API
-or-
Use the Webservice
scom
Selectively choose monitors from SCOM and query them programatically. Represent those in Zabbix/Nagios and if there's a problem continue to use SCOM to examine the issue.
But replicating the full dataset from either platform in the other would likely be a bad experience?
monitoring
By divan