Debugging with Chrome DevTools
О себе
- Senior software engineer
- Пишу на javascript больше 5 лет
- В EPAM 1,5 года
github: alexeyMohnatkin
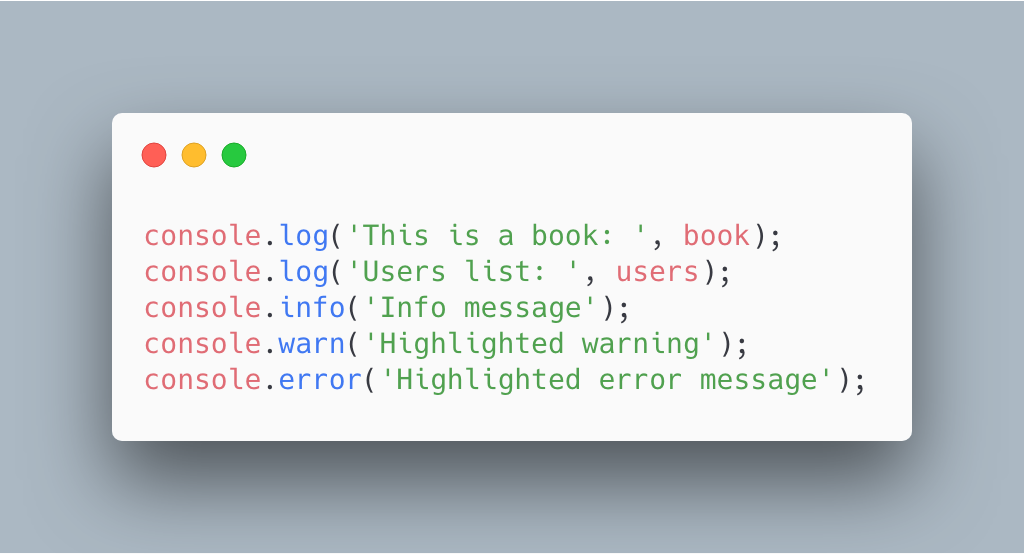
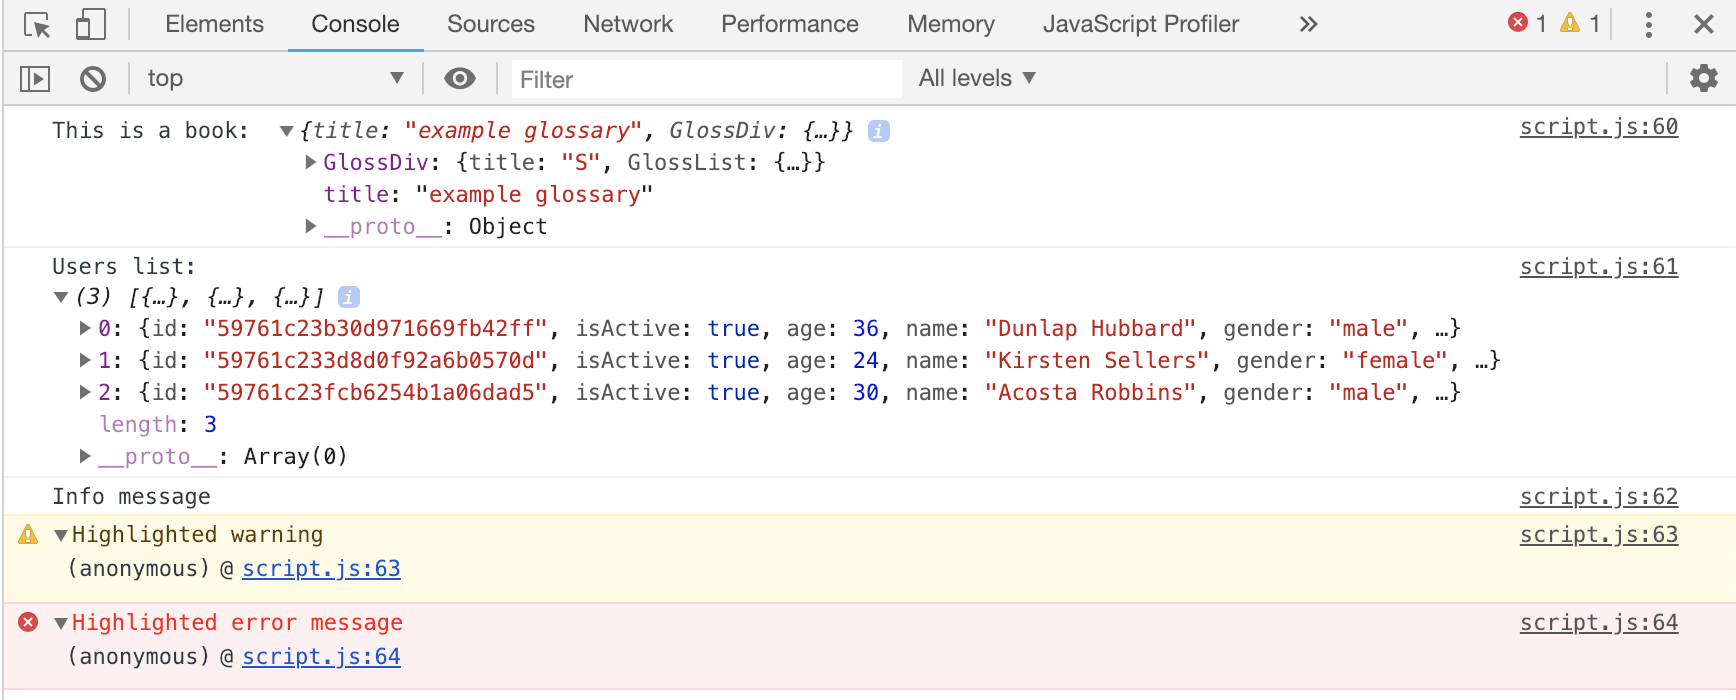
Console API
-
console.log
-
console.info
-
console.warn
-
console.error
-
console.table
-
console.group
-
console.groupCollapsed
-
console.time
-
console.trace
-
console.assert
-
console.count
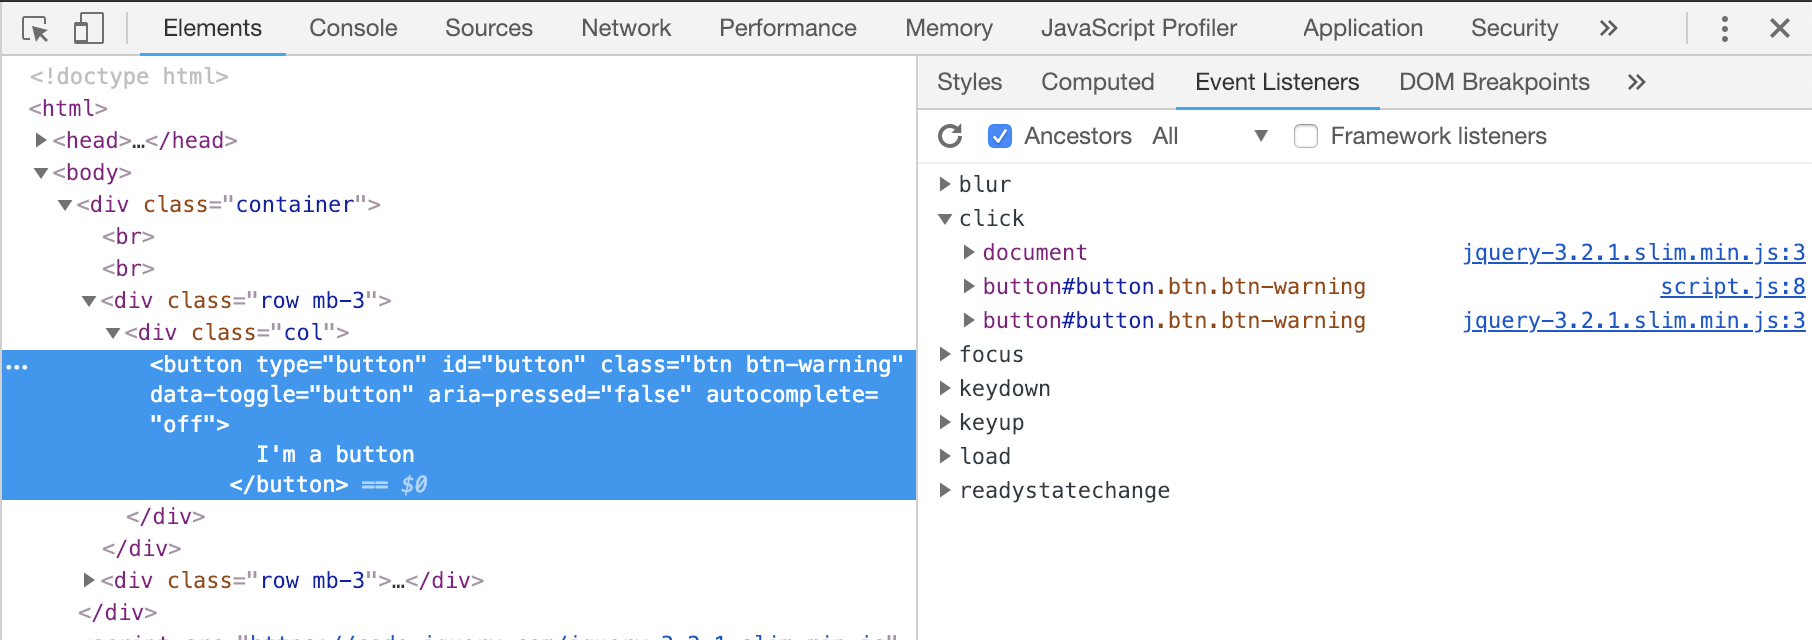
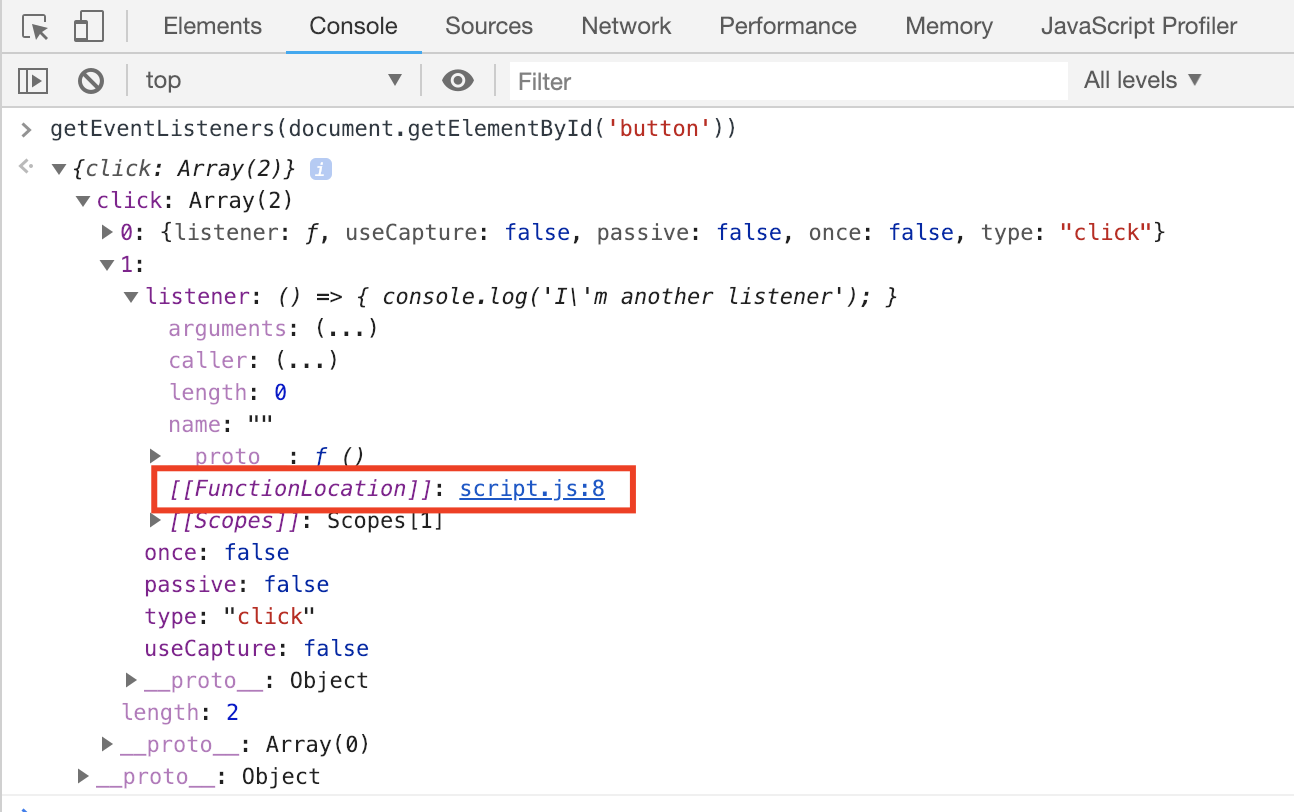
Event listeners
Event listeners
Event listeners
Event listeners
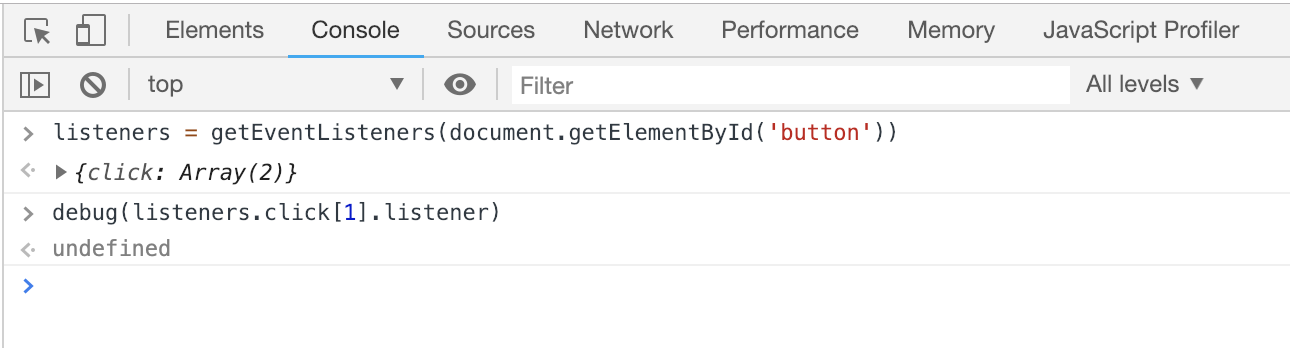
Command line API:
- getEventListeners
- debug
Можно посмотреть, кто подписан на события
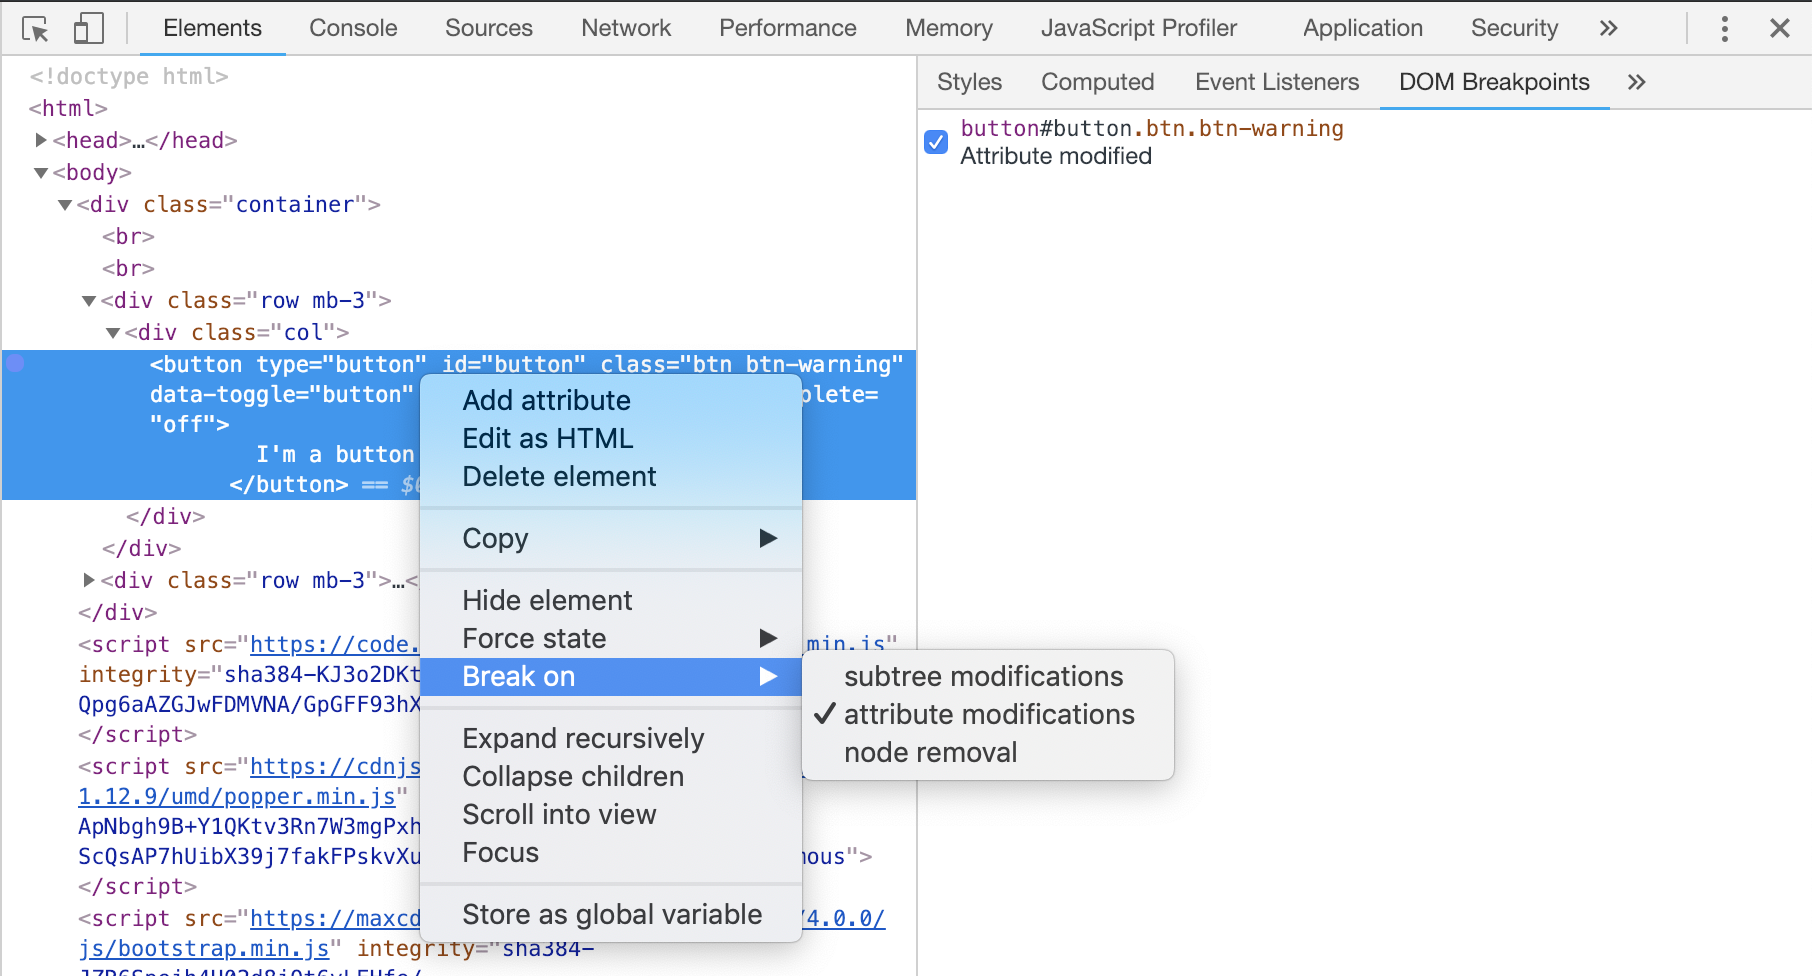
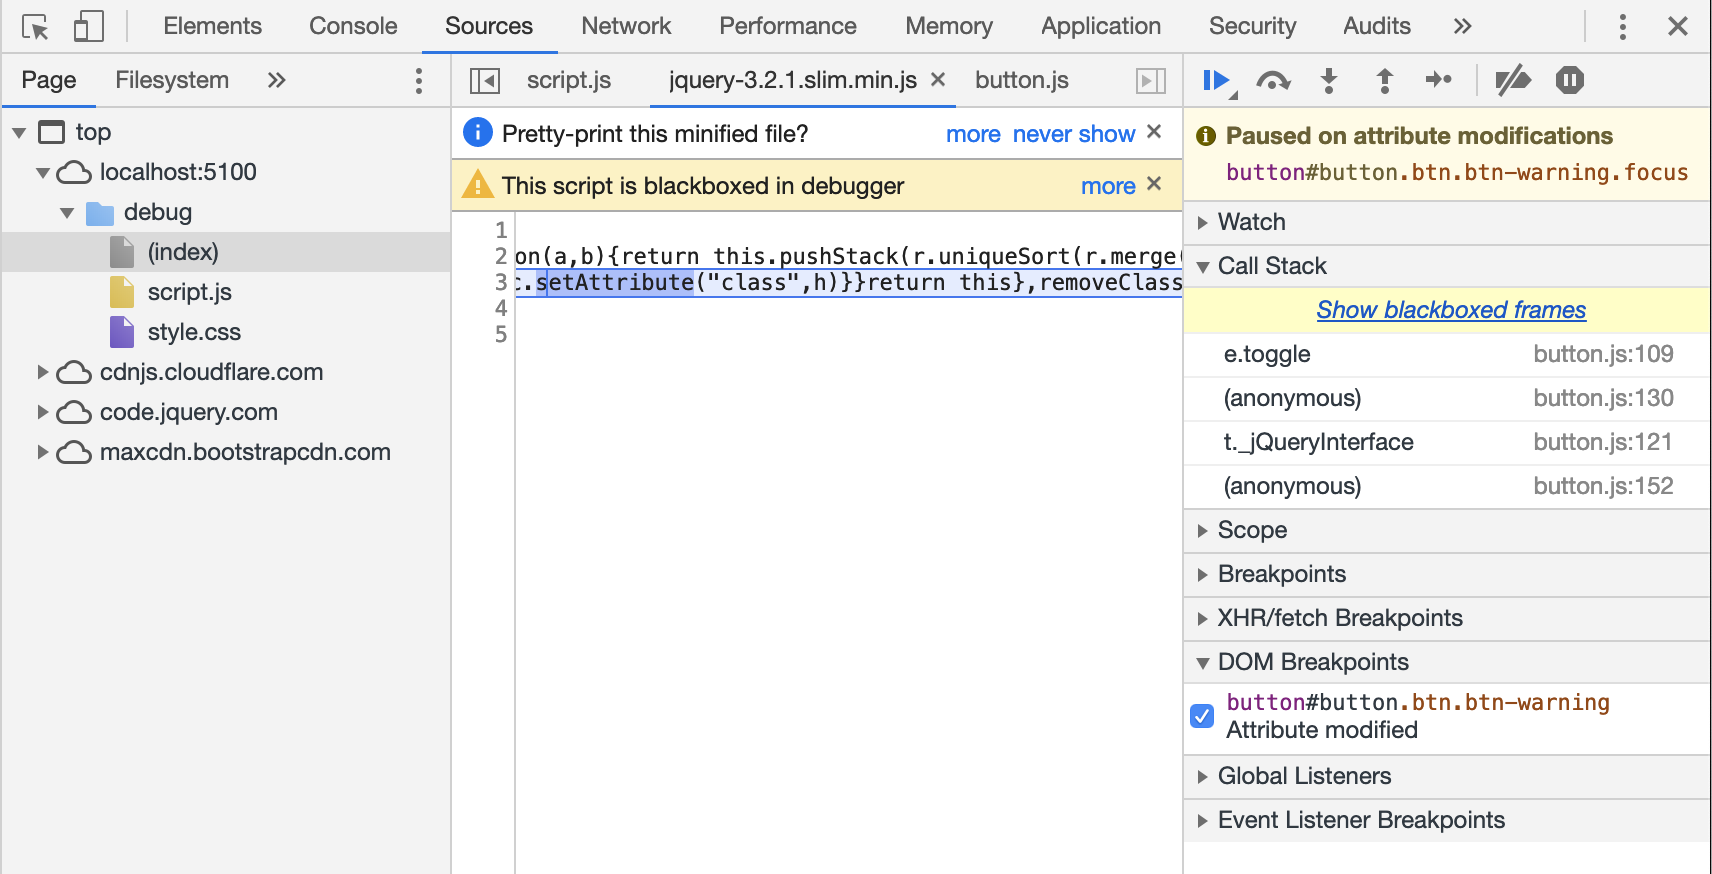
DOM Breakpoints
DOM Breakpoints
Pause script execution
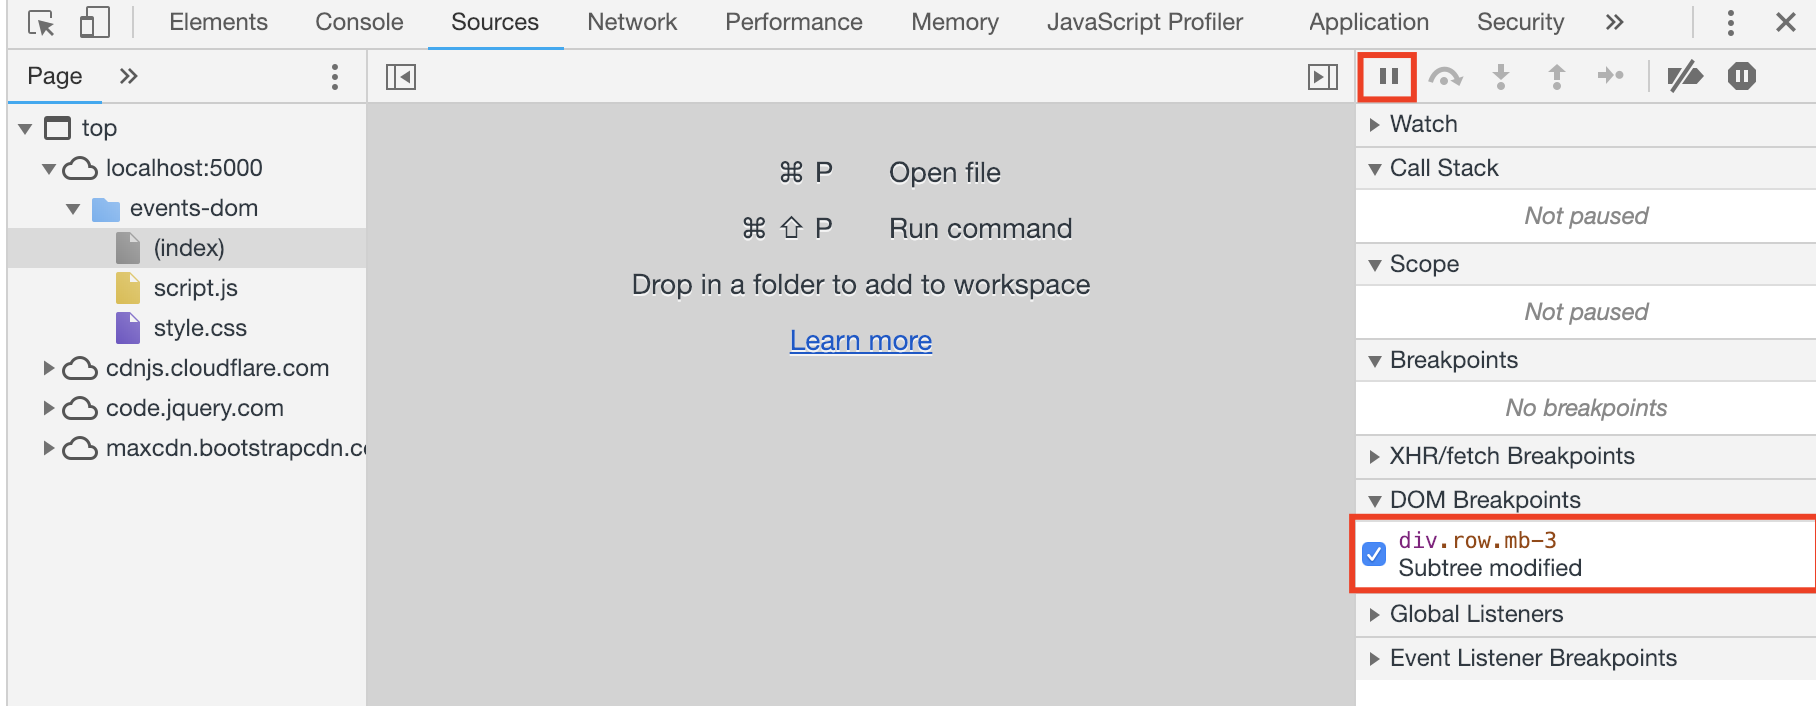
DOM Breakpoints
- Subtree modification
- Attribute modification
- Node removal
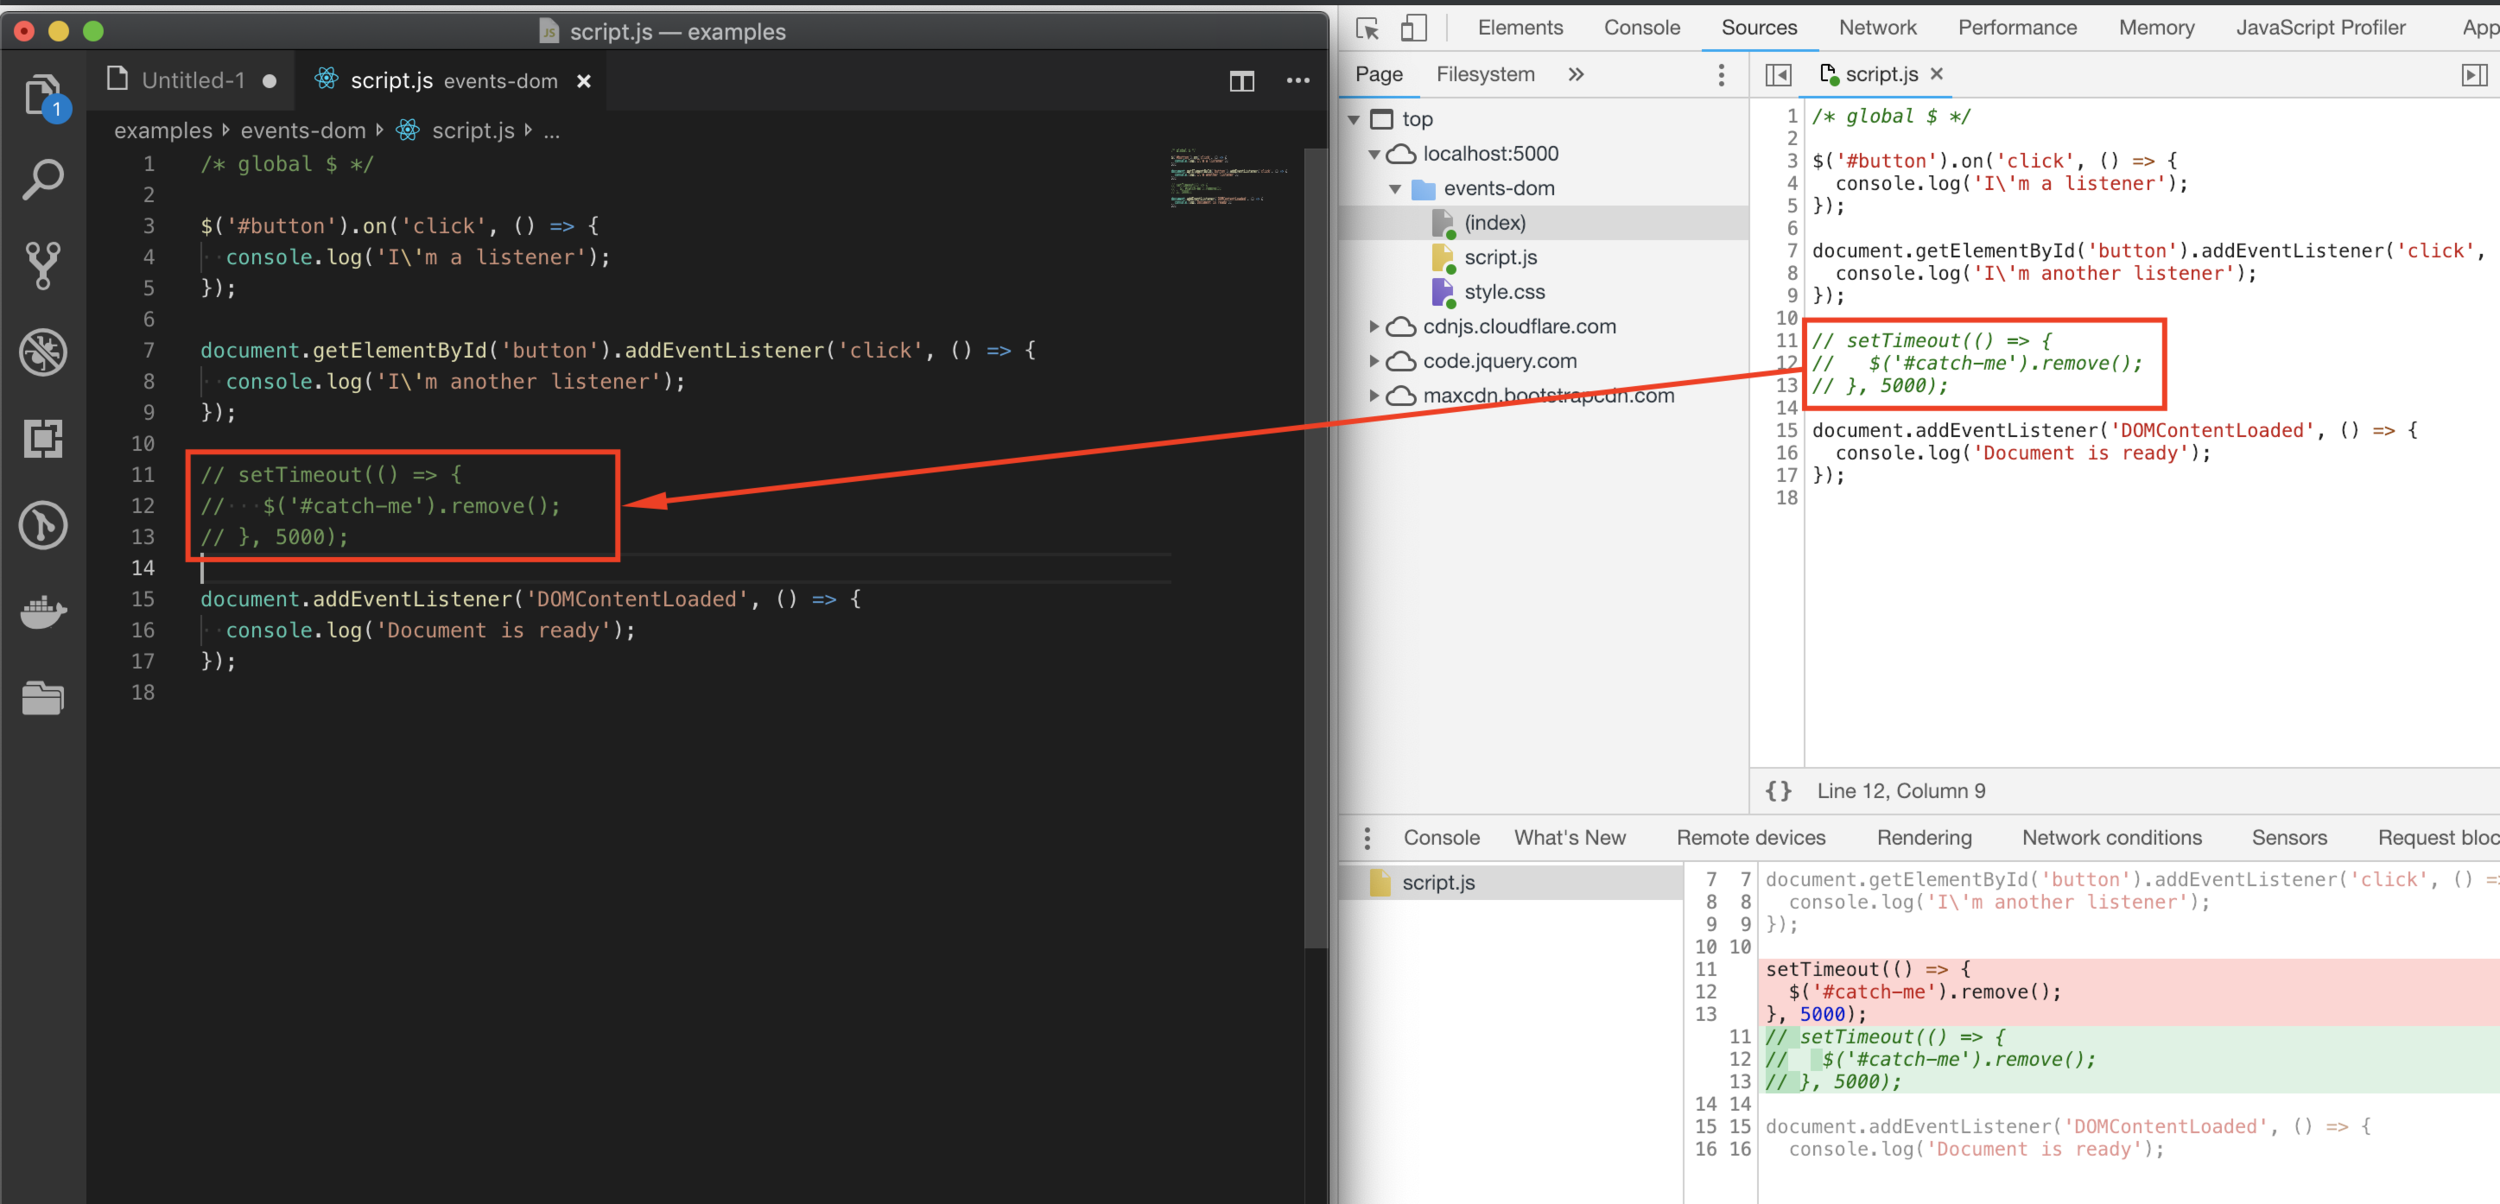
Local overrides
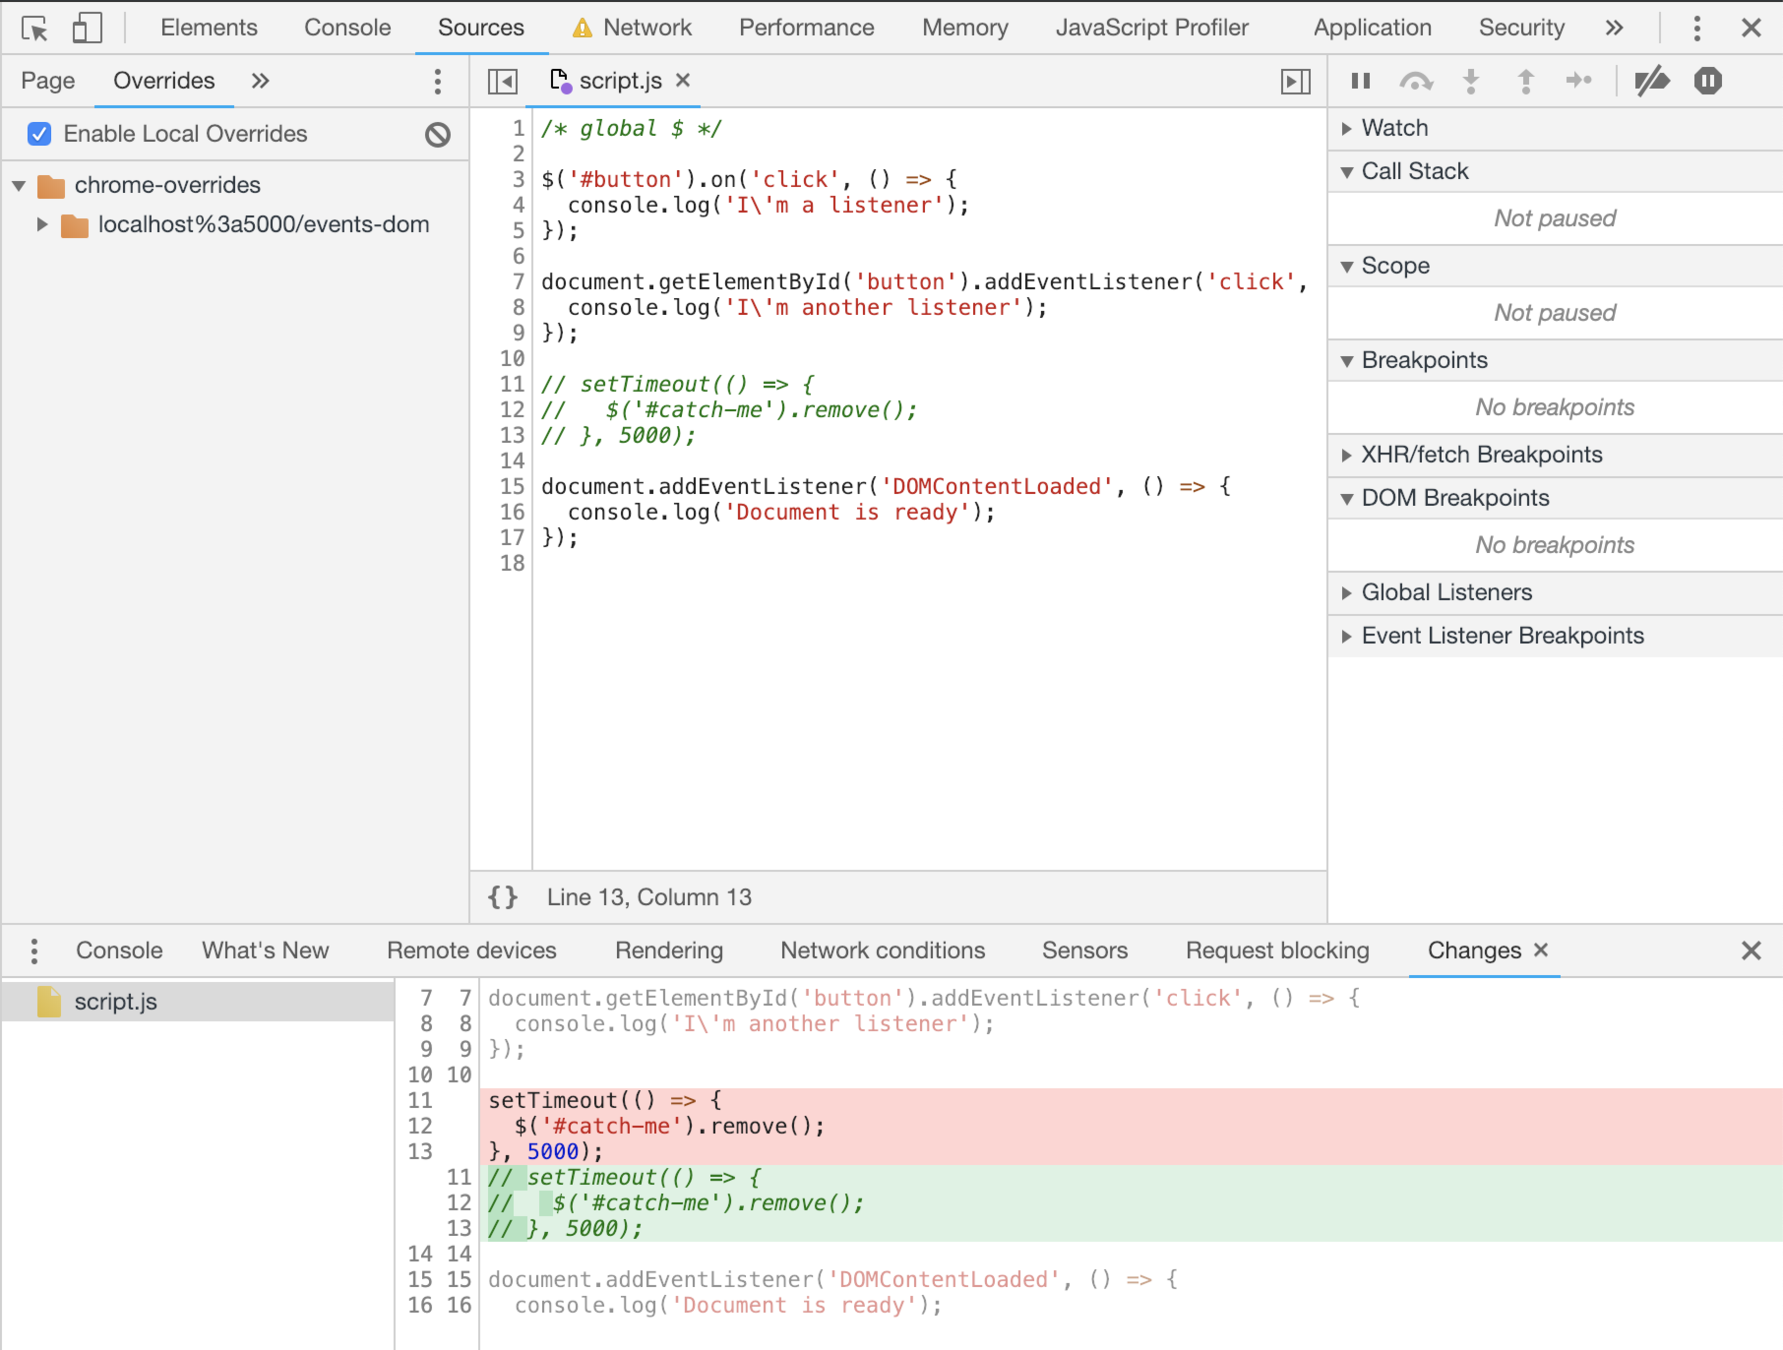
Filesystem
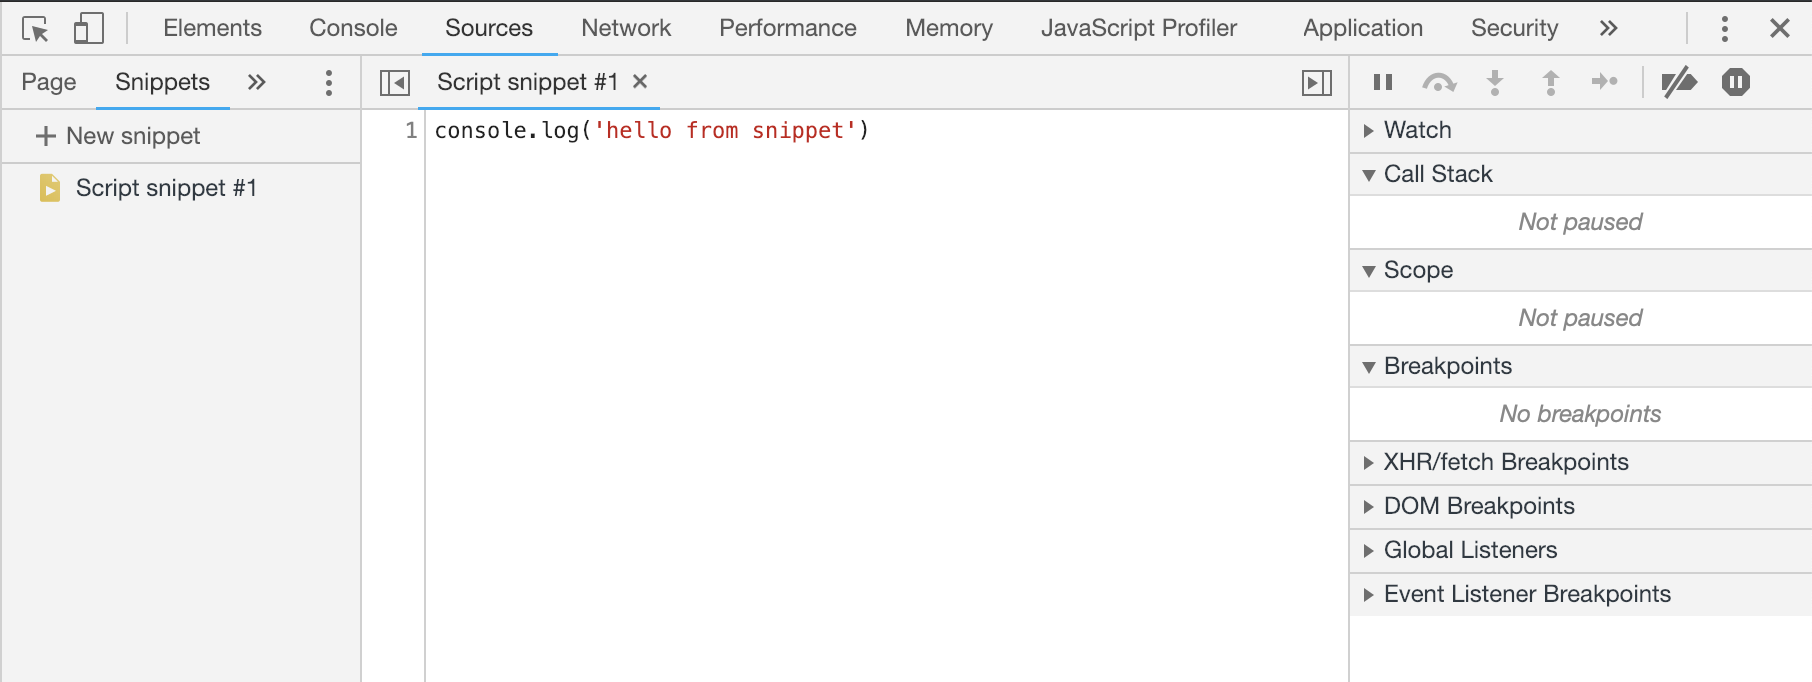
Snippets
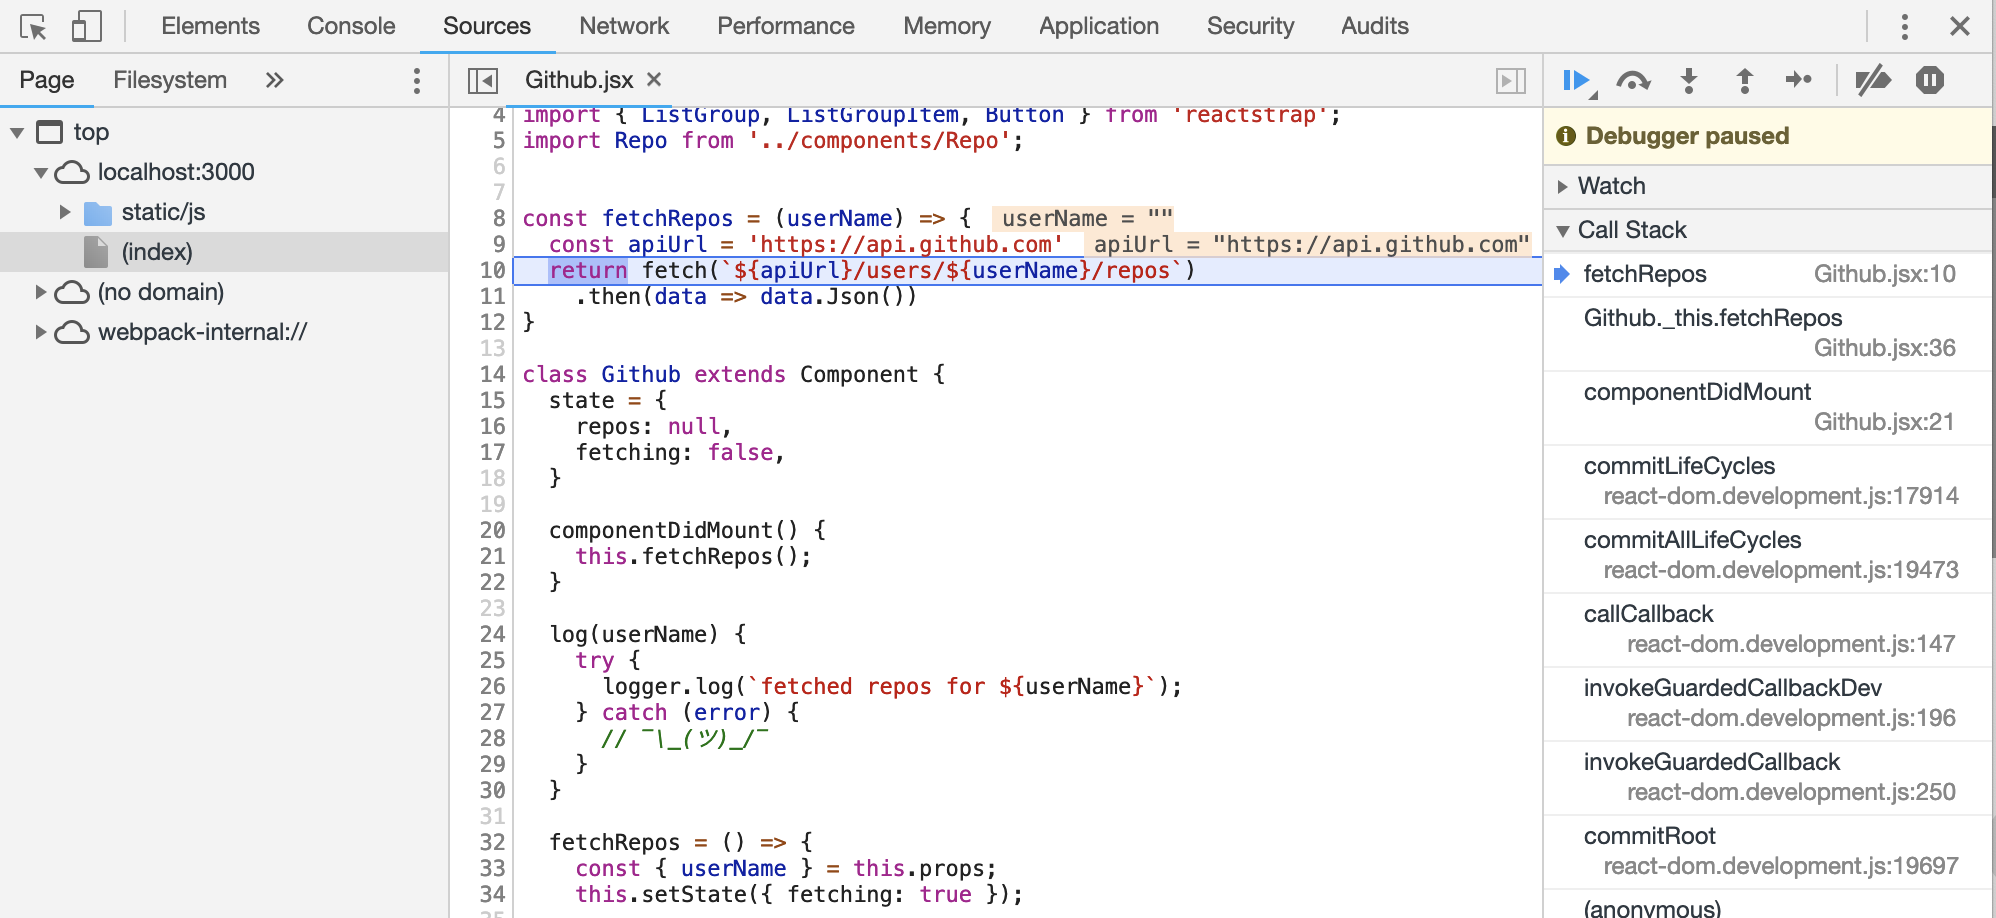
Debug
Debug
- Scope
- Call stack
- Step over, Step into, Step out
- Continue to here, Restart frame
- XHR breakpoints
- Watch
- Event listener breakpoints
- Conditional breakpoint
- Logpoint
- Pause on exceptions
- Async callstack
- debugger
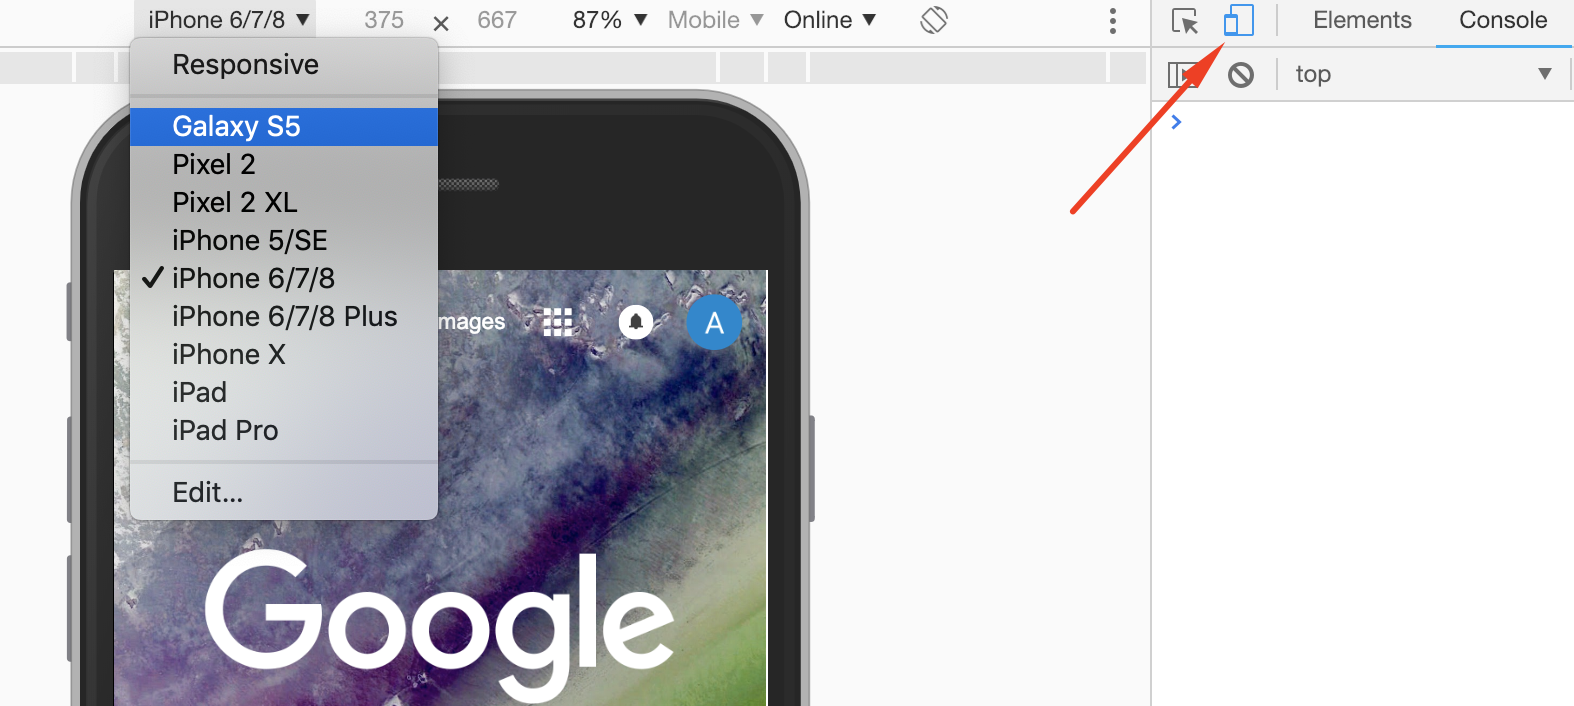
Emulating mobile device

Emulating mobile device
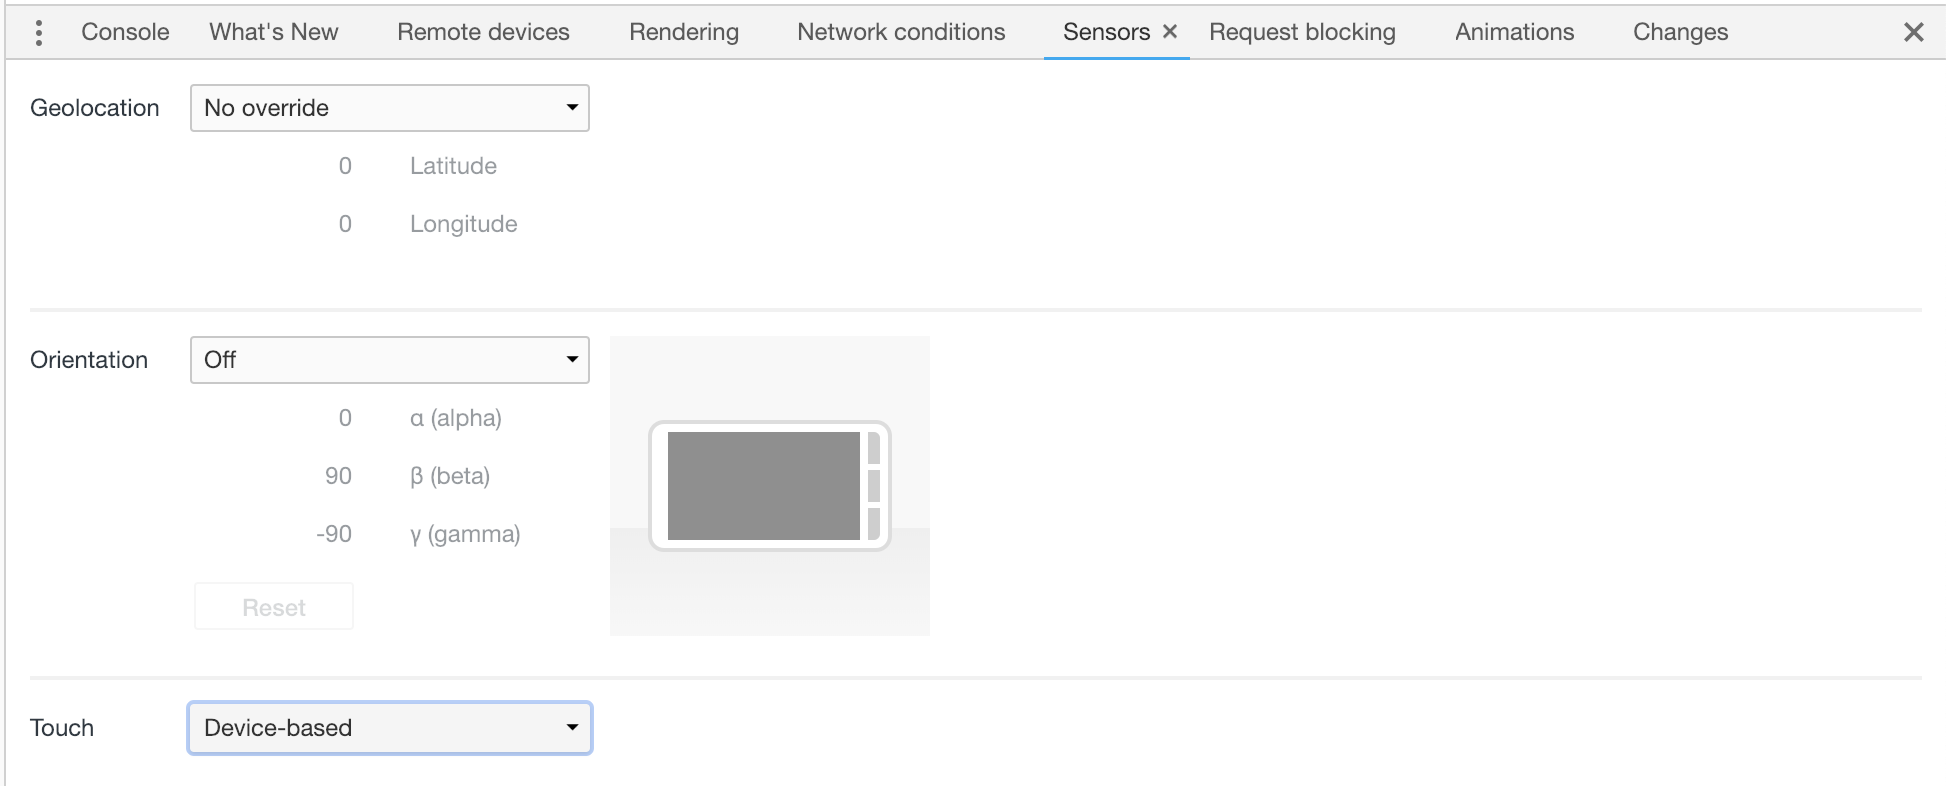
Sensors
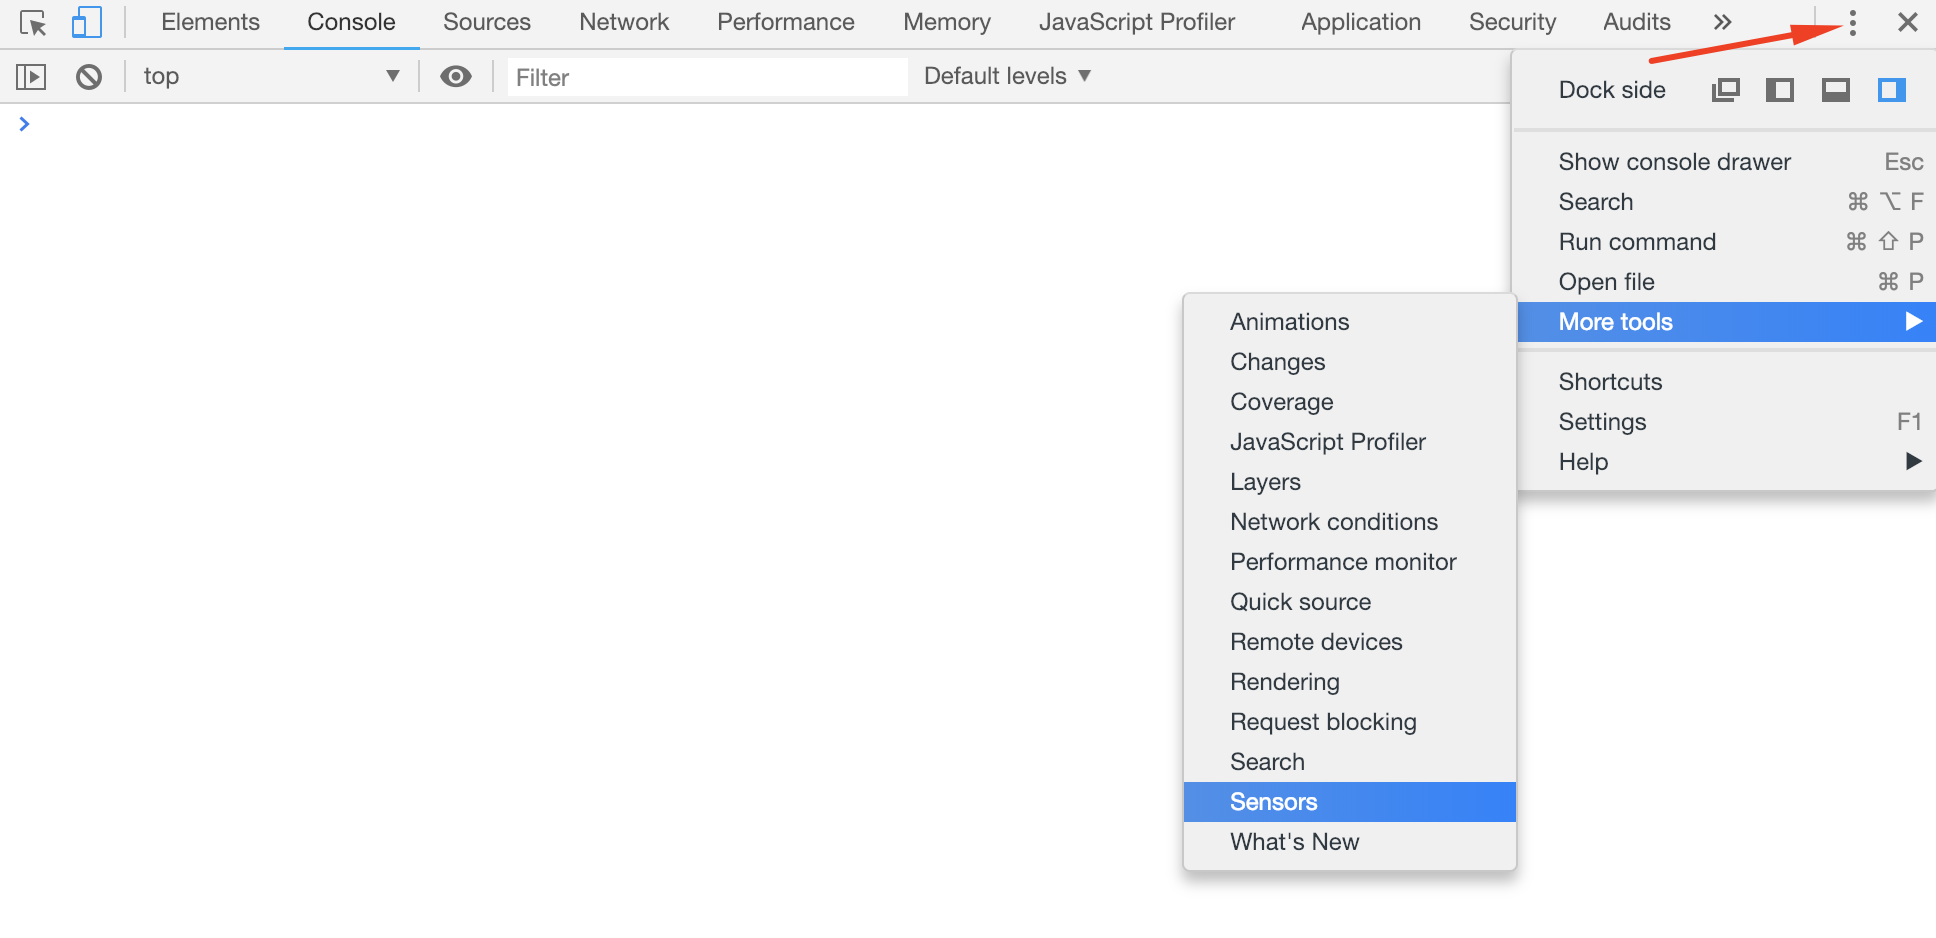
Sensors
Remote Debugging
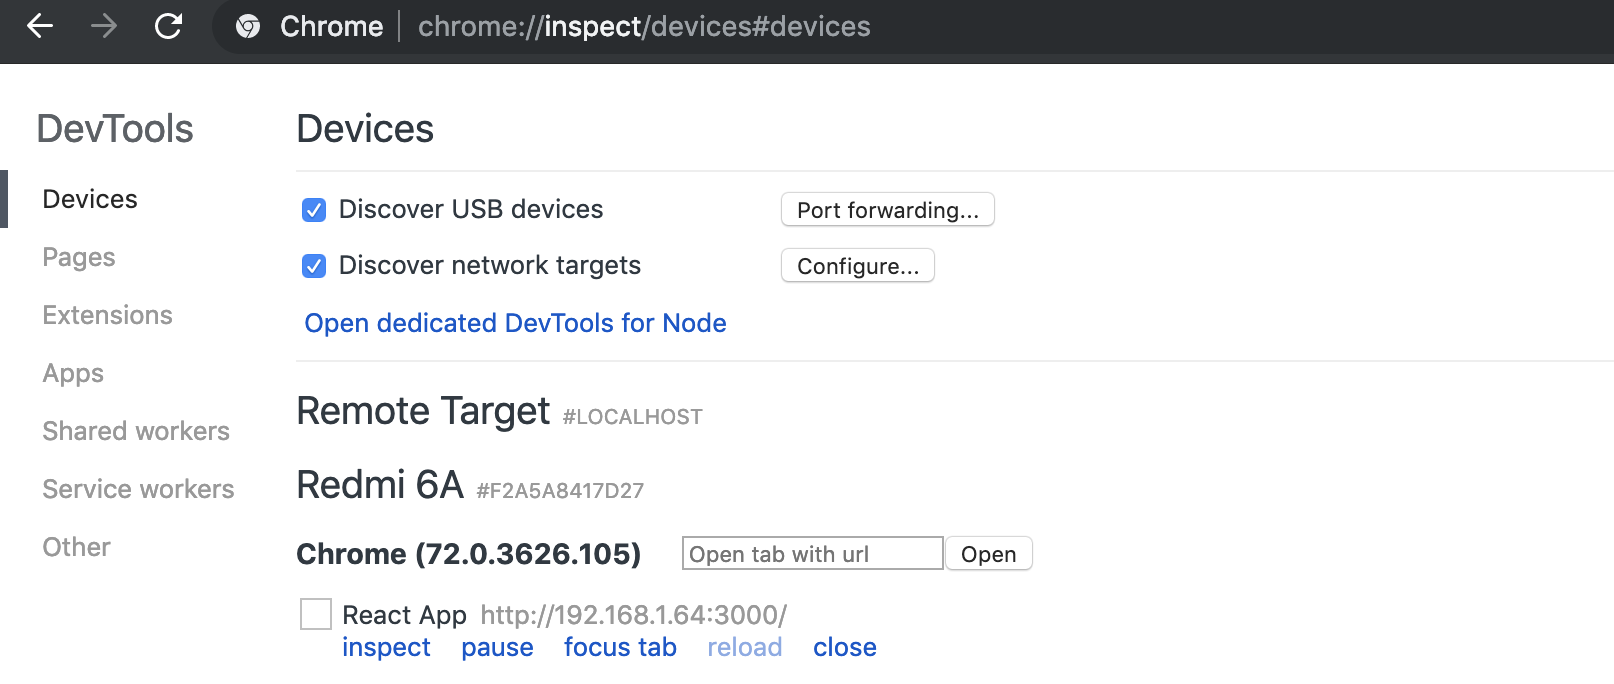
Remote Debugging
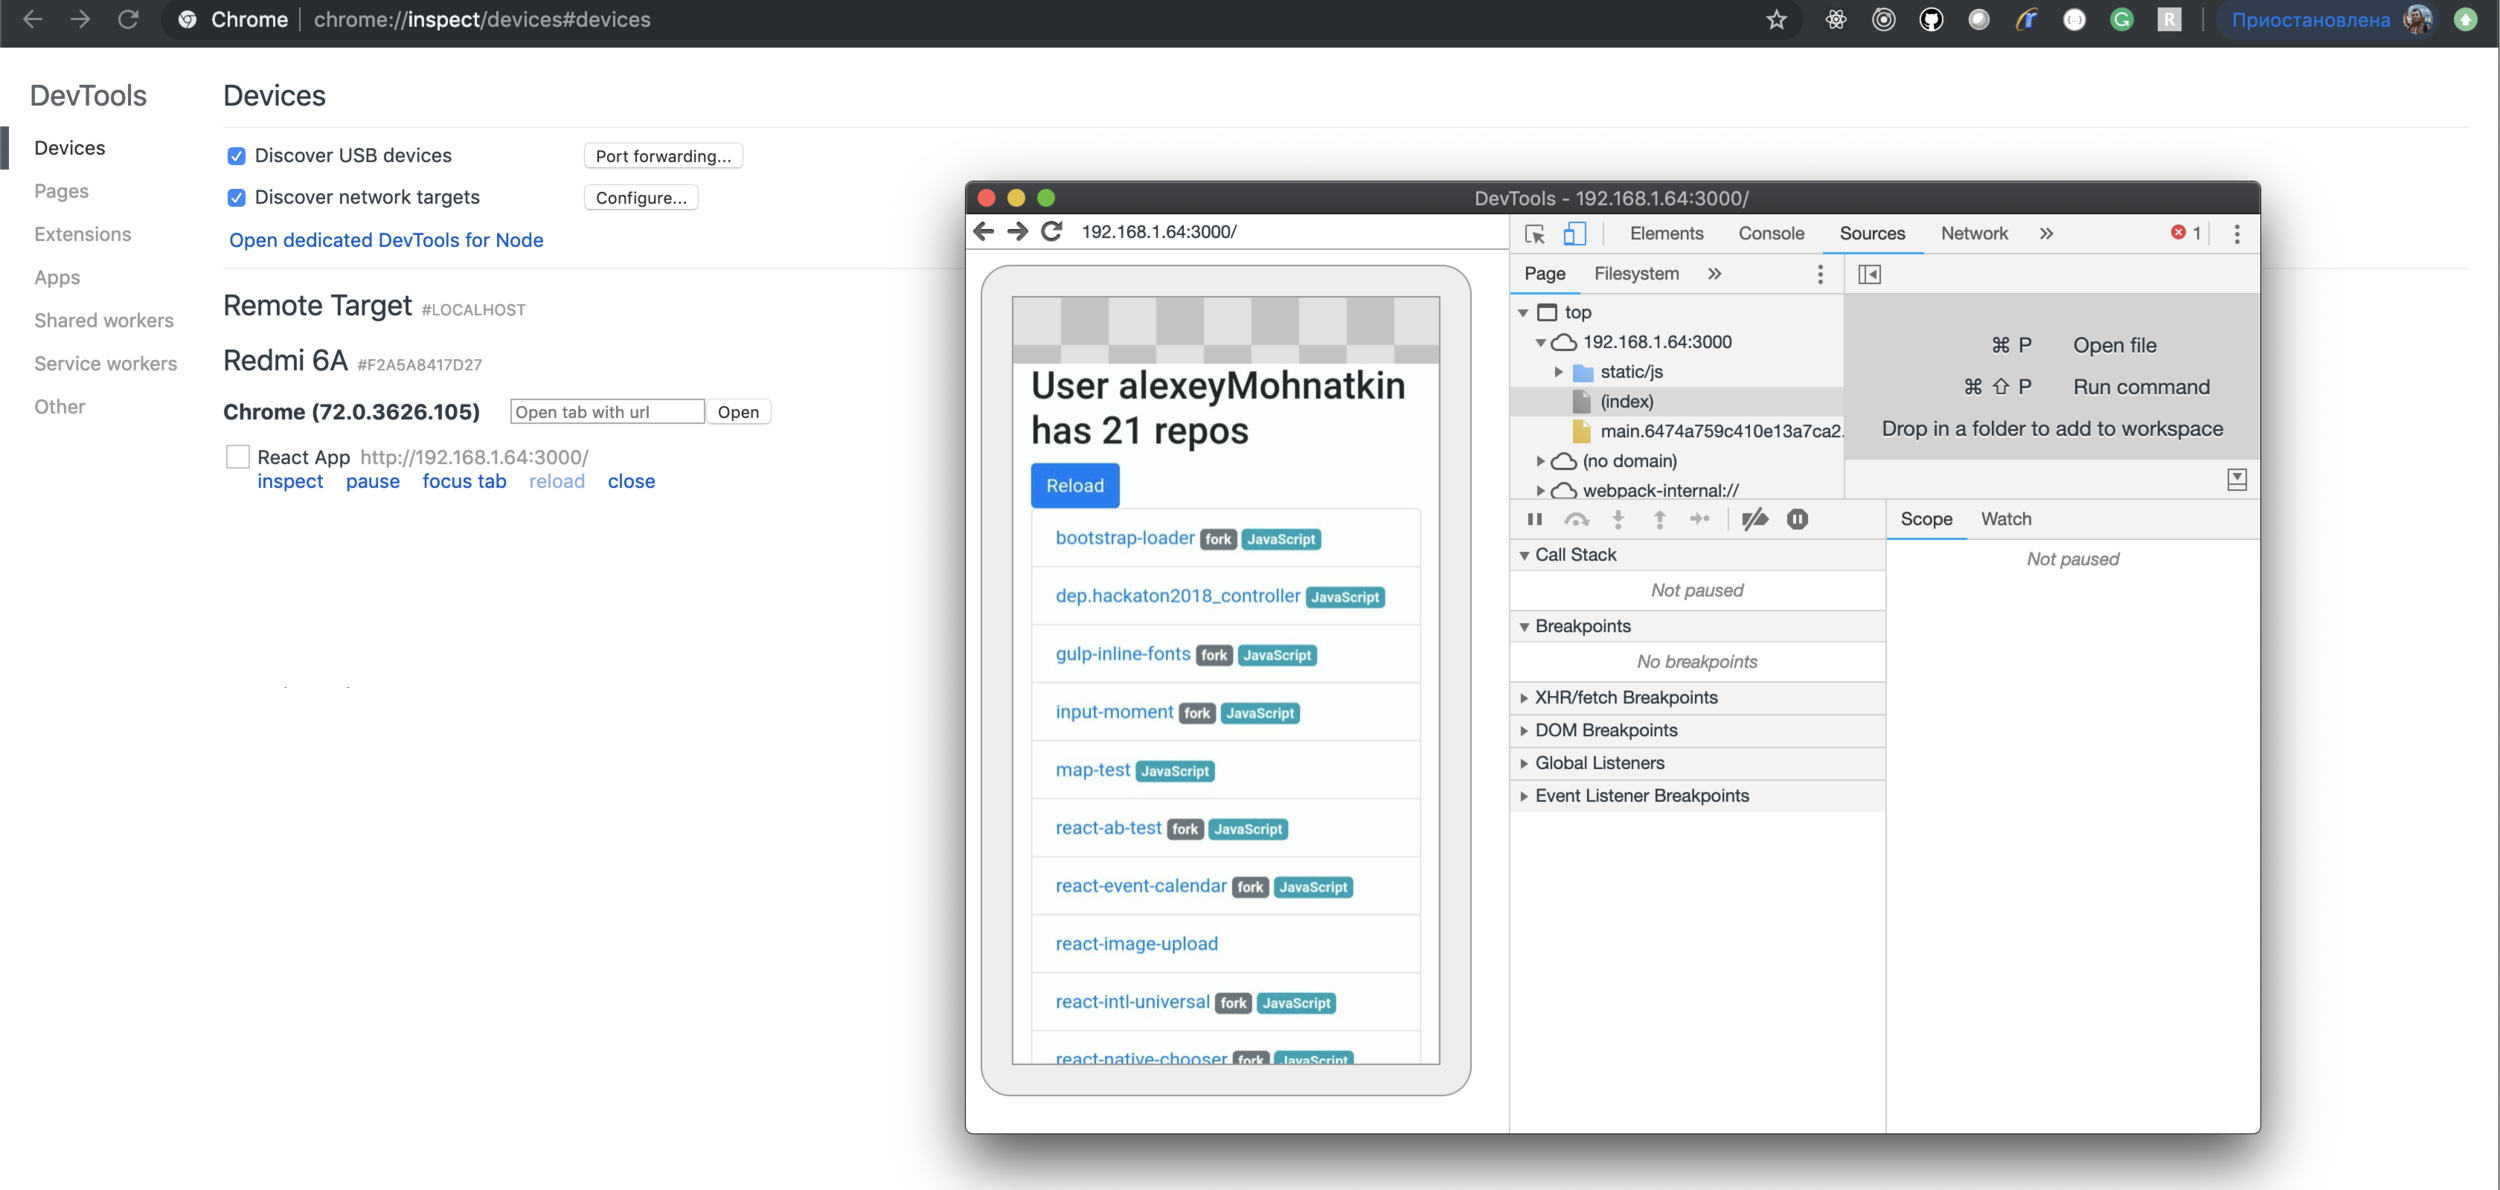
Remote Debugging
- Эмуляция любых мобильных устройств
- Media queries
- Подмена геолокация
- Эмуляция поворота устройства
- Эмуляция touch событий
- Удаленная отладка на телефоне
Network
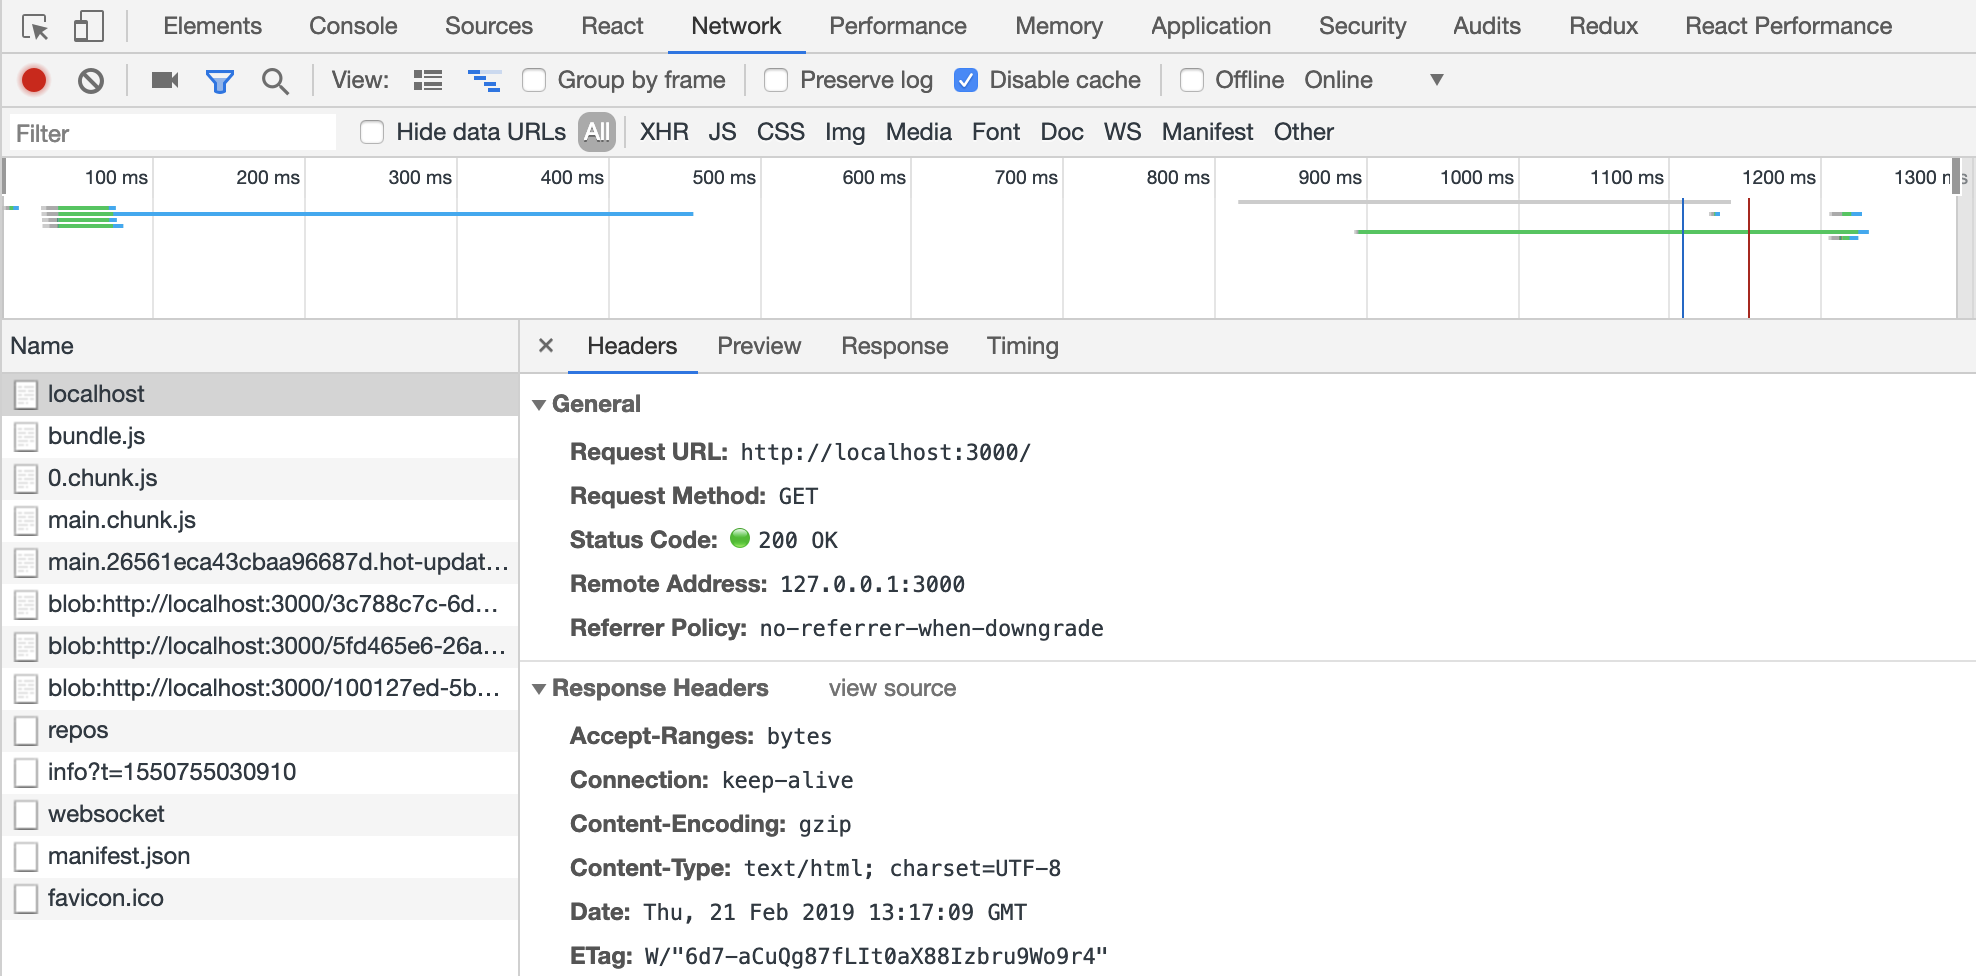
Network
VS Code
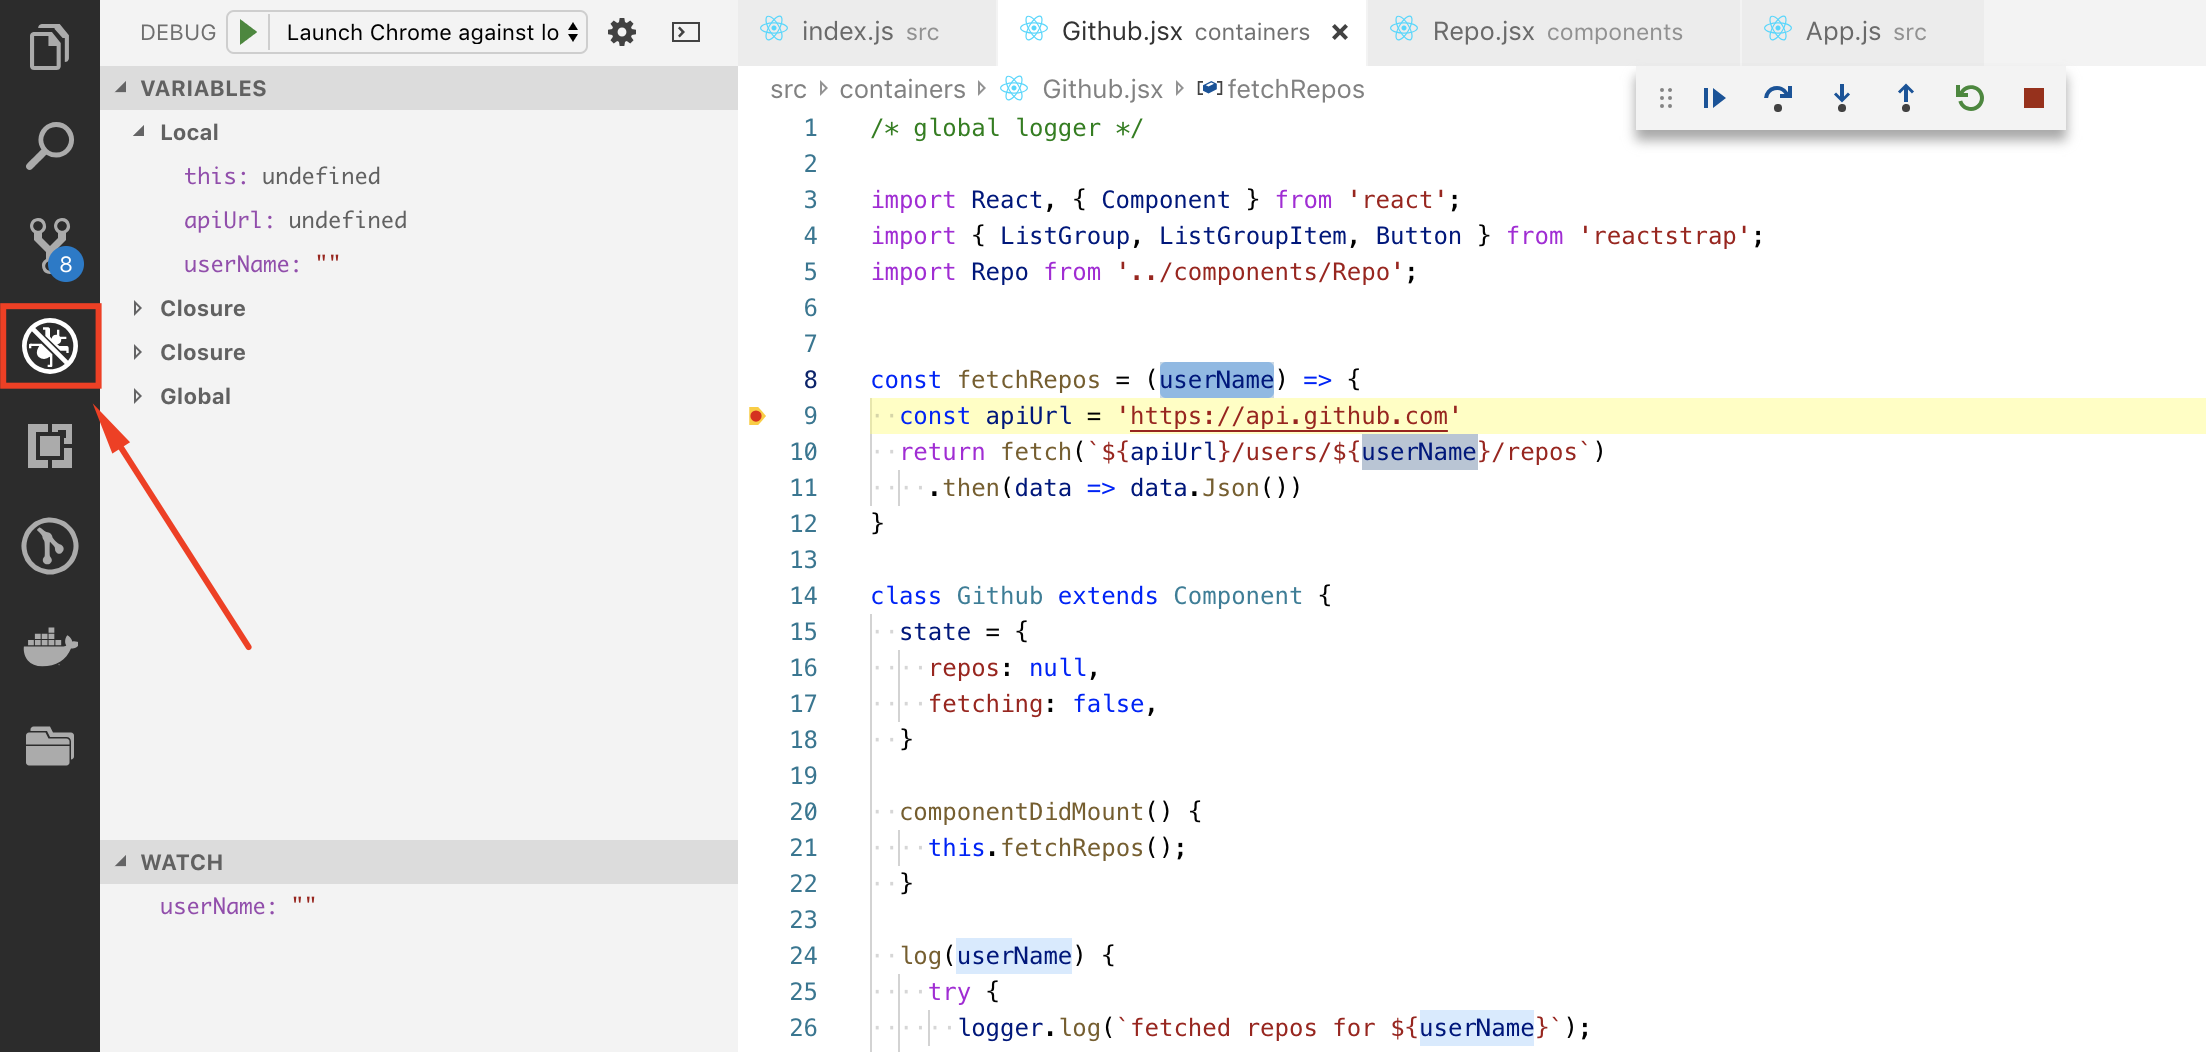
VS Code
VS Code
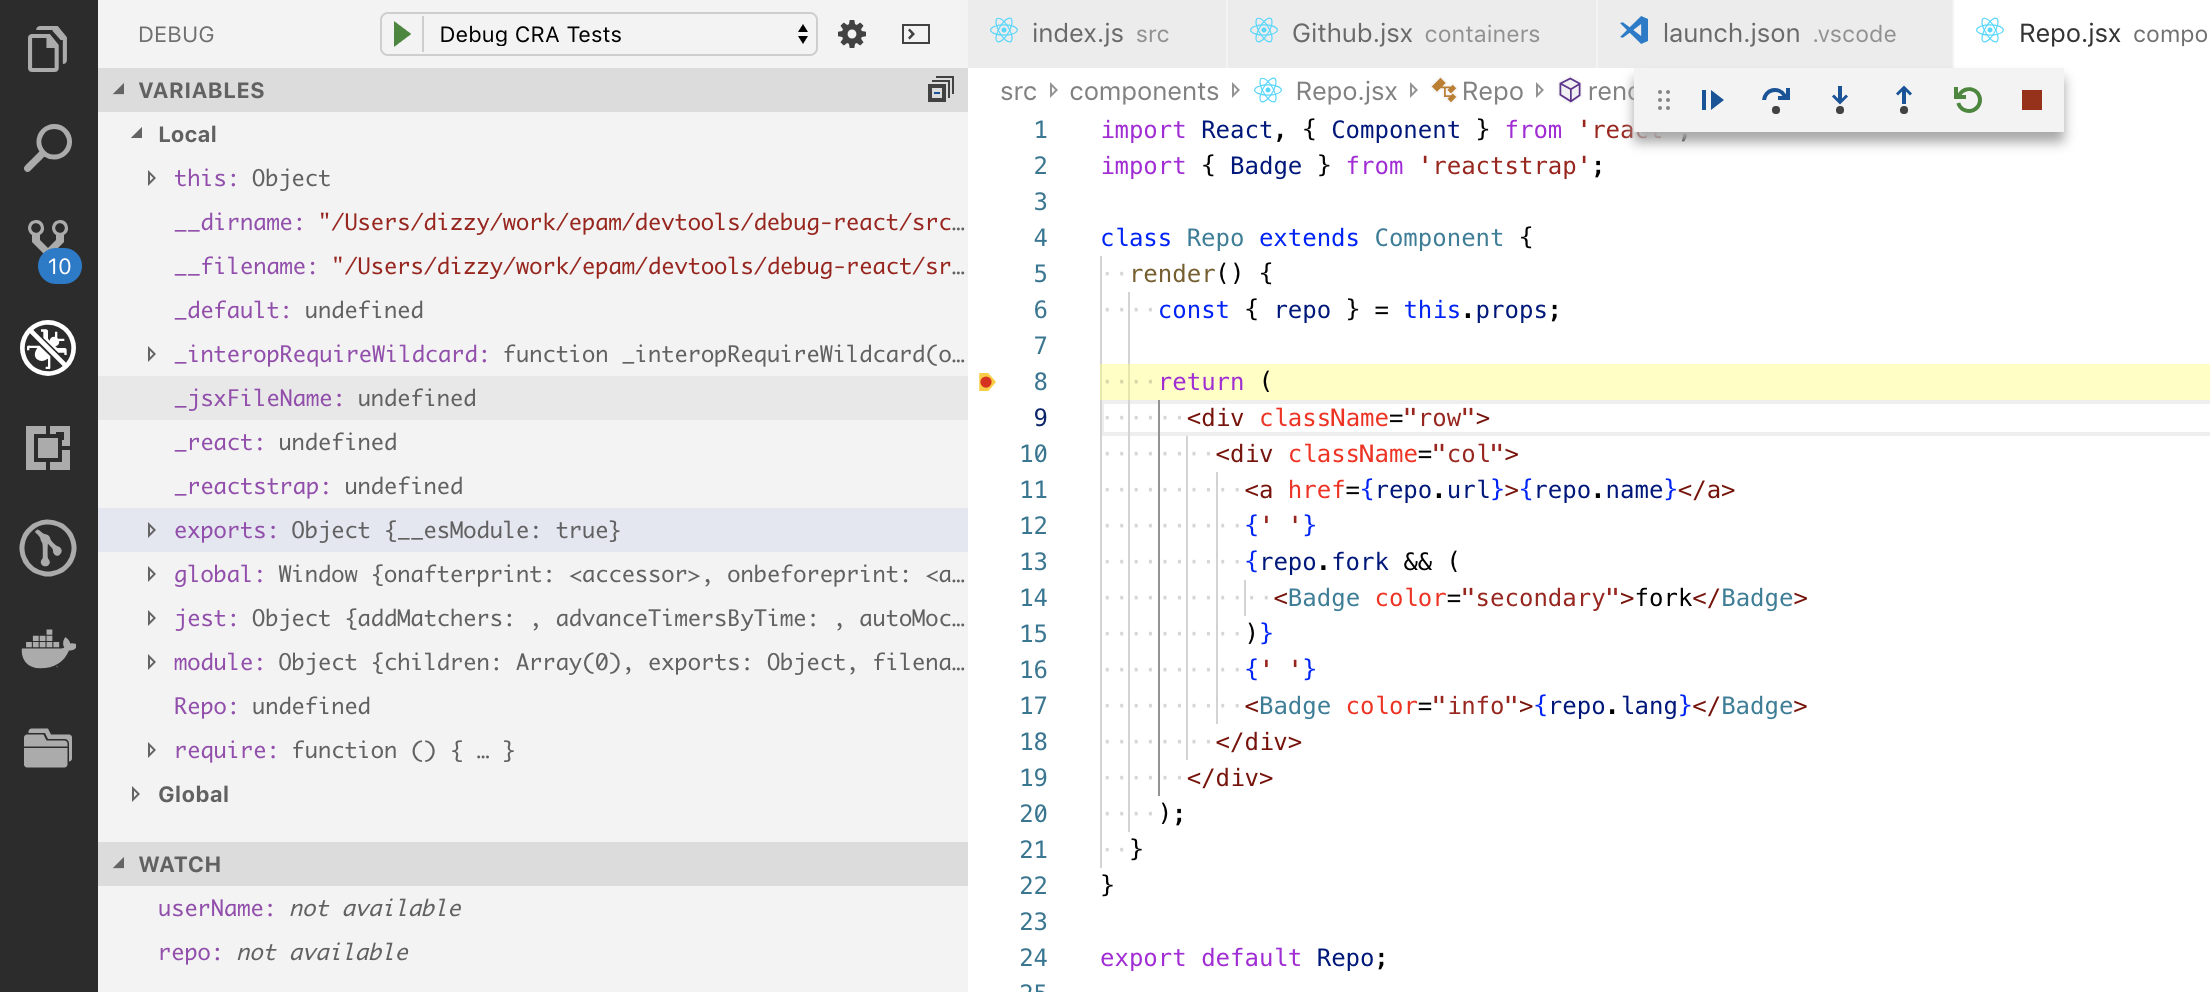
VS Code
- Отладка в браузере
- Отладка тестов
Node.js
Perfomance
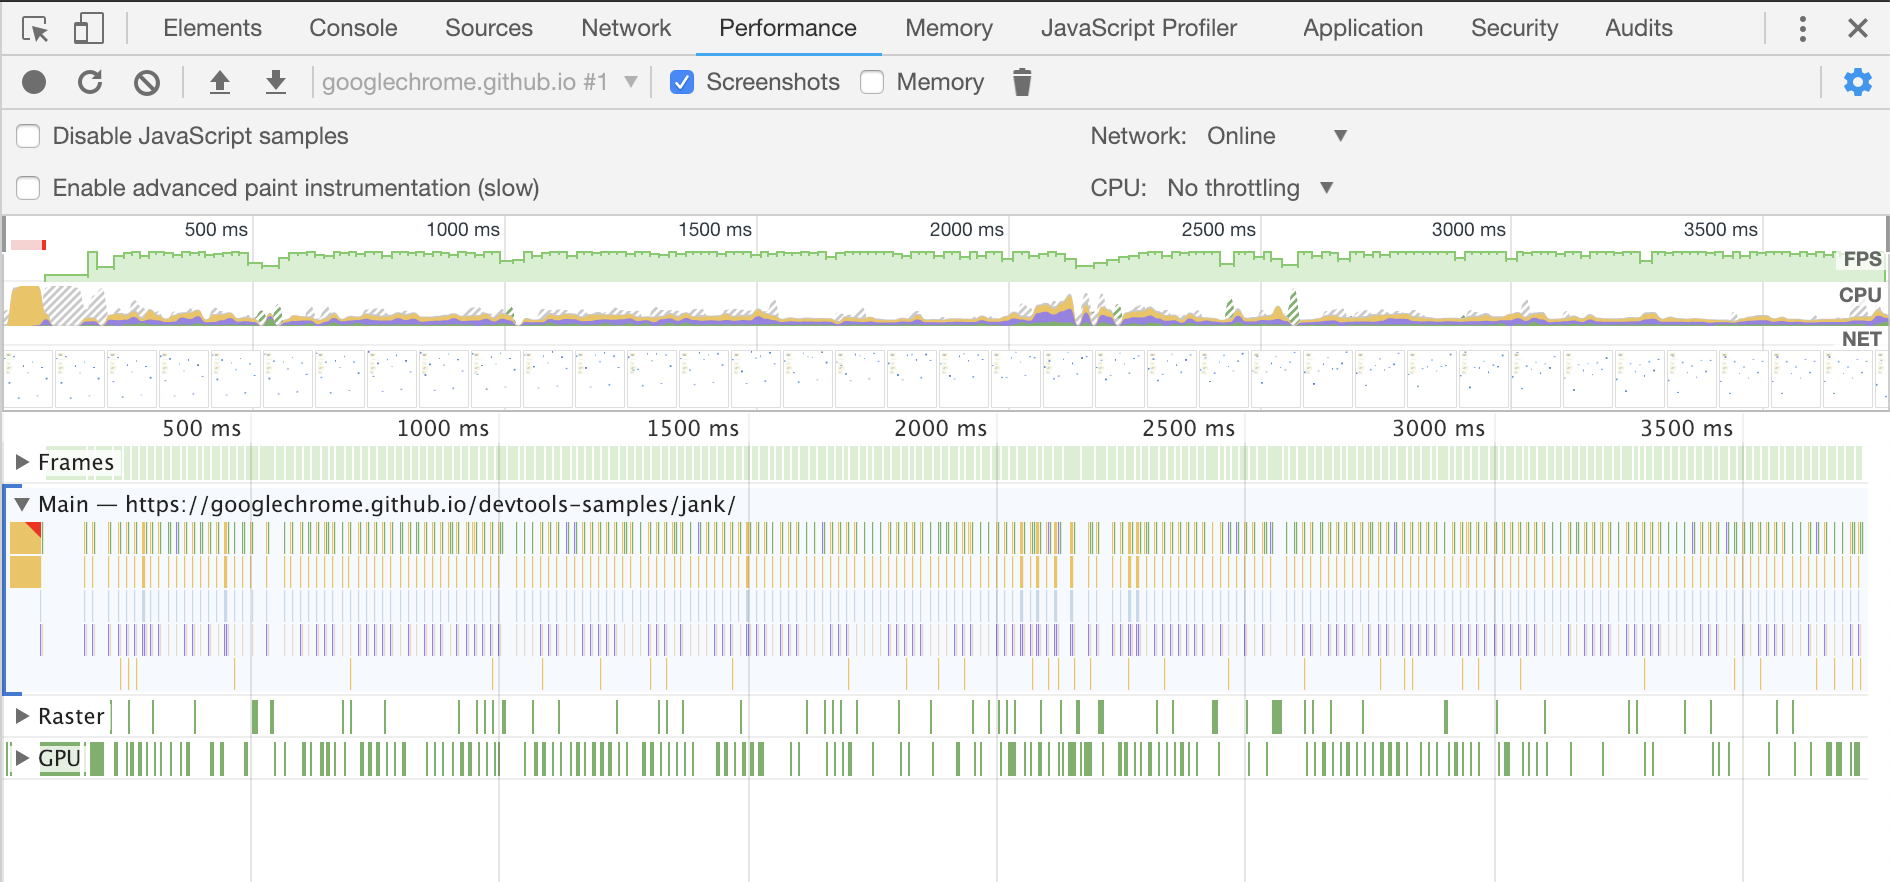
Perfomance
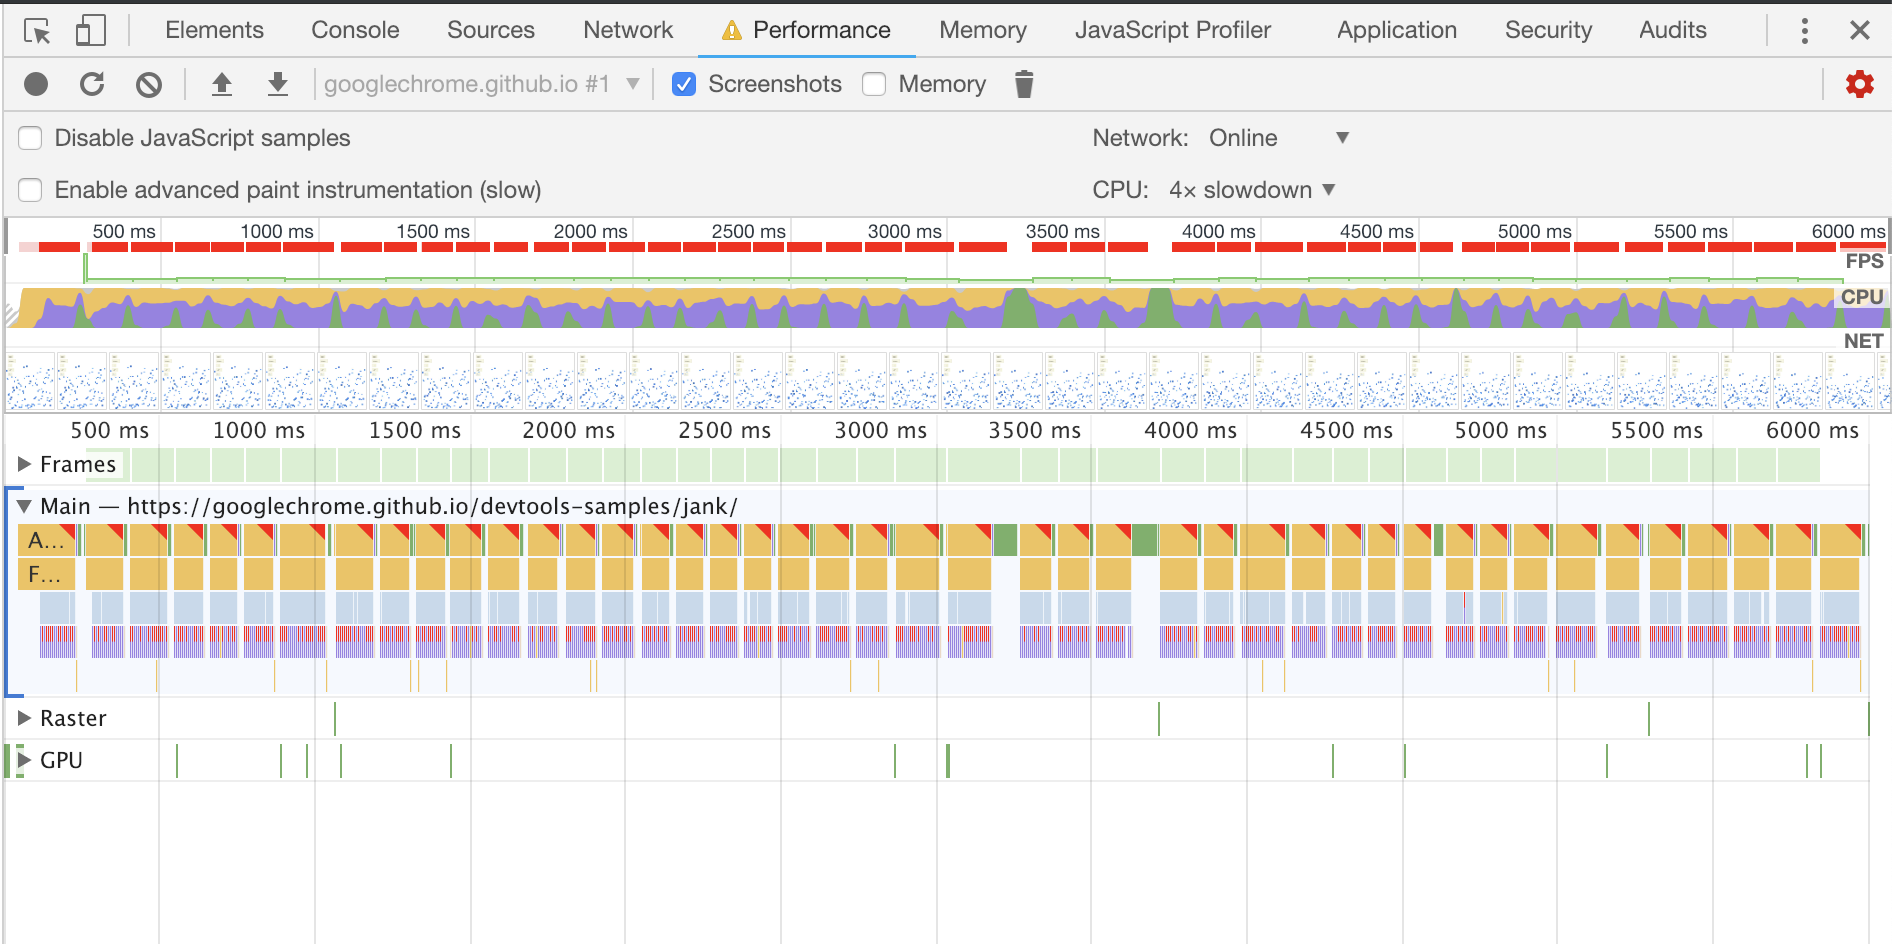
Perfomance
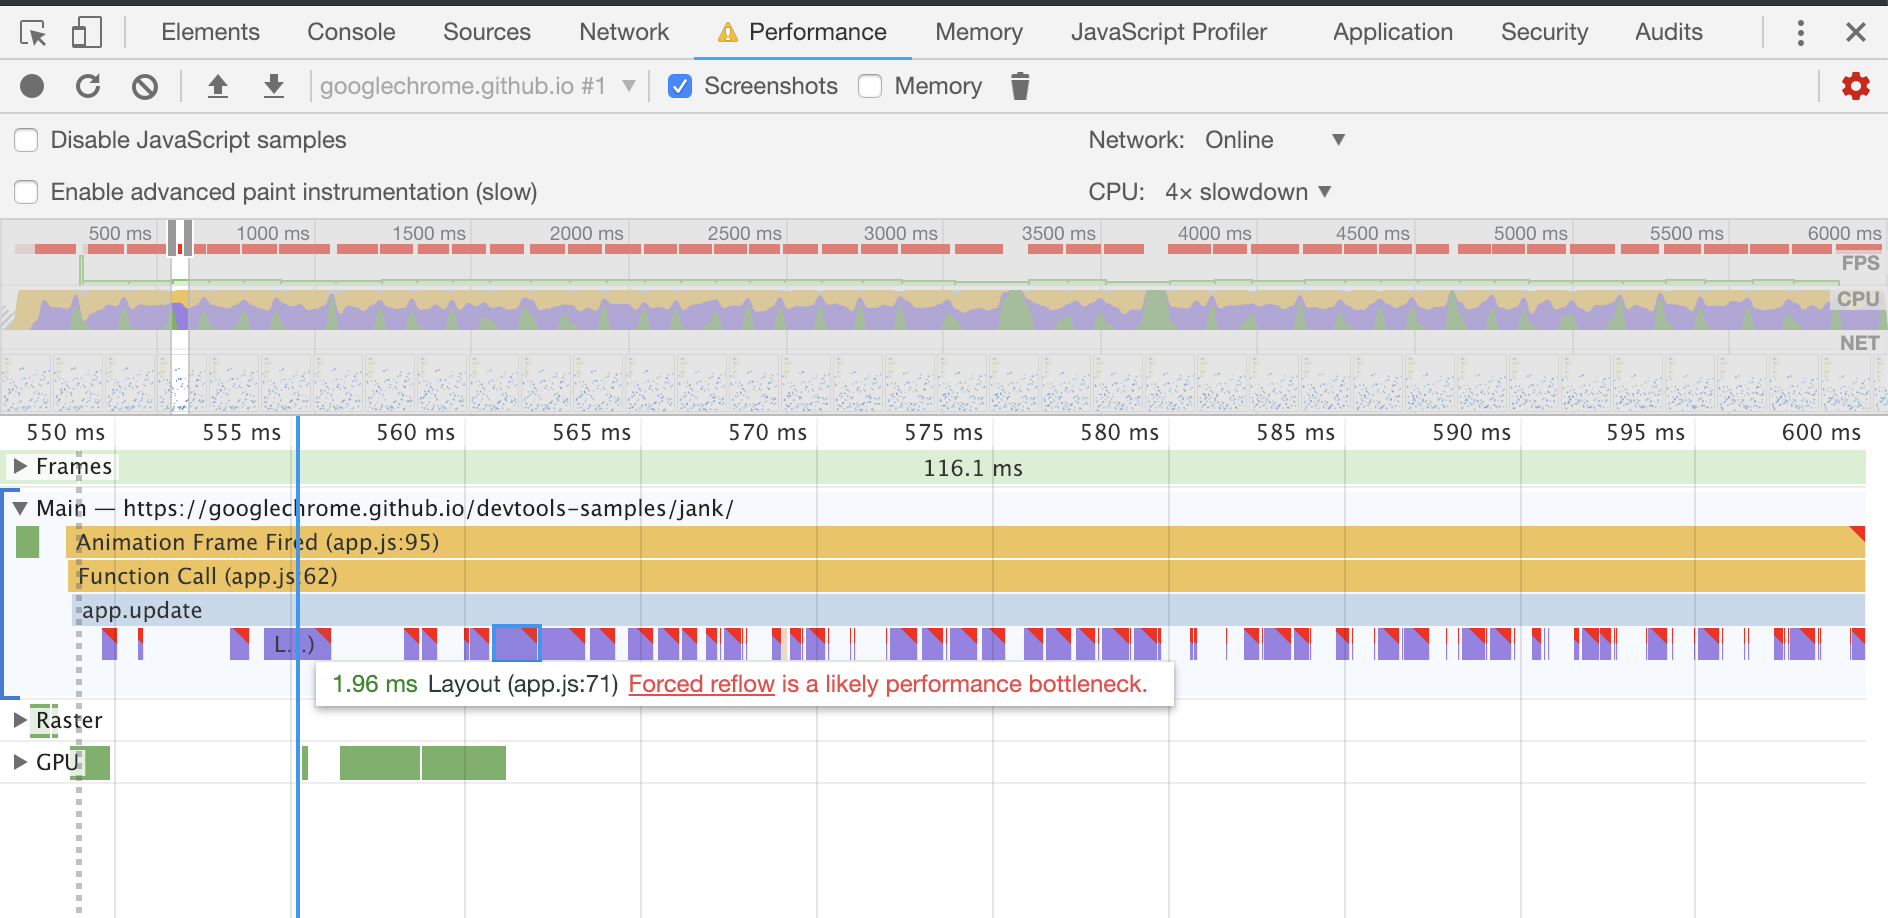
Perfomance
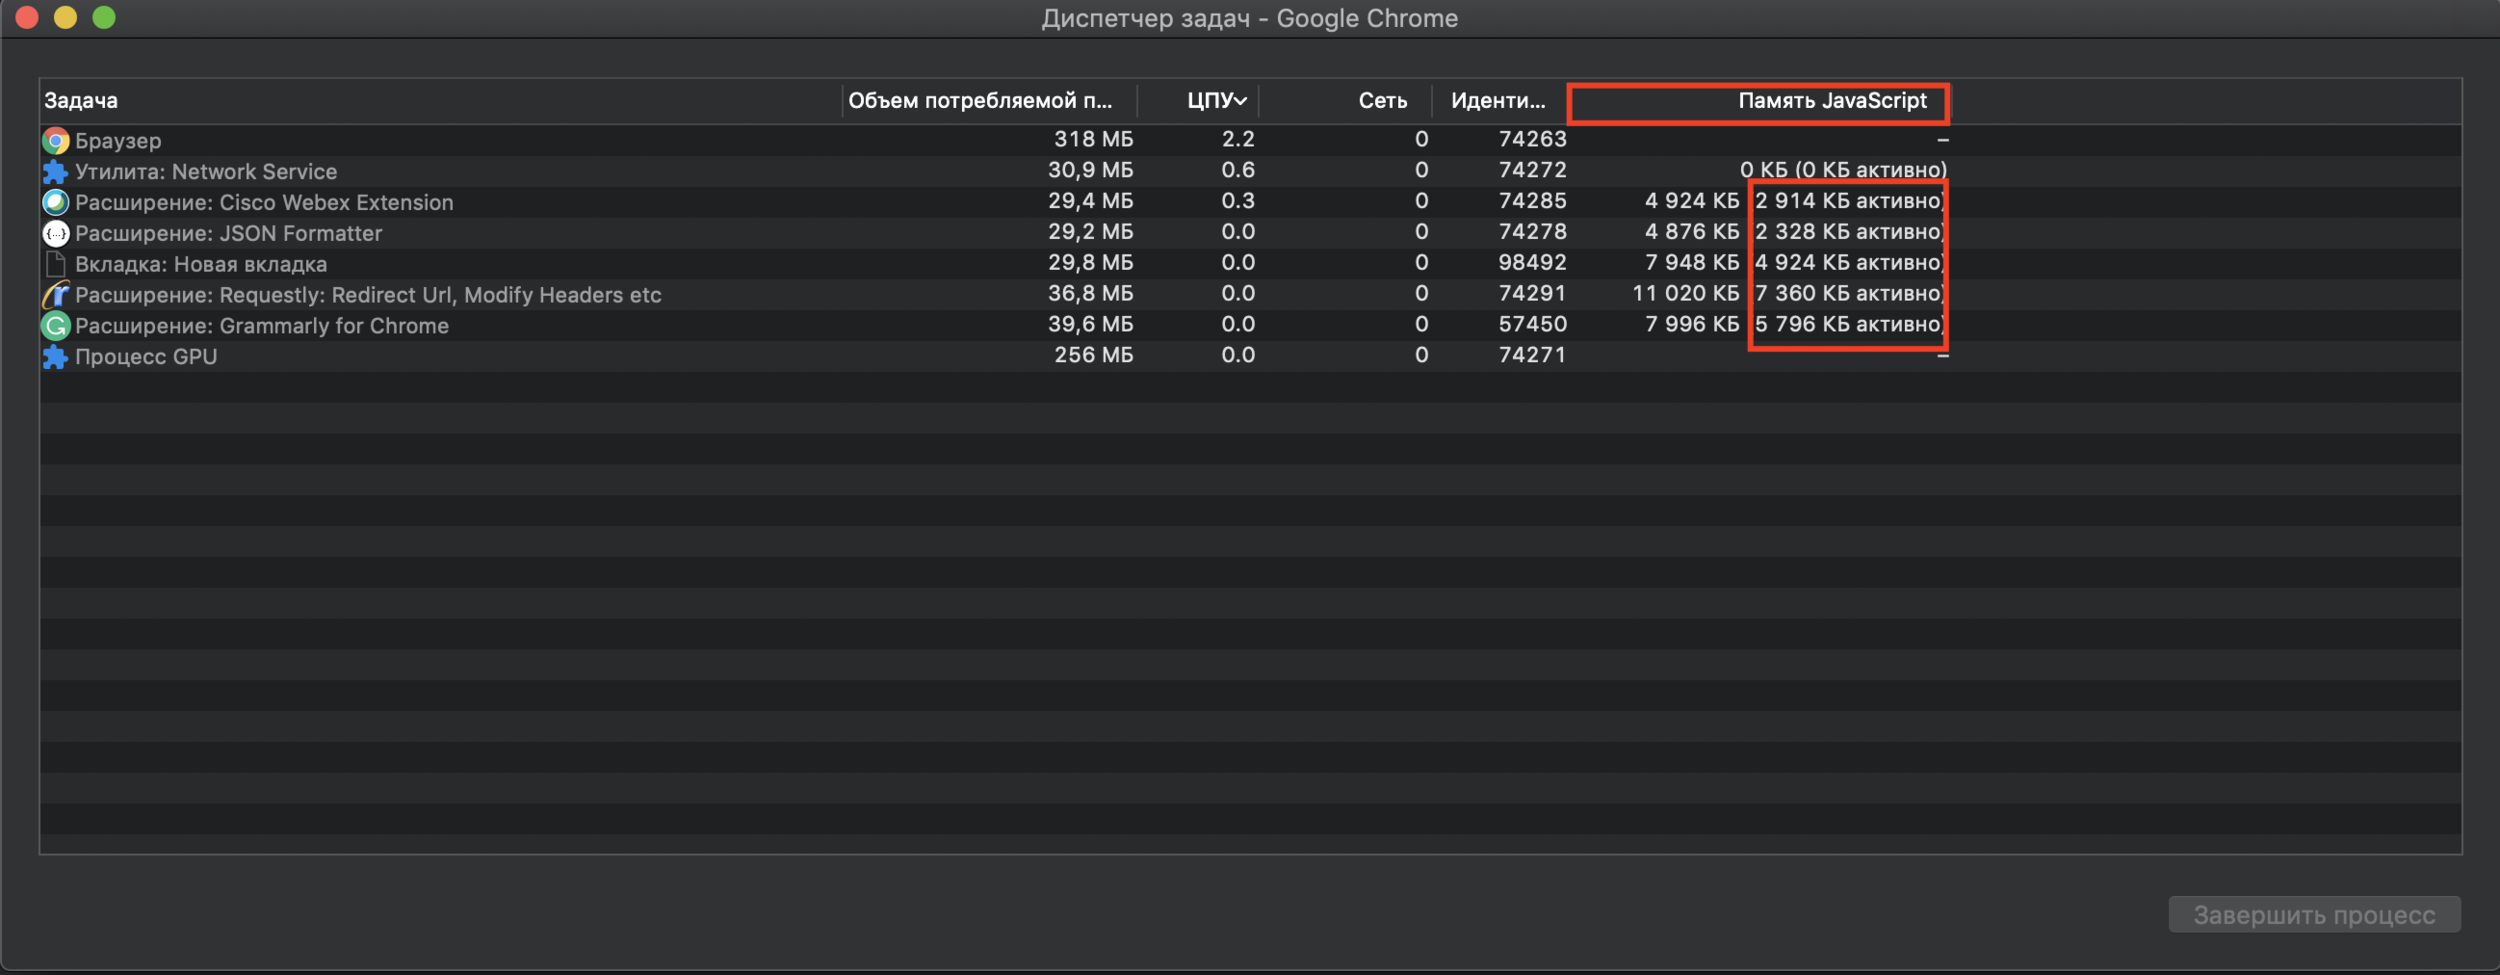
Memory
Chrome devtools
By dizzy mohnatkin

