Data analytics & AI:
uses cases applied to marketing
Nicolas Rochet
2022
Some applications to marketing
Customer Segmentation
Churn prediction
Sentiment analysis
Brand reputation
SEO optimization
Recommendation
Customer Experience
Image captioning
Image generation
Attribution modeling
Some applications to marketing
Customer Segmentation
Profile customers by creating charcteristic groups
Data type
Output
Data processing
Clustering
algorithms
Association rule
Personal data
Data from a product/service use
Global customer tendencies
Classify customer in characteristic groups
...
Example of customer segmentation
Profile customers by creating charcteristic groups
Data
Results
Contract & calls data from customers of a phone company
K-Means
Clusters of customers
data preparation
Exploration of clusters specificity
Data processing
K-means


Some applications to marketing
Churn prediction
Predict client that will unsuscribe
Data type
Output
Classification
algorithms
Personal data
Data from a product/service use
Predict if a new client will churn
...
Data processing
Example of churn prediction
Data
Results
Contract & calls data from customers of a phone company
Random Forest
Performance metrics
data preparation
Data processing
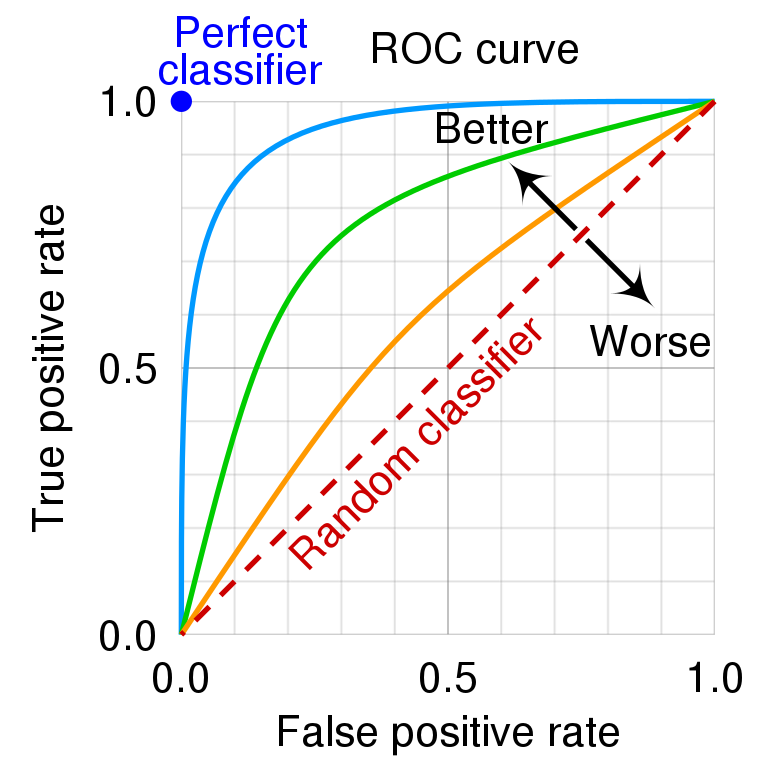
ROC curve
confusion matrix
| 1 |
|---|
| 0 |
| 1 |
| 0 |
churn
+
Predict client that will unsuscribe
Arbres de décisions
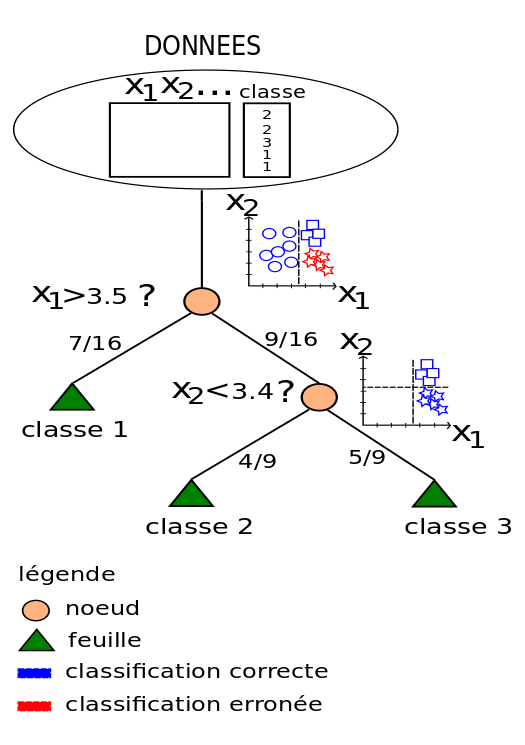
Principe:
trouver une règle la plus optimale pour partitionner les données en "clusters" homogènes
Some applications to marketing
Sentiment analysis
Classify spontaneous sentiment from textual data
Text data
Output
Classification
algorithms
reviews
social network
messages
Predict customers opinion polarity
...
Data processing
Pre trained model
or
NLP dictionnaries
Data
Results
tweets from airlines's customer
SVM
Performance metrics
data preparation
Data processing
precision/recall
confusion matrix
| 1 |
|---|
| 0 |
| -1 |
| 0 |
sentiment
+
Example of sentiment analysis
Classify spontaneous sentiment from textual data
sensitivit/specificity
Séparateur à Vaste Marge (SVM)
Support Vector Machine
Maximise la distance entre une frontière de décision et différentes classes d'échantillons

Beware of models !
Each model remains an
approximation of reality !
All models are wrong, but some are usefull, Georges Box
Your challenge consist to build models that can generalize to unseen data !
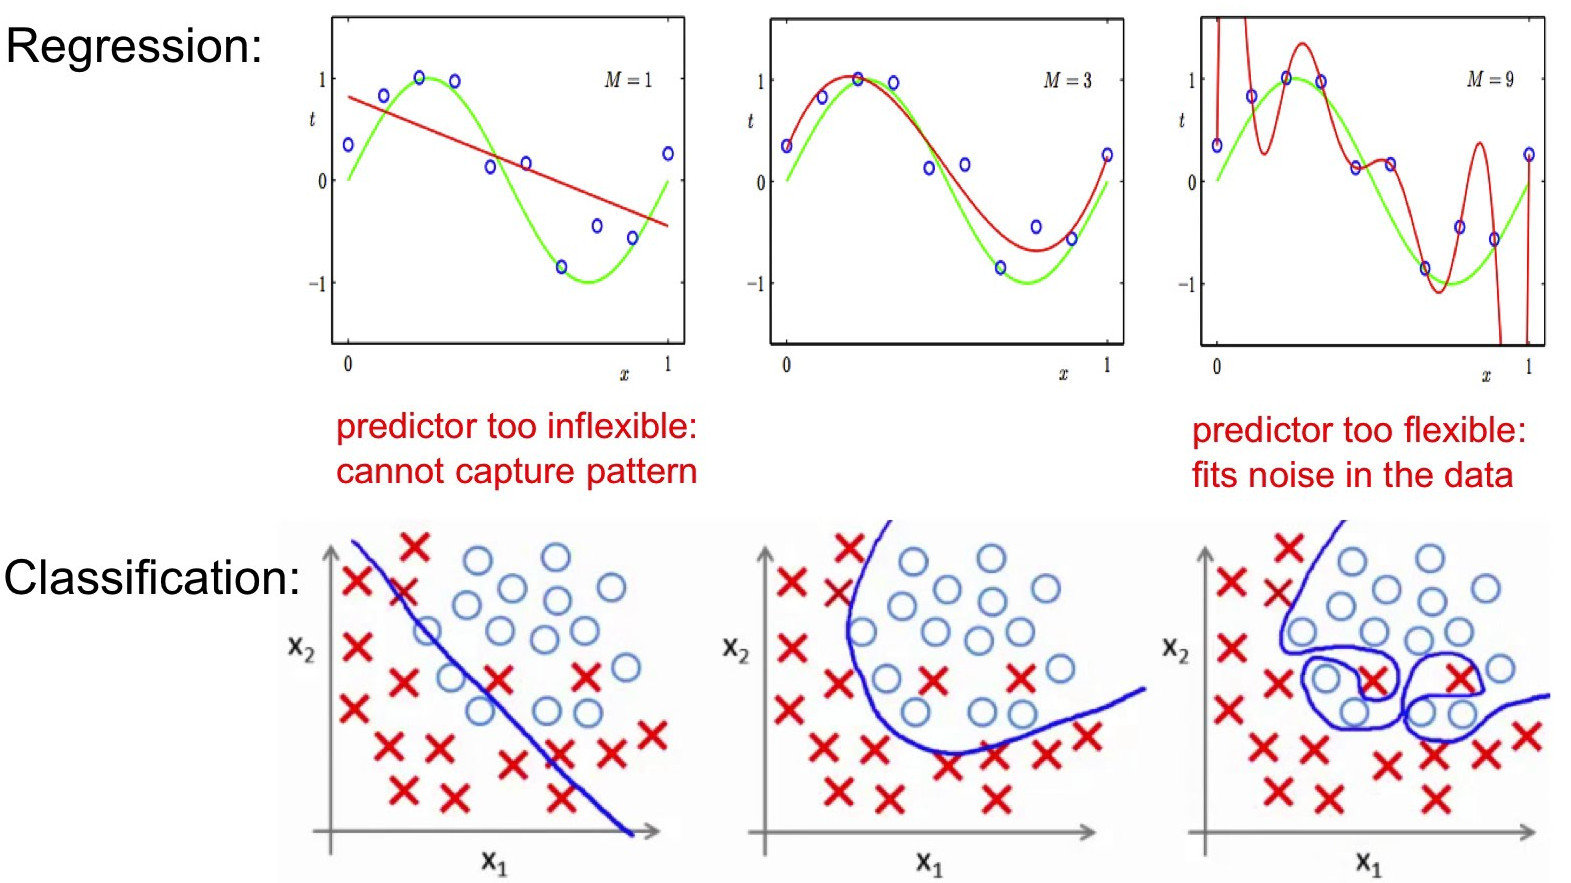
Beware of models !
Remember the over fitting problem !
Evaluate your model
You need to choose your evaluation metric according to your task :
accuracy
F1 score
precision/recall
area under ROC curve
mean squared error
pourcentage of explained variance
inter-clusters distance mesures
Classification
Regression
Clustering
cluster homogeneity
based
measure
sensitivity/specificity
Common classification metrics
Predicted condition
Actual condiction
Confusion Matrix ... and associated metrics
\color{text}
TP
TP + FP
precision
=
\color{text}
TP
TP + FN
recall
=
fraction of real positive observations among those predicted positive
fraction of real positive observations among those really positive
| Positive (P) |
| Positive (P) |
| True Positive (TP) |
| True Negative (TN) |
| False positive (FP) |
| False negative (FN) |
| Negative (N) |
| Negative (P) |
Common classification metrics
Predicted condition
Actual condiction
\color{text}
precision x recall
precision + recall
F1 score
=
2
Confusion Matrix ... and associated metrics
\color{text}
TP
TP + FP
precision
=
\color{text}
TP
TP + FN
recall
=
| Positive (P) |
| Positive (P) |
| True Positive (TP) |
| True Negative (TN) |
| False positive (FP) |
| False negative (FN) |
| Negative (N) |
| Negative (P) |
Common classification metrics
Predicted condition
Actual condiction
\color{text}
TN = 7+9+3+5
TP = 5
| Apple |
| Orange |
| Mango |
| Apple | Orange | Mango |
| 5 |
| 2 |
| 1 |
| 5 |
| 7 |
| 3 |
| 9 |
| 5 |
| 2 |
| 5 |
FN = 2+5
FP = 2+1
calcul for an actual apple
Common classification metrics
Predicted condition
Actual condiction
Confusion Matrix ... and associated metrics
\color{text}
TN
FP + TN
specificity
=
\color{text}
TP
TP + FN
sensitivity
=
fraction of real negative observations among those really negative
fraction of real positive observations among those really positive
| Positive (P) |
| Positive (P) |
| True Positive (TP) |
| True Negative (TN) |
| False positive (FP) |
| False negative (FN) |
| Negative (N) |
| Negative (P) |
Predicted condition
Actual condiction
\color{text}
TP
P
true
positive rate
=
\color{text}
FP
P
false positive rate
=
| Positive (P) |
| Positive (P) |
| True Positive (TP) |
| True Negative (TN) |
| False positive (FP) |
| False negative (FN) |
| Negative (N) |
| Negative (P) |
Time for practice !
Uses cases marketing
By Nicolas Rochet
Uses cases marketing
Principles and uses cases of data anlytics for marketing


