
Droste
Droste is a Hong Kong-based Data Science Consultancy
a talk by Mart van de Ven
Those guys are cool! I've got nothing to do with them!
code
data
widgets
graphics
<CODE>
The Twitter of Graphics
username = 'CHANGEME'
api_key = 'CHANGEME' # Get it from https://plot.ly/settings/api

import plotly.tools as tls
tls.set_credentials_file(username=username, api_key=api_key)
import plotly
from plotly.offline import plot, iplot
from plotly.graph_objs import *
plot({
"data": [
Scatter(x=[1, 2, 3, 4], y=[4, 1, 3, 7])
],
"layout": Layout(
title="hello world"
)
})
# Notice that it return a file path -
# that's where it exported the
# HTML file to containing your plotimport plotly
from plotly.offline import plot, iplot
from plotly.graph_objs import *
# run at the start of every notebook
plotly.offline.init_notebook_mode()
iplot({
"data": [{
"x": [1, 2, 3],
"y": [4, 2, 5]
}],
"layout": {
"title": "hello world"
}
})online
offline
offline - notebook
data = [
    Scatter(
        x=[1, 2, 3],
        y=[3, 1, 6],
        mode="markers+lines",
        marker=dict(
            color="rgb(16, 32, 77)"
        )
    ),
    Bar(
        x=[1, 2, 3],
        y=[3, 1, 6],
        name="bar chart example"
    )
]
Plotly's graph description places attributes into two categories: traces (objects that describe a single series of data in a graph like Scatter or Heatmap) and layout attributes that apply to the rest of the chart, like the title, xaxis, or annotations).
layout = Layout(
    title="simple example",
    xaxis=dict(
        title="time"
    ),
    annotations=[
        dict(
            text="simple annotation",
            x=0,
            xref="paper",
            y=0,
            yref="paper"
        )
    ]
)
figure = Figure(data=data, layout=layout)
iplot(figure)<DATA>
cf.datagen.lines().iplot(
    kind='scatter',
    xTitle='Dates',
    yTitle='Returns',
    title='Cufflinks - Line Chart')
cf.datagen.lines(2).iplot(
kind='spread',
xTitle='Dates',
yTitle='Return',
title='Cufflinks - Spread Chart')
cf.datagen.scatter3d(2,150).iplot(
    kind='scatter3d',
    x='x',y='y', z='z',
    size=15,
    categories='categories',
    text='text', title='Cufflinks - Scatter 3D Chart',
    colors=['blue','pink'],width=0.5,margin=(0,0,0,0), opacity=1)
import numpy as np
import pandas as pd
import plotly
from plotly.offline import init_notebook_mode, iplot
import cufflinks as cf
init_notebook_mode()
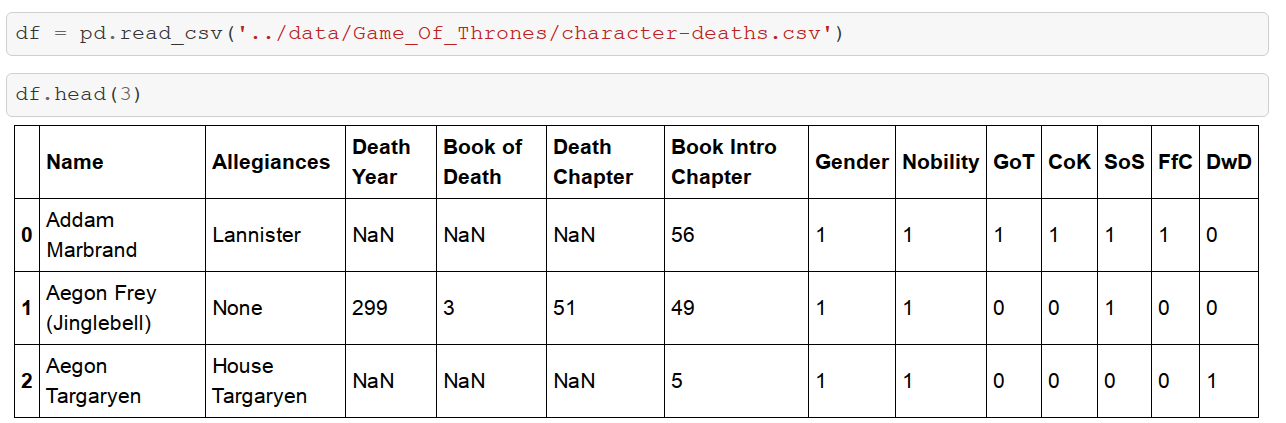
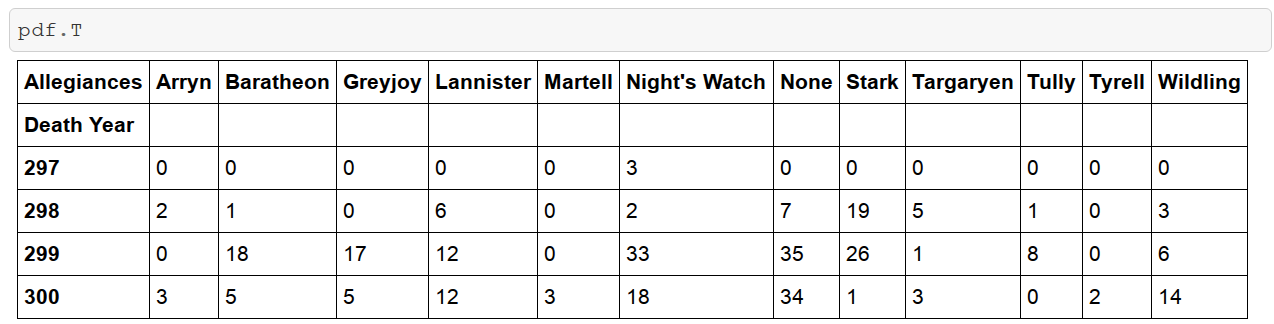
cf.go_offline()from a 'tidy' dataset to pivot table
# Groupby
deaths = df.groupby(['Death Year','Allegiances'])

# Aggregate Operation
df_deaths = deaths.count()[['Name']]

# Unstack
df_deaths = df_deaths.unstack().fillna(0)

# Plot
df_deaths.iplot(kind='bar')
<dashboards.ly>
<dash>
JSON API - describes the layout and composition of the web applications
HTTP API - how components depend on each other and how components should update when the front-end state changes
Front-end implementation - render components that are supplied to it and thread actions and event handlers into the components.
Component Suites - e.g. dashboards, reports, slides
Each component in the interface has a specific `type`, a set of properties `props`, its own content or set of children.
All native HTML components, e.g. `<div>`, `<h1>`, `<img>`, `<iframe>` are supported. All of their HTML attributes, like `class`, `id`, `style` are supported as `props`.
{
    type: "div",
    props: {
        id: "parent-div",
        style: {
            backgroundColor: 'lightgrey' // distinction with HTML: style properties are camelCased
        }
    },
    children: [
        {
            type: "img",
            props: {
                src: "https://plot.ly/~chris/1638.png"
            }
        }
    ]
}
<div id="parent-div" style="background-color: lightgrey">
<img src="https://plot.ly/~chris/1638.png"/>
</div>JSON renders as HTML
Higher-level components can also be specified in this specification. The front-end is responsible for understanding the component types and knowing how to render them...
{
    type: "PlotlyGraph",
    props: {
        figure: {
            data: [
                {x: [1, 2, 3], y: [4, 1, 6], type: 'scatter'},
                {x: [1, 2, 3], y: [2, 3, 9], type: 'bar'}
            ]
        }
    }
}
if available in the front-end component registry, would rendered using the `plotly.js` library.
{
    type: "div",
    children: [
        {
            type: "dropdown",
            props: {
                id: "dropdown-1"
            }
        },
        {
            type: "dropdown",
            props: {
                id: "dropdown-2",
                dependencies: ["dropdown-1"]
            }
        },
        {
            type: "PlotlyGraph",
            props: {
                dependencies: ["dropdown-1", "dropdown-2"]
            }
        }
    ]
}
<WIDGETS>
dash.layout = div([
   h5("consumer complaints"),
   div("Each week thousands of consumers' complaints "
       "about financial products are "
       "sent to companies for response.")])
<div>
<h5>consumer complaints</h5>
<div>Each week thousands of consumers' complaints
about financial products are sent to companies for response.
</div>
</div>Dash code in python
Generated HTML
dash.layout = div([
   h5("consumer complaints"),
   div("Each week thousands of consumers' complaints "
       "about financial products are "
       "sent to companies for response.",
       style={"borderLeft": "lightgrey solid"})
], id="container", className="python")
<div id="container">
<h5>consumer complaints</h5>
<div style="border-left: lightgrey solid;">
Each week thousands of consumers' complaints about financial products are sent to companies for response.
</div>
</div>Dash code in python
Generated HTML
Dropdown(
id='dropdown',
options=[
{'val': 'oranges', 'label': 'Oranges'},
{'val': 'apples', 'label': 'Apples'},
{'val': 'pineapple', 'label': 'Pineapple'}],
selected='oranges'
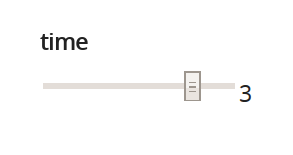
)Slider(
id='slider',
min=-5,
max=5,
step=0.2,
value=3,
label='time'
)
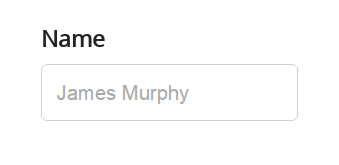
TextInput(
id='textinput',
label='Name',
placeholder='James Murphy'
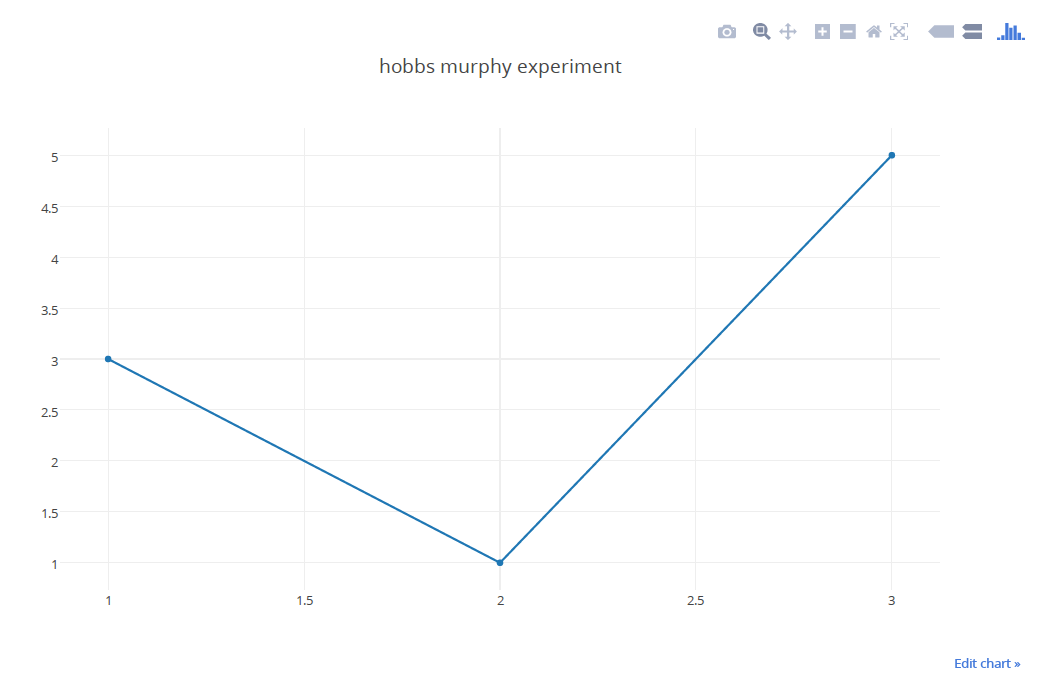
)PlotlyGraph(
id='graph',
figure={
'layout': {
'title': 'hobbs murphy experiment'},
'data': [{'y': [3, 1, 5], 'x': [1, 2, 3]}]})import pandas.io.data as web
from dash.react import Dash
from dash.components import (div, h2, label,
PlotlyGraph, Dropdown)
from datetime import datetime as dt
df = web.DataReader(
"aapl", 'yahoo',
dt(2007, 10, 1), dt(2009, 4, 1))
dash = Dash(__name__)

dash.layout = div([
    h2('hello dash'),
    div([
        label('select y data'),
        Dropdown(id='ydata', options=[{'val': c, 'label': c}
                                      for c in df.columns])
    ]),
    PlotlyGraph(id='graph')
])@dash.react('graph', ['ydata'])
def update_graph(ydata_dropdown):
return {
'figure': {
'data': [{
'x': df.index,
'y': df[ydata_dropdown.selected],
'mode': 'markers'
}],
'layout': {
'yaxis': {'title': ydata_dropdown.selected},
'margin': {'t': 0}
}
}
}
if __name__ == '__main__':
dash.server.run(port=8080, debug=True)<GRAPHICS>
Two types of requests are made:
Initialization
`GET /initialization`
Retrieve the "`layout`" JSON that describes the application
Component Updating
`POST /component-update`
When a component changes state and has dependent components, make a request to the server with the new state of that component and retrieve a response containing the desired state of the dependent components.
{
    type: "div",
    children: [
        {
            type: "dropdown",
            props: {
                id: "dropdown-1",
                value: "oranges",
                options: [
                    {label: "Apples", value: "apples"},
                    {label: "Oranges", value: "oranges"}
                ]
            }
        },
        {
            type: "PlotlyGraph",
            props: {
                id: "my-graph",
                figure: {...}
            },
            dependencies: ["dropdown-1"]
        },
        {
            type: "p",
            id: "caption",
            children: "selected value of the dropdown is 'oranges'",
            dependencies: ["dropdown-1"]
        }
    ]
}{
id: "dropdown-1",
oldProps: {
value: "apples",
options: [
{label: "Apples", value: "apples"},
{label: "Oranges", value: "oranges"}
]
},
newProps: {
value: "oranges",
options: [
{label: "Apples", value: "apples"},
{label: "Oranges", value: "oranges"}
]}}When "dropdown-1" changes, this request is made:
Example response
[{
    id: "my-graph",
    props: {
        figure: {
            layout: {...},
            data: [...]
      }}},{
        id: "caption",
        children: "new value of the dropdown is 'apples'"
    }
]The front-end implementation is responsible for:
rendering the components specified from the `layout`
providing HTTP request trigger actions into components's `onChange` handlers (for the components that have dependents)
providing `resize`, `rearrange`, `delete`, and `edit` actions to components that will appropriately update the app's component tree and state
The front-end doesn't actually contain any presentational components.
// index.js
import Renderer from 'dash-renderer'
import xhr from 'xhr'

const layout = xhr.GET('/initialization')

<Renderer layout={layout}/>
// registry.js
import {
PlotlyGraph,
Dropdown,
Slider
} from 'dash-basic-component-suite'
module.exports = {PlotlyGraph, Dropdown, Slider};dash = Dash(__name__)
dash.layout = div([
h5('click events'),
p('click on a heatmap cell to view an x, y slice through your cursor'),
div([
PlotlyGraph(
id='yslice',
width=figy['layout']['width'], height=figy['layout']['height'],
figure=figy),
div([
PlotlyGraph(
id='heatmap', bindClick=True,
width=figmain['layout']['width'], height=figmain['layout']['height'],
figure=figmain),
], style={"display": "inline-block"}),
div([
PlotlyGraph(
id='xslice',
width=figx['layout']['width'], height=figx['layout']['height'],
figure=figx),
], style={"display": "inline-block"})
], className="row"),
div([
b('click callback'),
pre(id="event-info", style={"overflowY": "scroll"})
])
])@dash.react('event-info', ['heatmap'])
def display_graph_event_info(heatmap):
"""Display the click object in the <pre id="event-info">.
This function gets called when the user hovers over or clicks on
points in the heatmap. To assign click events to graphs, set
bindClick=True in the PlotlyGraph component.
"""
click = ''
if hasattr(heatmap, 'click'):
click = json.dumps(heatmap.click, indent=4)
return {
'content': repr(heatmap)+'\nclick: '+click
}@dash.react('xslice', ['heatmap'])
def plot_xslice(heatmap_graph):
event_data = getattr(heatmap_graph, 'click')
point = event_data['points'][0]['pointNumber']
colNumber = point[0]
trace = heatmap_graph.figure['data'][0]
column = [zi[colNumber] for zi in trace['z']]
y = trace.get('y', range(len(trace['z'])))
return {
'figure': {
'data': [{
'x': column,
'y': y
}],
'layout': {
'margin': margin
}
}
}
You will only need to use
python to create dashboards ;
js to create components
Plotly to host its own version of NBviewer with authentication and user permissions
talk by Mart van de Ven | m@droste.hk
with contributions from Shivam Gaur | shivam@droste.hk
thank you
<APPENDIX>
By Droste


