Updating your Node.js Diagnostics Skills

Why should I care about diagnostic tools?
When there is a bug or a performance problem, you can spend considerable time chasing the issue if you are not familiar with diagnostics utilities. Those can help developers identify the root cause of any application anomaly sooner.

Diagnostic techniques and tools for
Node.js
There are plenty of tools allowing you to find anomalies in your Node.js application. The use of these tools depends mostly on the environment where you can run them. There are some included in the Node.js core, and there are others provided by the Node.js ecosystem.

At a Development environment

PRINTING DEBUGGING INFORMATION

When developing, the most straightforward but dirtiest way is to use a `console.log()` to print a message to display helpful info.
app.get((req, res) => {
   const rand = Math.round(Math.random() * (3000 - 1000)) + 1000
   console.log(`Response will be sent in ${rand} miliseconds`)
   setTimeout(() => {
     res.send('ok')
   }, rand)
 })
PRINTING DEBUGGING INFORMATION

A permanent and better approach is to use util.debuglog or debug:
 app.get((req, res) => {
  const rand = Math.round(Math.random() * (3000 - 1000)) + 1000
  debug(`Response will be sent in ${rand} miliseconds`)
  setTimeout(() => {
    res.send('ok')
  }, rand)
})
Analyzing program's flow

If you need to check your program flow, use node.js inspector:
$ node --inspect index.js
$ node --inspect-brk index.js
Or if you use VS Code, use the debugger
Debugging Node.js core operations

Use the environment variables `NODE_DEBUG` for JavaScript logging and `NODE_DEBUG_NATIVE` for C++ logging
$ NODE_DEBUG=http node index.jsDiagnosing the future of your application

To identify better warnings for your program and possible existing problems with your code:
$ node --trace-warnings index.jsTo see any deprecations, code that will stop working eventually:
$ node --trace-deprecation index.js
$ node --throw-deprecation index.js
Trace more potential issues in your app

To see any potential I/O operations blocking your event loop, this could cause bad performance later when in production:
$ node --trace-sync-io index.jsDebug an application exiting silently:
$ node --trace-exit index.jsCapturing diagnostics reports

The report is intended for development, test, and production use, to capture and preserve information for problem determination.
It includes JavaScript and native stack traces, heap statistics, platform information, resource usage, etc.
$ node --report-on-fatalerror index.js
$ node --report-uncaught-exception index.js
$ node --report-on-signal index.js
$ node --report-signal=SIGINT index.js
At a staging or pre-production environment
What should I BE doing on staging?
Before taking your code to production, it is recommended to analyze its performance. It is essential to study the resources consumption, speed of your application, and edge cases. To do that, basically, you explore aspects like:
-
Time expended by your application to serve the user's request
-
Memory consumption of your application while being executed
-
Possible edge cases, odd behaviors, and crashes

Load test your application pre-production
Load testing is performed to determine a system's behavior under both normal and anticipated peak load conditions. It helps to identify the maximum operating capacity of an application as well as any bottlenecks and determine which element is causing degradation.
Here are some tools to help you with the task:

CPU Profiling or analyzing how much time you expend
It is recommended to analyze how much time your application takes to perform the operations needed to provide your users' output. That's possible thanks to a profiler, which is a tool that allows you to measure the time taken by any individual operation executed in your program.
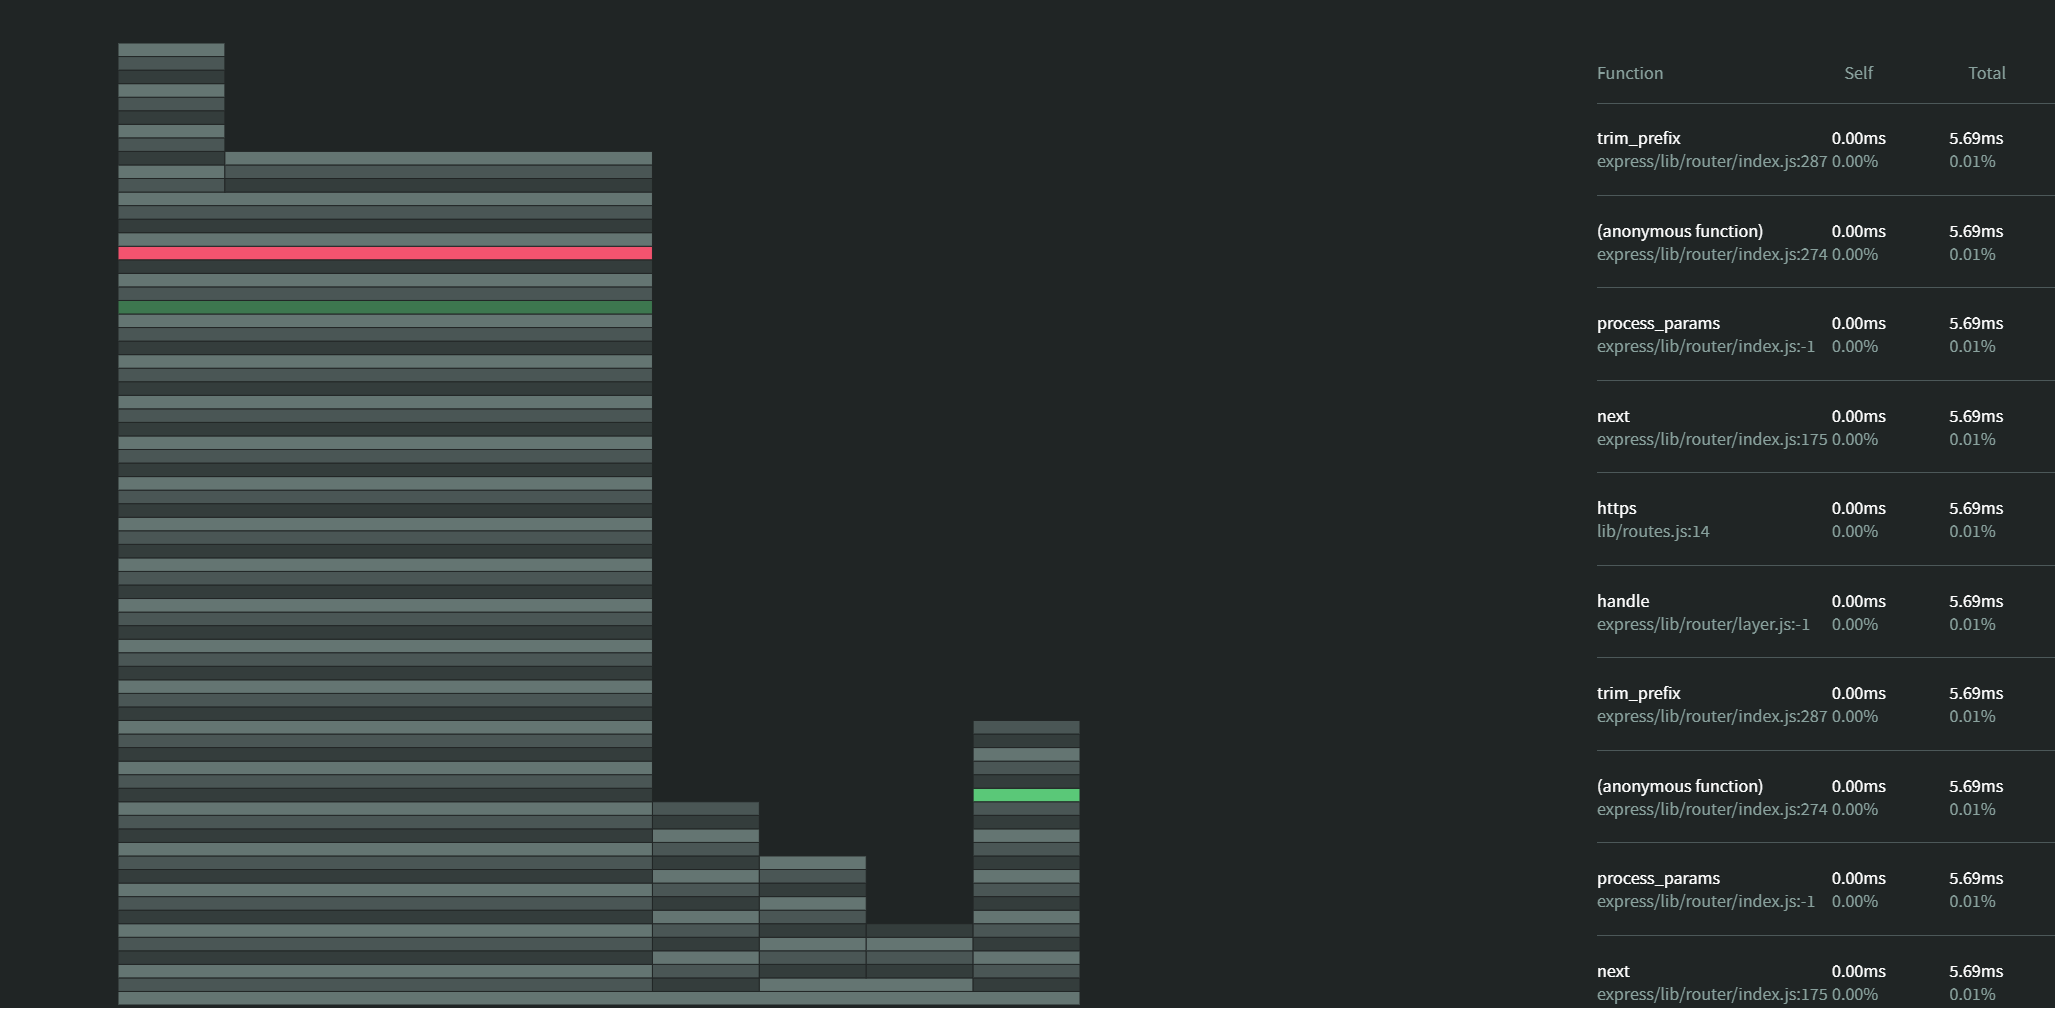
The profiler's result could be just a bunch of text-mode measures, making it harder to analyze. The suggested way is to use a graphic representation. The most common is the flame graph outlining the CPU operations.

Flame graphs


Understanding a flame graph

The Flame Graph visualization shows the time along the x-axis. The y-axis is used to indicate the function calls that make up a particular stack trace, which eases identifying where your program is mostly expending the time and help to diagnose bottlenecks. The wider a rectangle, is more time being used by the operation it belongs to.
Heap snapshotting or analyzing the memory used

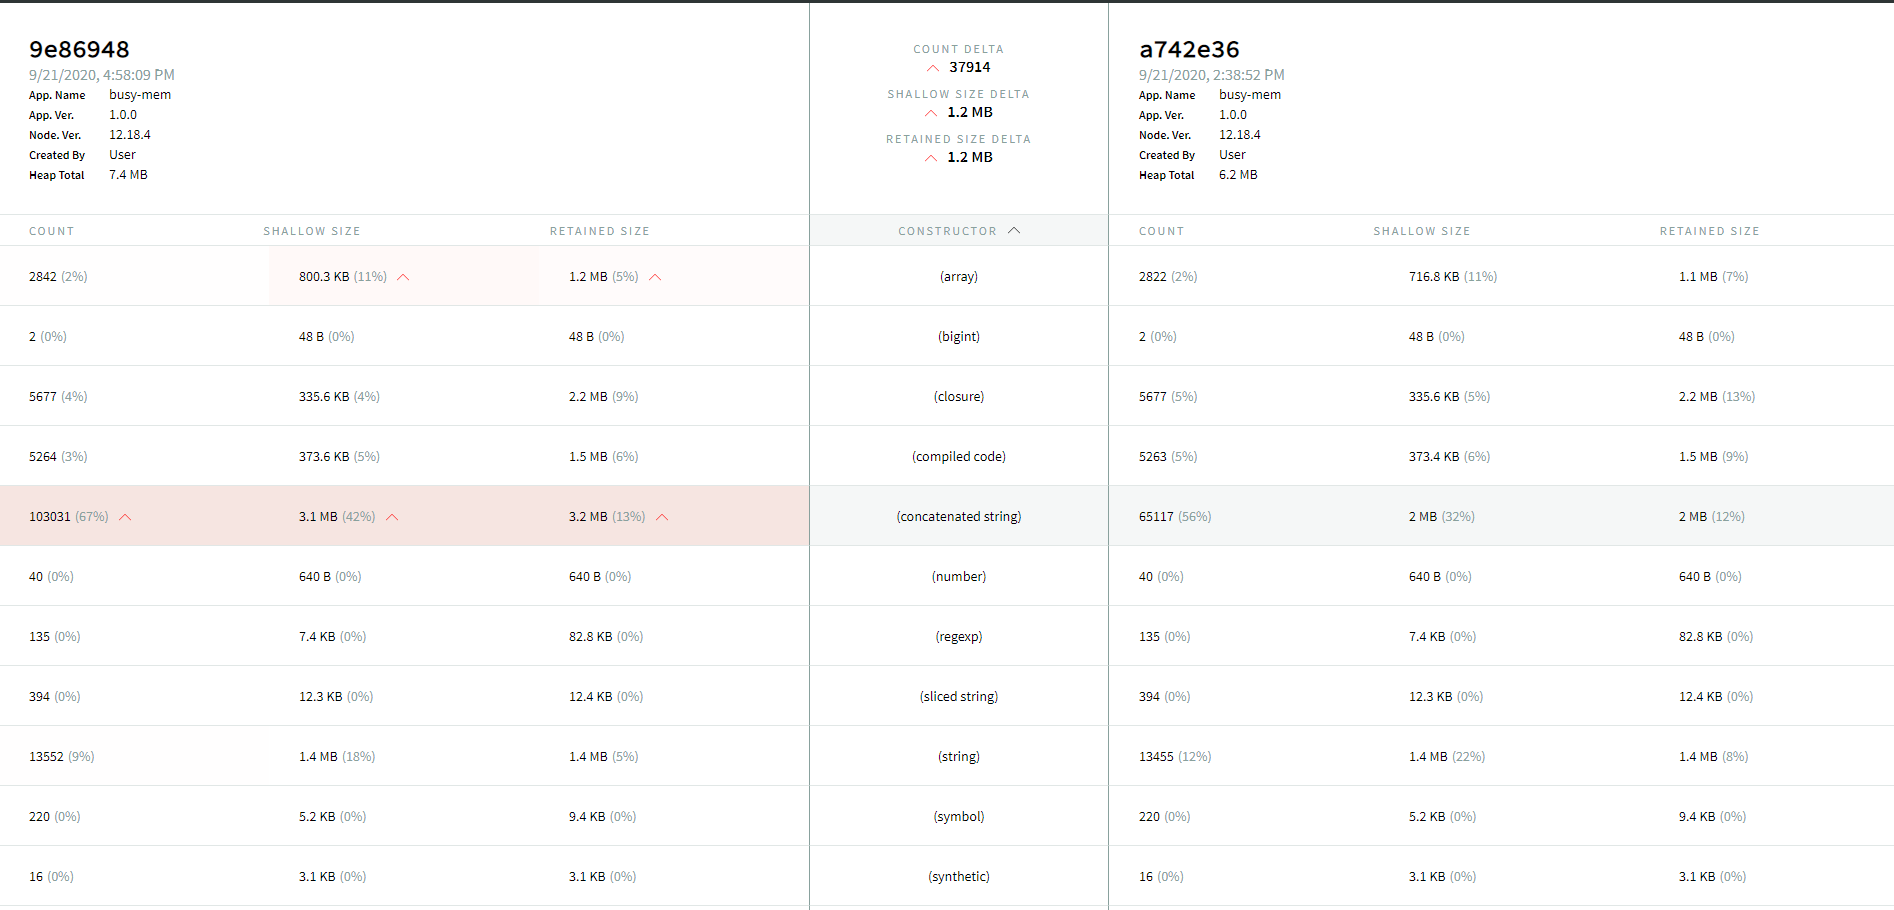
Heap Snapshots capture a record of all live JavaScript objects in your Node.js application available when the snapshot is captured. The objects are grouped by their constructor name, with aggregated counts of the total number of objects, their shallow size (memory held by the object itself), and their retained size (memory that is freed when the object itself is deleted along with its dependent objects)
Comparing heap snapshots to analyze
memory


Tracing events to analyze the execution

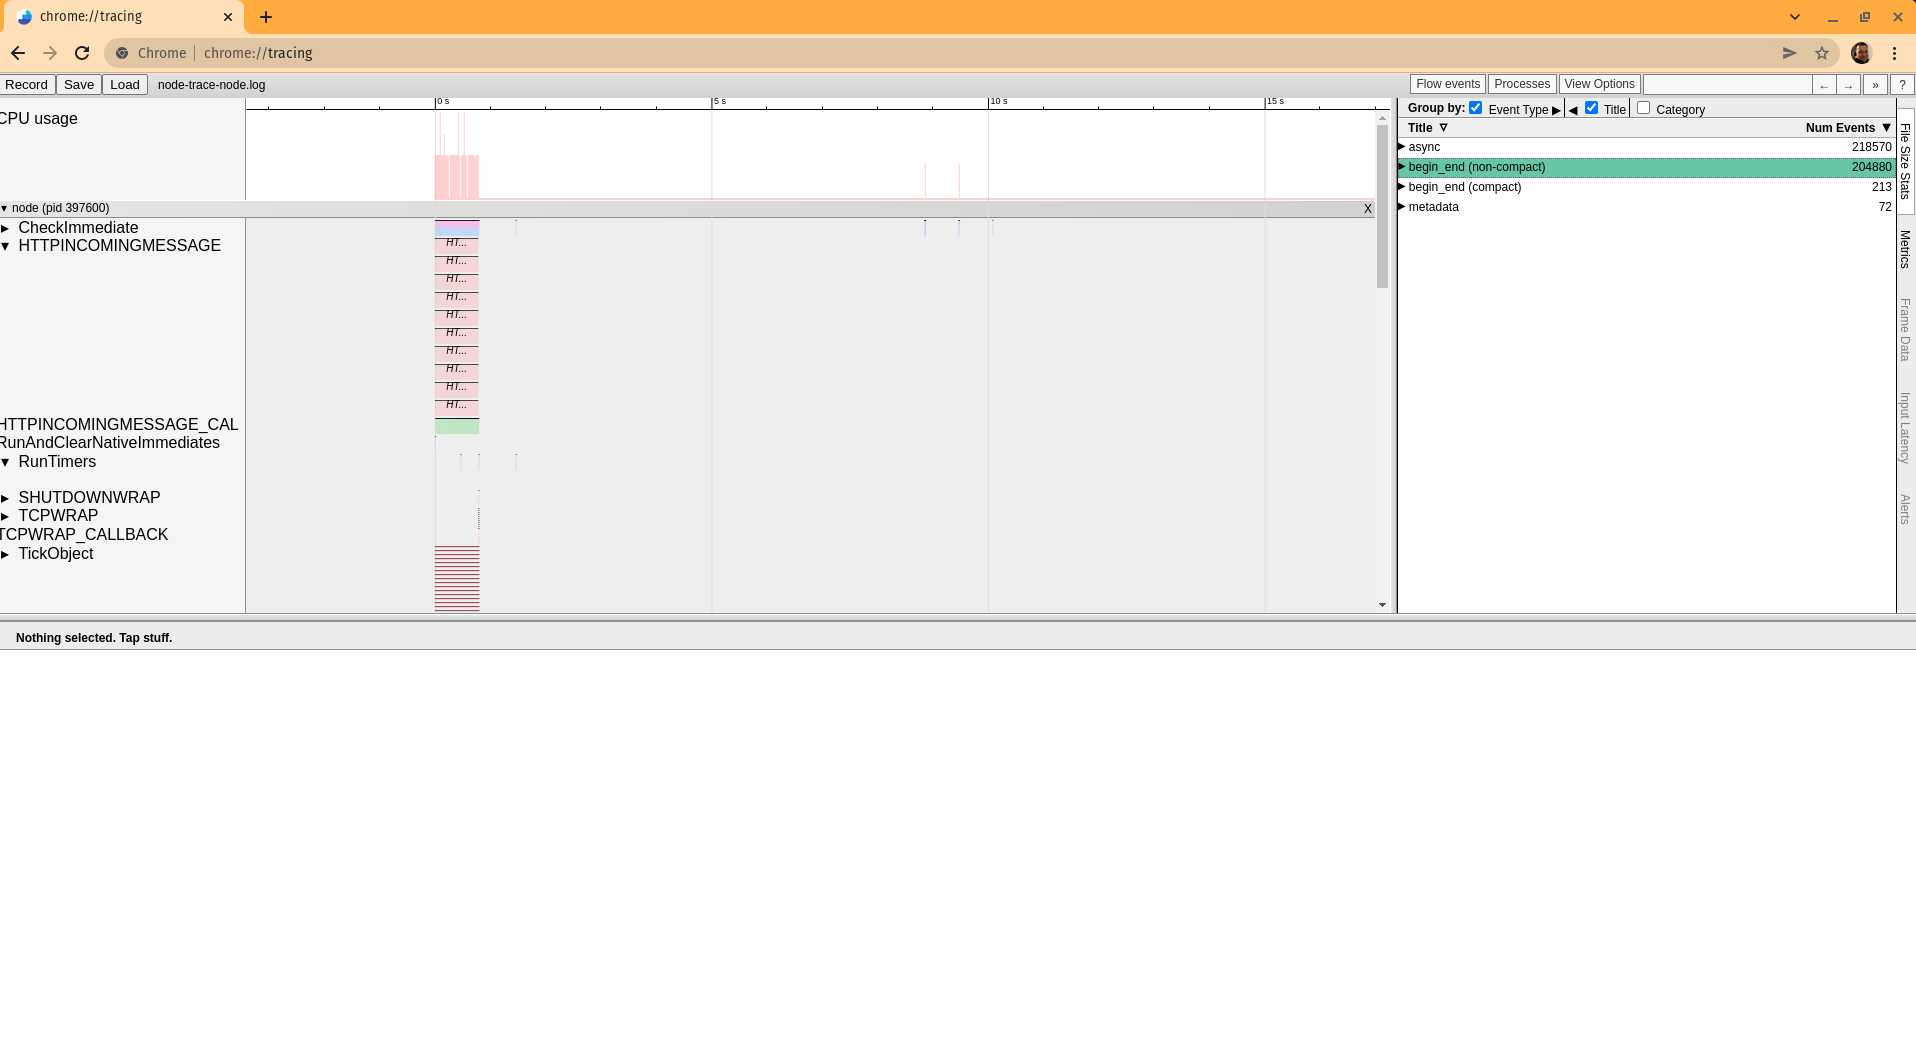
The Trace Event provides a mechanism to centralize tracing information generated by V8, Node.js core, and userspace code; basically, it records all the events in the execution.
We can capture the information of the specified events categories in the execution of every iteration of the test explained above. to accomplish that, we will execute the script for the regular baseline Node.js script like this
$ node --trace-event-categories=v8,node,node.async_hooks index.jsTracing events to analyze the execution


Capturing performance assets
pre-production
These tools are mean to be used in local environments and not be used in production to capture and see performance assets:

At the production environment
What should I Do in production?
The main problem at production is that previous techniques and tools mentioned before are not suitable or impact the program performance, reaching the paradox that analyzing the performance affects the performance itself.
Another aspect is that you can not usually predict all scenarios your application will be used or the load you will receive, so you should monitor the situation.

Some existing Monitoring options
There are some tools providing info, metrics, and monitoring your application in production environments, usually APMs like:
These platforms are primarily designed to provide general information and not Node.js specific information and can not generate performance assets and beware; you will lose performance

Capturing performance assets in production
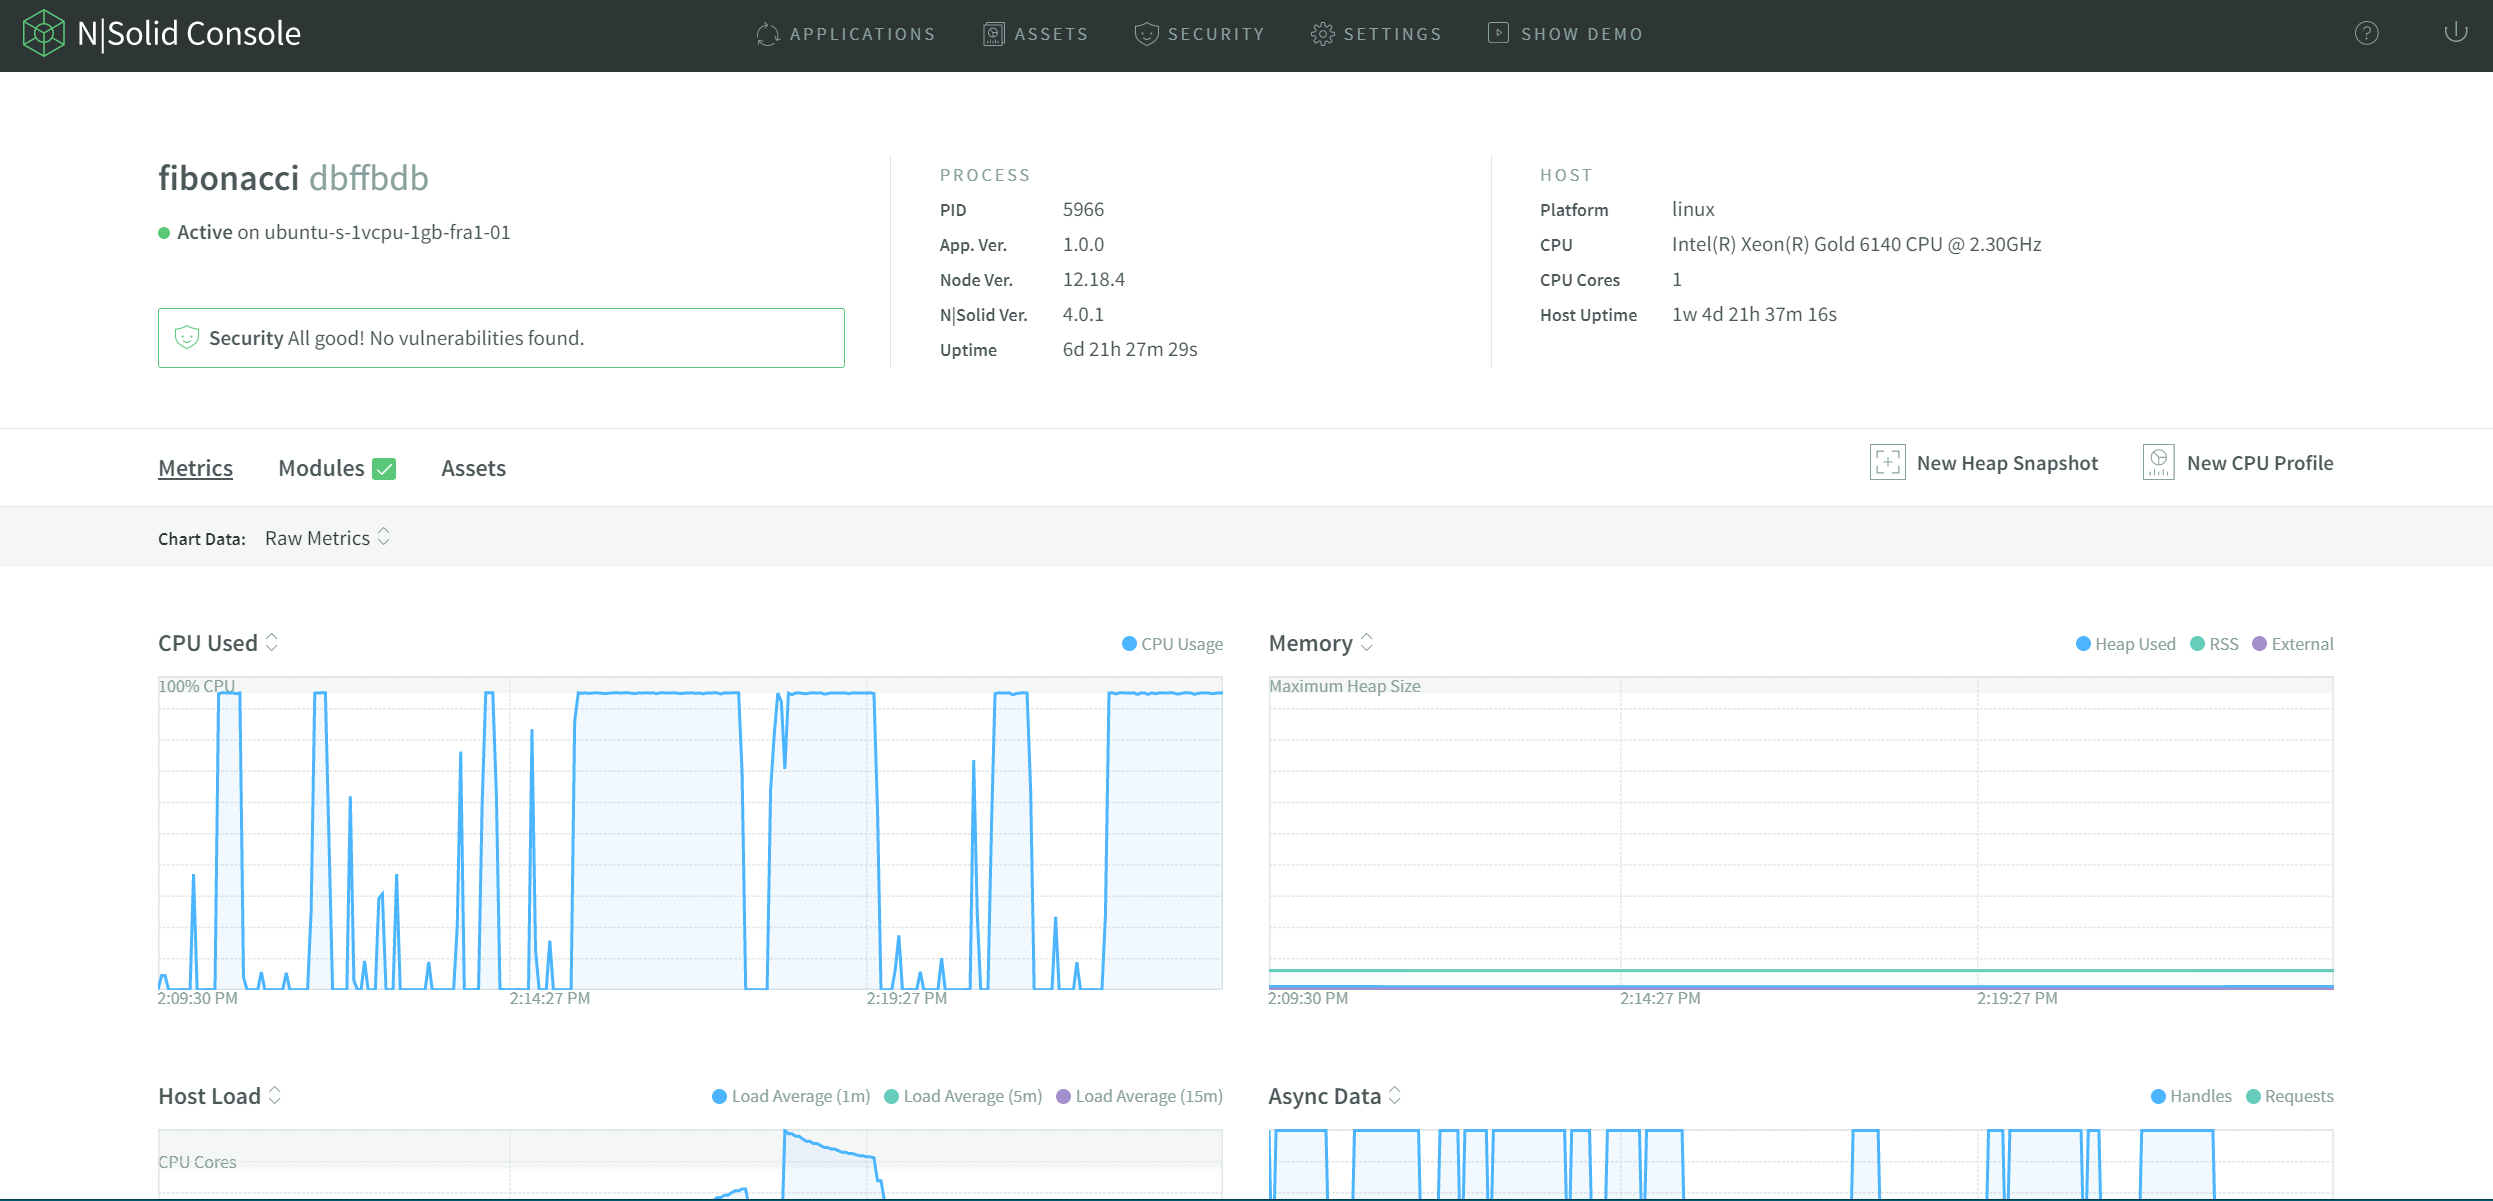
There is a tool specialized in Node.js metrics and custom Node.js monitoring, allowing you to capture performance assets at will or automatically to analyze in production without a considerable performance overhead

Capturing performance assets in production


Thanks

Updating your Node.js Diagnostics Skills
By Adrián Estrada
Updating your Node.js Diagnostics Skills
- 1,310


