Anomaly detection in the CERN LHC
T. Dewitte, E. Van Wolputte, W. Meert et al. (KU Leuven, DTAI)
P. Van Trappen, M.J. Barnes (CERN TE/ABT)


Outline
- Project motivation
- Software tools
- Anomaly Detection Pipeline
- Conclusions
- Outlook: MERCS
1. Project Motivation
- Collaboration between KU Leuven and CERN.
- KUL provides ML expertise and master student supervision
- CERN provides the problem, data and machine expertise.
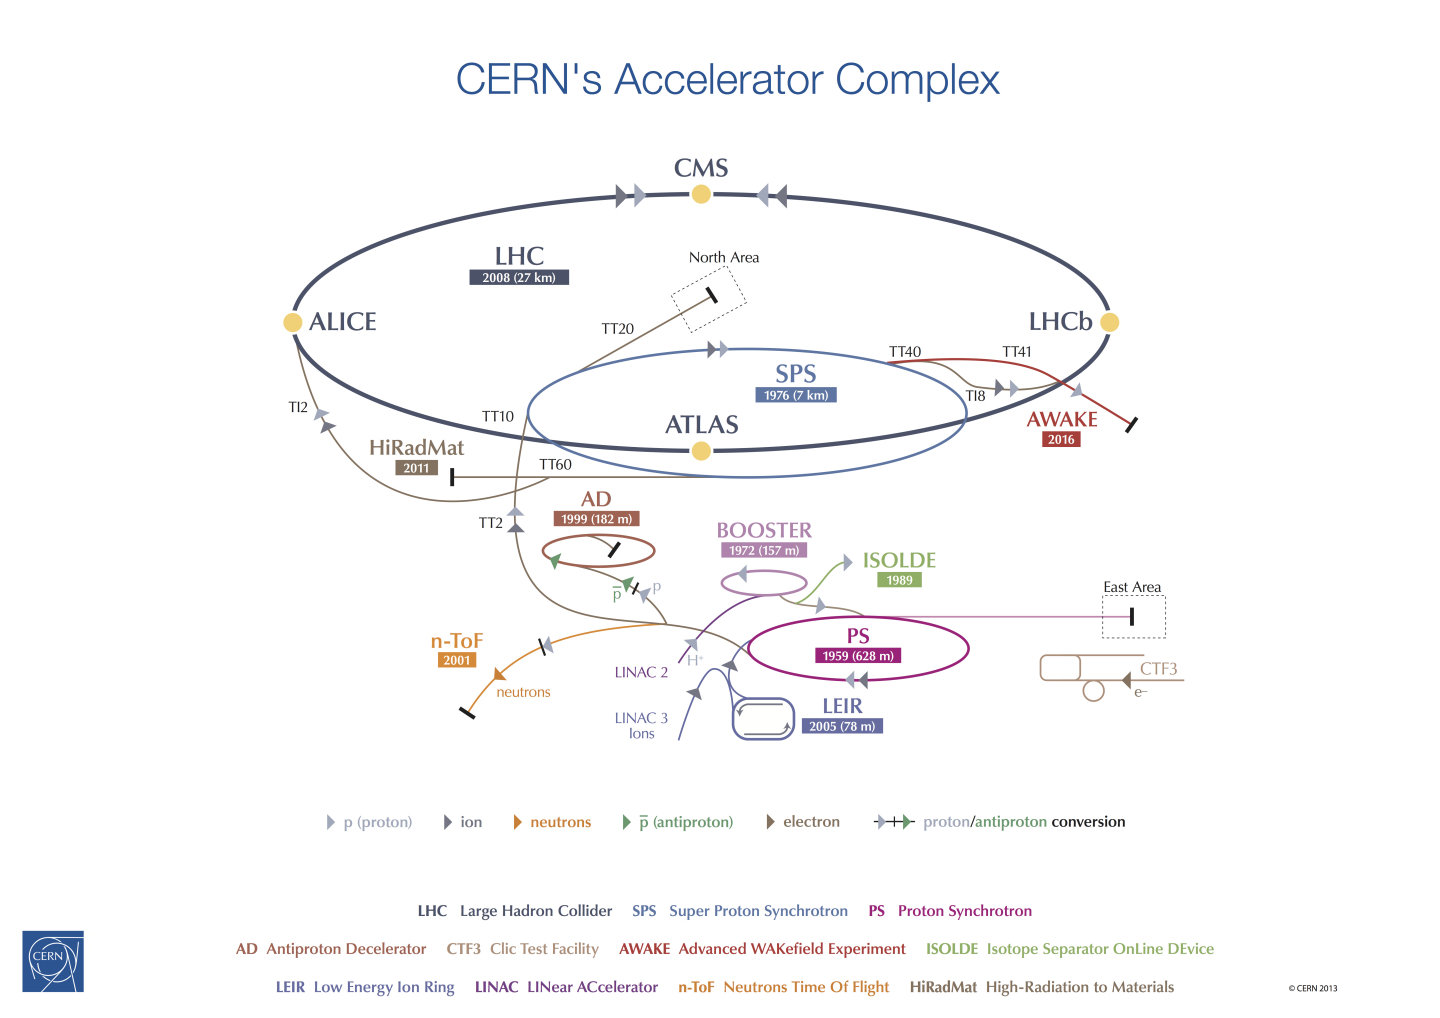
- Background: CERN LHC
- Last stage in CERN accelerator complex
- Particles are accelerated in stages
- Kicker Magnets (MKI) switch particles from one accelerator to the next
- Can we detect anomalies in those beam transfer installations?
1. Project Motivation
Background: CERN LHC
1. Project Motivation
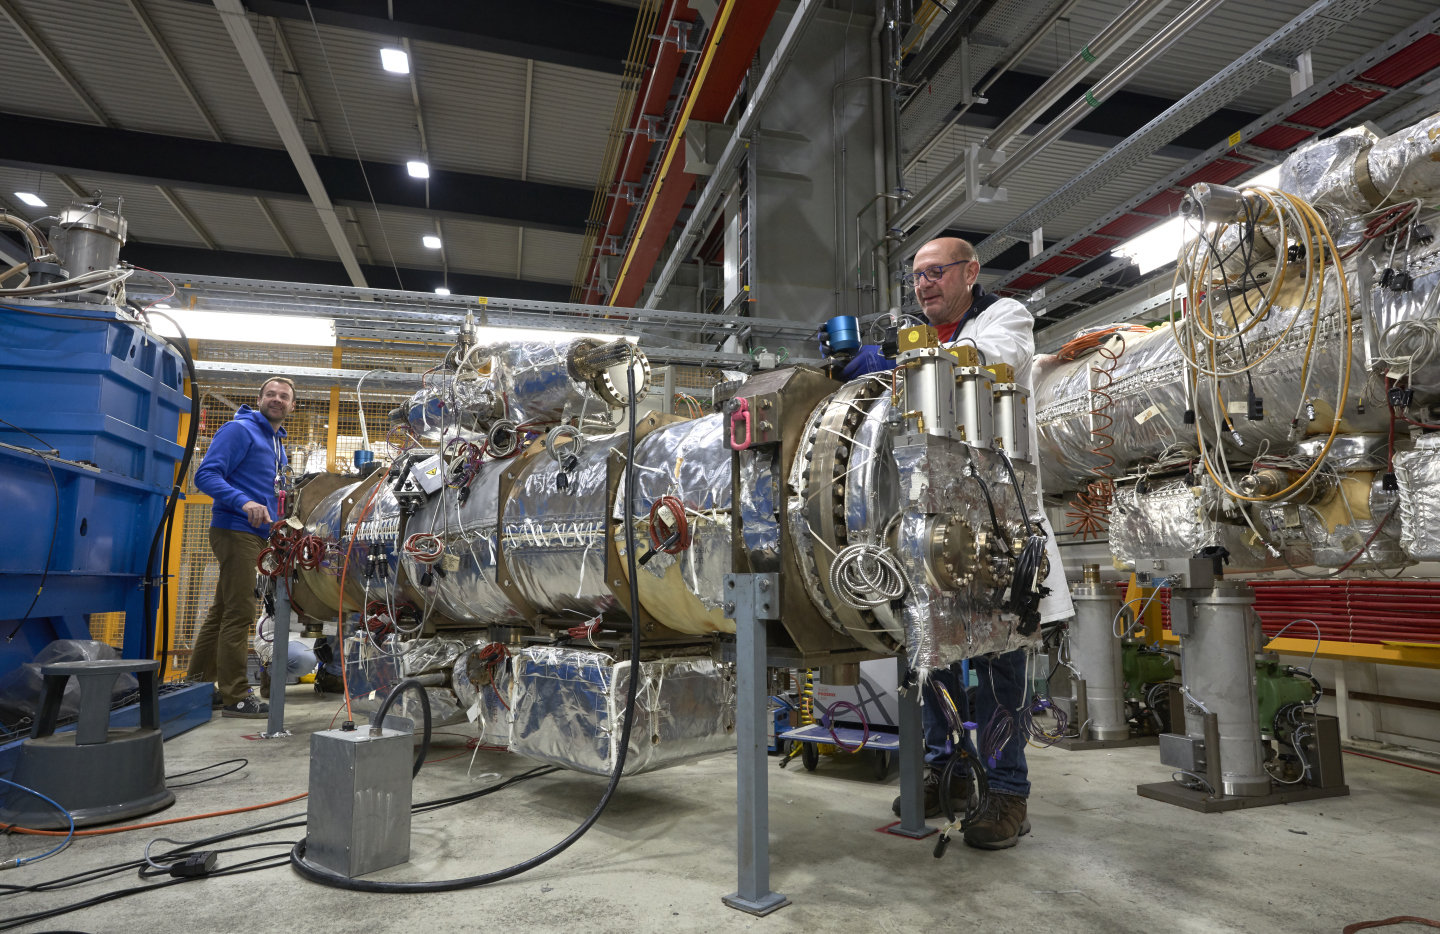
Background: Kicker Magnets
1. Project Motivation
Problem Statement
Vast amounts of sensor data (e.g. pressure, temperature,
voltage, current, calculated metrics, beam parameters) result in;
- Many measurements without thresholds for alarms generation
- Time-consuming manual analysis after fault occurrence, to understand anomalous behavior
- Equipment interlocks (i.e. machine downtime) that could have been prevented!
Question: Can Machine Learning help?
Goal: Build an unsupervised anomaly detector, based on historical data.
2. Software Tools
Tools used so far
- CALS logging database (in-house CERN system)
- Extraction
- MongoDB
- Gitlab LFS
- Pandas
- Scikit-learn
- Jupyter Notebooks
- Plotly + Dash
2. Software Tools
Tools to be used in future
- NXCALS logging database (new CERN system)
- Apache Spark
- ML-Lib
Why?
- Immediate access to logging data
- Online testing of our anomaly detector
- Everything (data, code, compute) on-site at CERN
3. Anomaly Detection Pipeline
- Modular framework; allows easier modifications
- Grid-search over educated guesses made along the way. E.g.:
- Sensor thresholds
- Hyperparameters

- Data: 8 MKI installations in the LHC.
MKI = Injection kicker magnet pulse generators (4/beam) - Focused on 18-month time span (Mar. '16 -> Sep. '17) with some well-understood anomalies
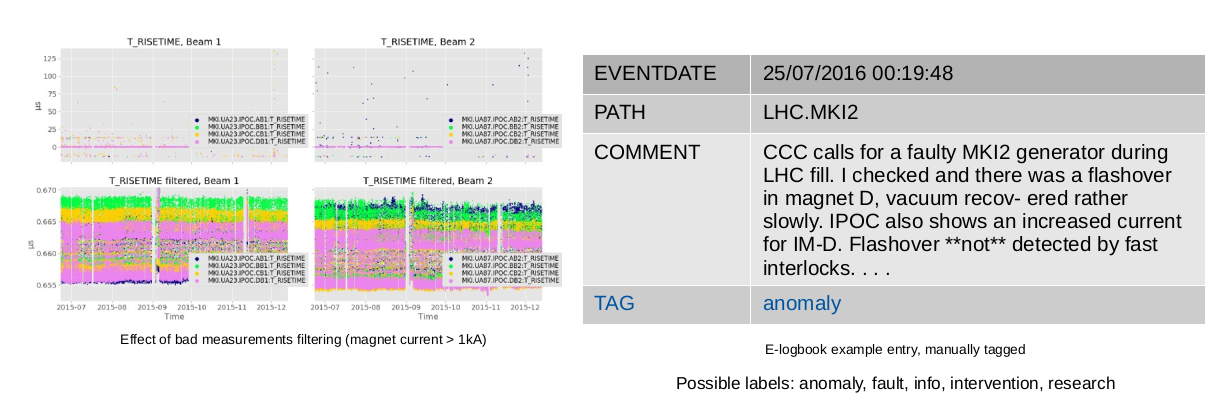
- Applied techniques: removal of bad measurements (hard-coded thresholds), data interpolation, resampling
- Feature selection and generation. Sliding windows to capture temporal information. Adding frequency-based features.
3. Anomaly Detection Pipeline
3. Anomaly Detection Pipeline
logbook-01 - lorum ispsum - logbook-02 - logbook-01 - lorum ispsum - logbook-02 -logbook-01 - lorum ispsum - logbook-02 -logbook-01 - lorum ispsum - logbook-02 -logbook-01 - lorum ispsum - logbook-02
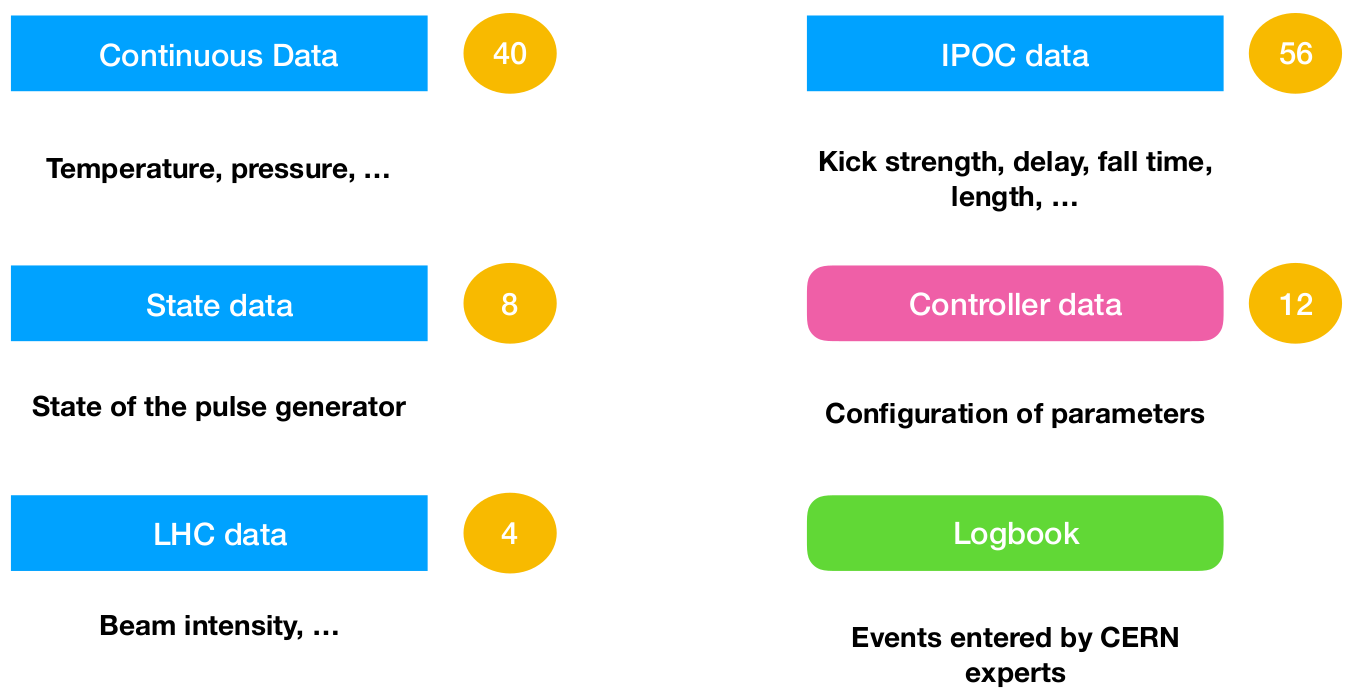
Cont. data
On-event data
Discrete data (state)
Unstructured logbook
data
Messy data
3. Anomaly Detection Pipeline
Messy data to feature vector
The on-event data (IPOC) is asynchronous with the rest of our data. We regard this as our 'clock' and look at the readings for the other data points at those timestamps.
In this way, we build a feature vector.
t_1
3. Anomaly Detection Pipeline
Messy data to feature vector + sliding windows
Sliding window features aim to put some temporal information in the feature vector.
E.g., average, deviation from average, maximum value etc.
t_1-\tau
t_1+\tau
3. Anomaly Detection Pipeline
3. Anomaly Detection Pipeline
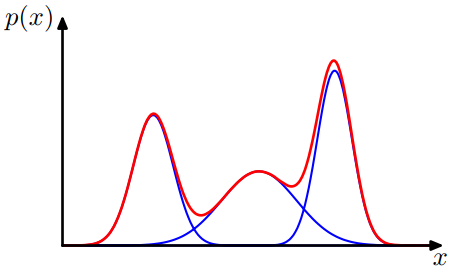
Gaussian Mixture Models
- Fit all data to a finite mixture of Gaussian distributions with unknown parameters.
- A datapoint with a low probability of belonging to these distributions, is anomalous
- Good scalability
- Number of Gaussian components hard to determine
3. Anomaly Detection Pipeline
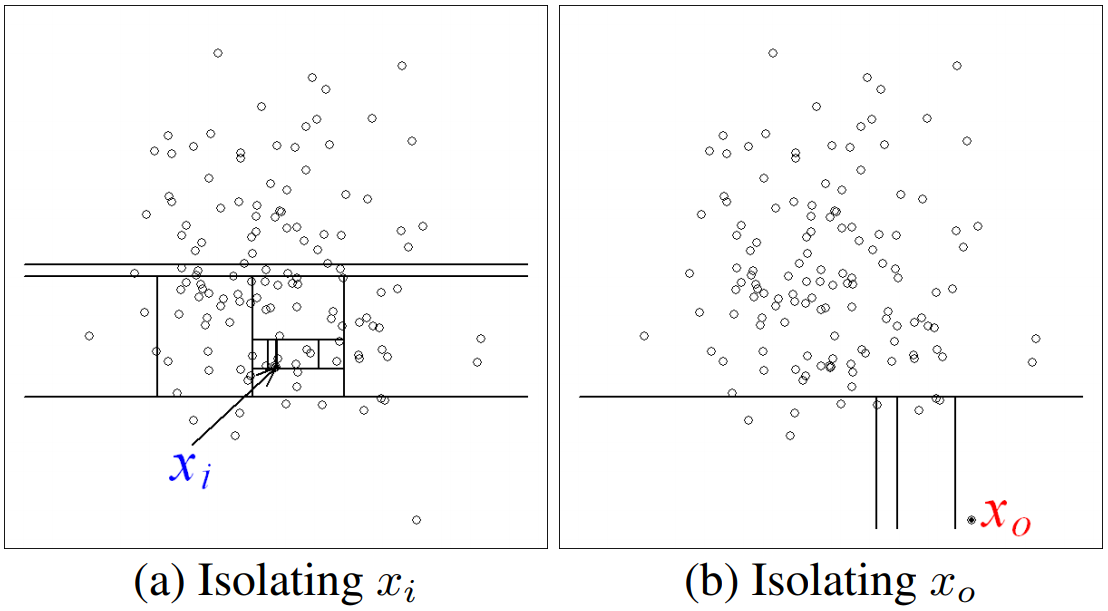
Isolation Forests
- Learn an ensemble of isolation trees, i.e. a random tree structure which aims to isolate individual points.
- Anomalous points will be in leaf nodes with a shorter average path length to the root node.
- Performs well in high-dimensional problems
- Some interpretability through feature importance
3. Anomaly Detection Pipeline
Post-Processing: Need for segmentation
- A single anomaly will have several anomalous datapoints
- Group the datapoints into real-world segments, which represents a period in time in which an anomaly might happen (LHC injection period)
- A ground truth is assigned to each segment, based on manually labelled CERN e-logbook entries (-12h timeframe)
- Initially by applying a complex segmentation algorithm, now we use a controller variable, yielding exact operational segments
(assumption: max. one anomaly/segment)
3. Anomaly Detection Pipeline
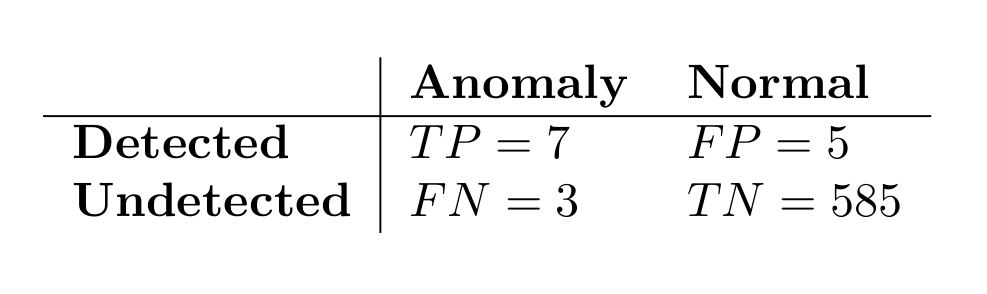
Evaluation: How to measure success?
- The anomaly detectors (GMM, IF) are trained without labels.
Try to model `normal' behavior. -
Evaluation happens with labels!
Labels are incomplete and noisy. - Top-\(k\) score of individual points score a segment
- Grid-search over parameters we introduced in our pipeline, to determine good combinations
- We use the area under the Precision-Recall curve as a metric during grid search.
3. Anomaly Detection Pipeline
Outcomes in a 3 month period
Not that false!
Impossible to detect
3. Anomaly Detection Pipeline
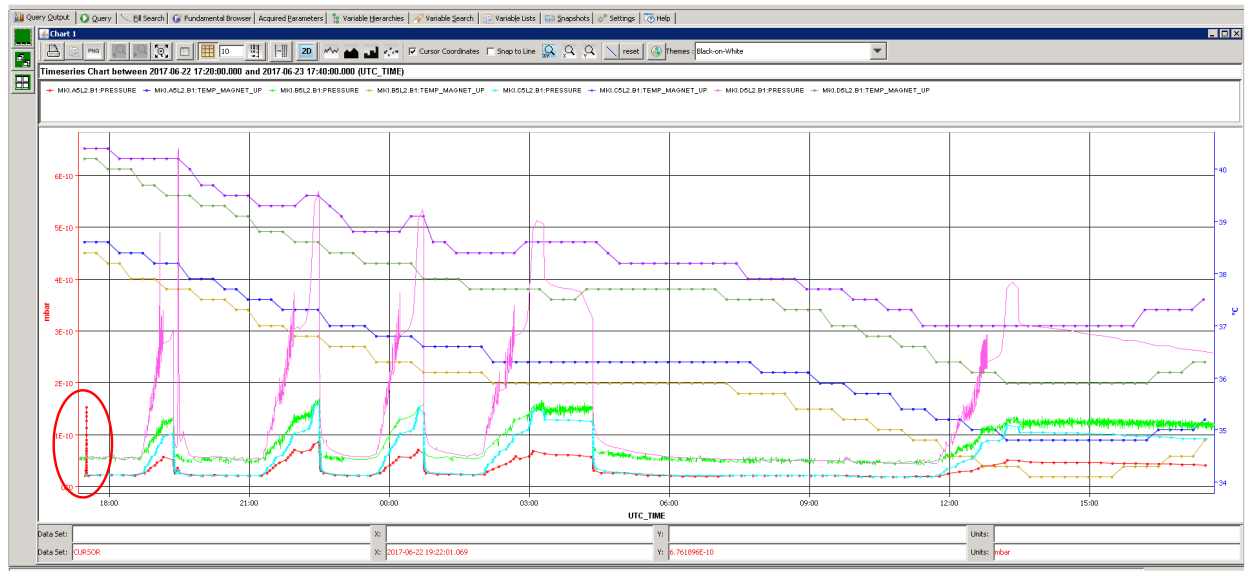
Example of 'false' positive
Innocent pressure spike, but nevertheless interesting to detect!
3. Anomaly Detection Pipeline
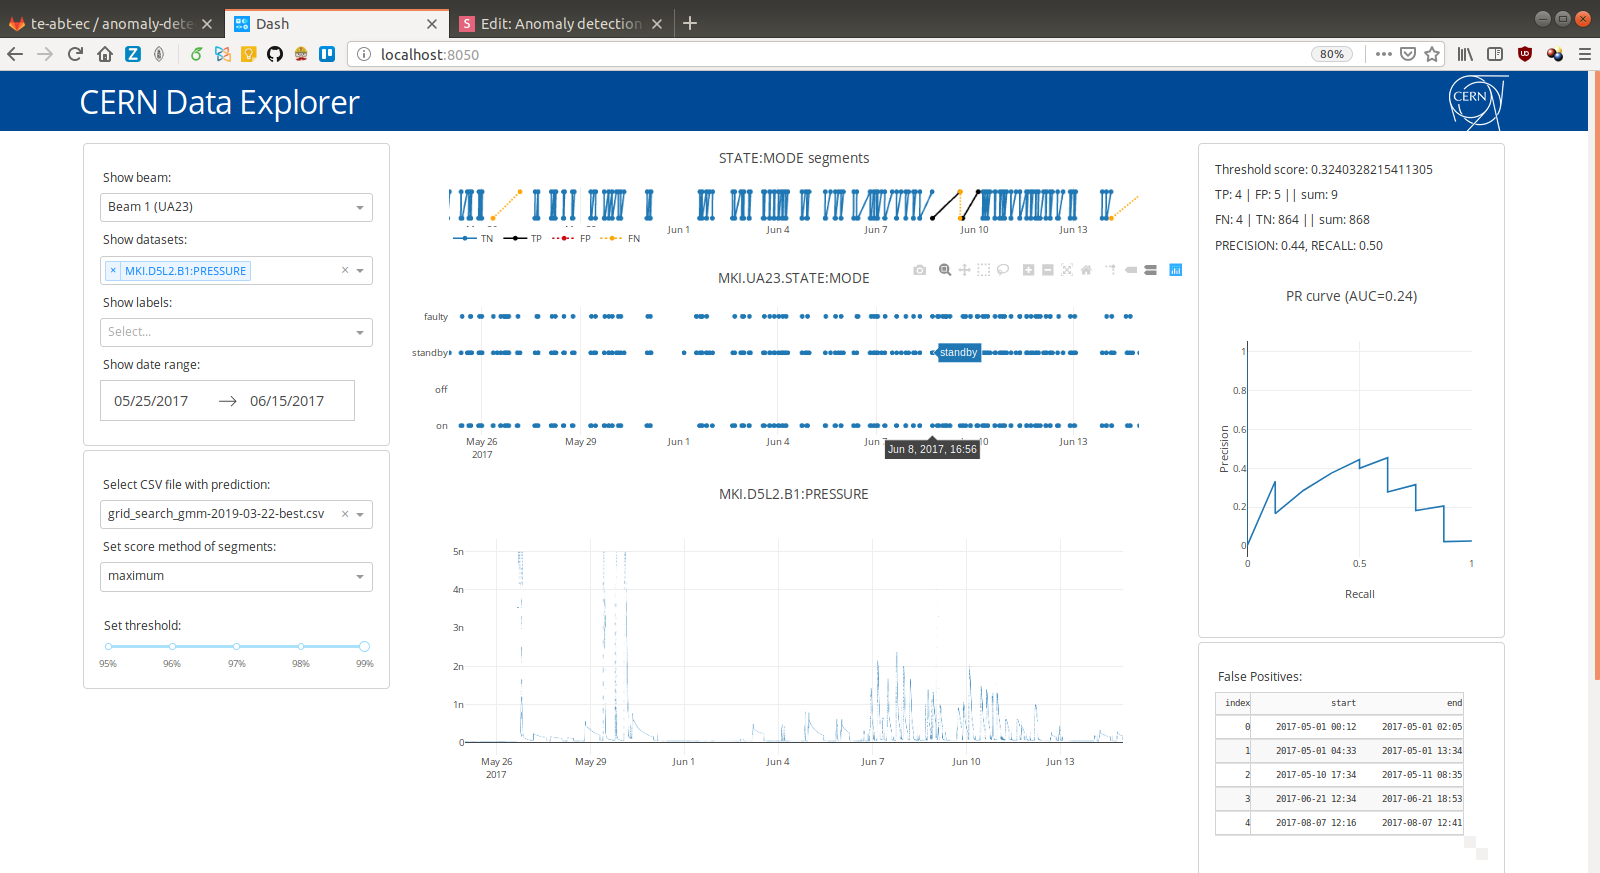
Visualization
- Communication of findings to domain experts is critical to discover bugs in the pipeline
- Easy visualization is first step towards interpretation of our results
- We built a small interactive browser app
(Plotly & Dash)
3. Anomaly Detection Pipeline
3. Anomaly Detection Pipeline
4. Conclusions
- Cooperation with domain experts is crucial
- Many educated guesses along the pipeline turned out to be more influential than the actual choice of ML-model involved
-
Small insights can lead to big performance gains
- E.g., after the domain experts knew the segmentation was giving us headaches, they were able to obtain extra data which allowed for semantically meaningful segments
- E.g., one particular false negative revealed that a preprocessing filter was too strict
5. Outlook
- Expand to bigger timeframes, verify generalization
- Extensive feature selection (reduce dimensionality)
- 'Real-time' system
- Automatically separate interesting from non-interesting false positives (clustering)
- Can we reach similar performances with an in-house anomaly detector? (MERCS)
An anomaly detector based on many predictive functions.
Detection of an anomaly is only step one,
ideally we can understand, and ultimately prevent anomalies
If otherwise decent predictive functions suddenly start failing, this indicates unseen behavior, and therefore an anomaly.
WHY?
WHAT?
HOW?
5. MERCS
- Introduction
- Outcomes so far
- Anomaly Detection with MERCS
5. MERCS
Overview
1. Introduction
D
f:
X
\rightarrow
Y
Standard ML problem:
learn function f,
from dataset D.
5. MERCS
f_1:
X
\rightarrow
Y
Standard ML-model
1. Introduction
5. MERCS
f_1:
X
\rightarrow
Y
f_2:
X
\rightarrow
Y
f_3:
X
\rightarrow
Y
MERCS model - basic
1. Introduction
5. MERCS
f_1:
X
\rightarrow
Y
f_2:
X
\rightarrow
Y
f_3:
X
\rightarrow
Y
MERCS model - advanced
f_4:
X
\rightarrow
Y
f_5:
X
\rightarrow
Y
5. MERCS
1. Introduction
2. Outcomes
Standard ML model can solve this
Given what's the value of ?
X
Y
5. MERCS
MERCS model can solve this
Given what's the value of ?
X
Y
- You can cope with missing values
- You can switch targets
- You can switch the amount of targets
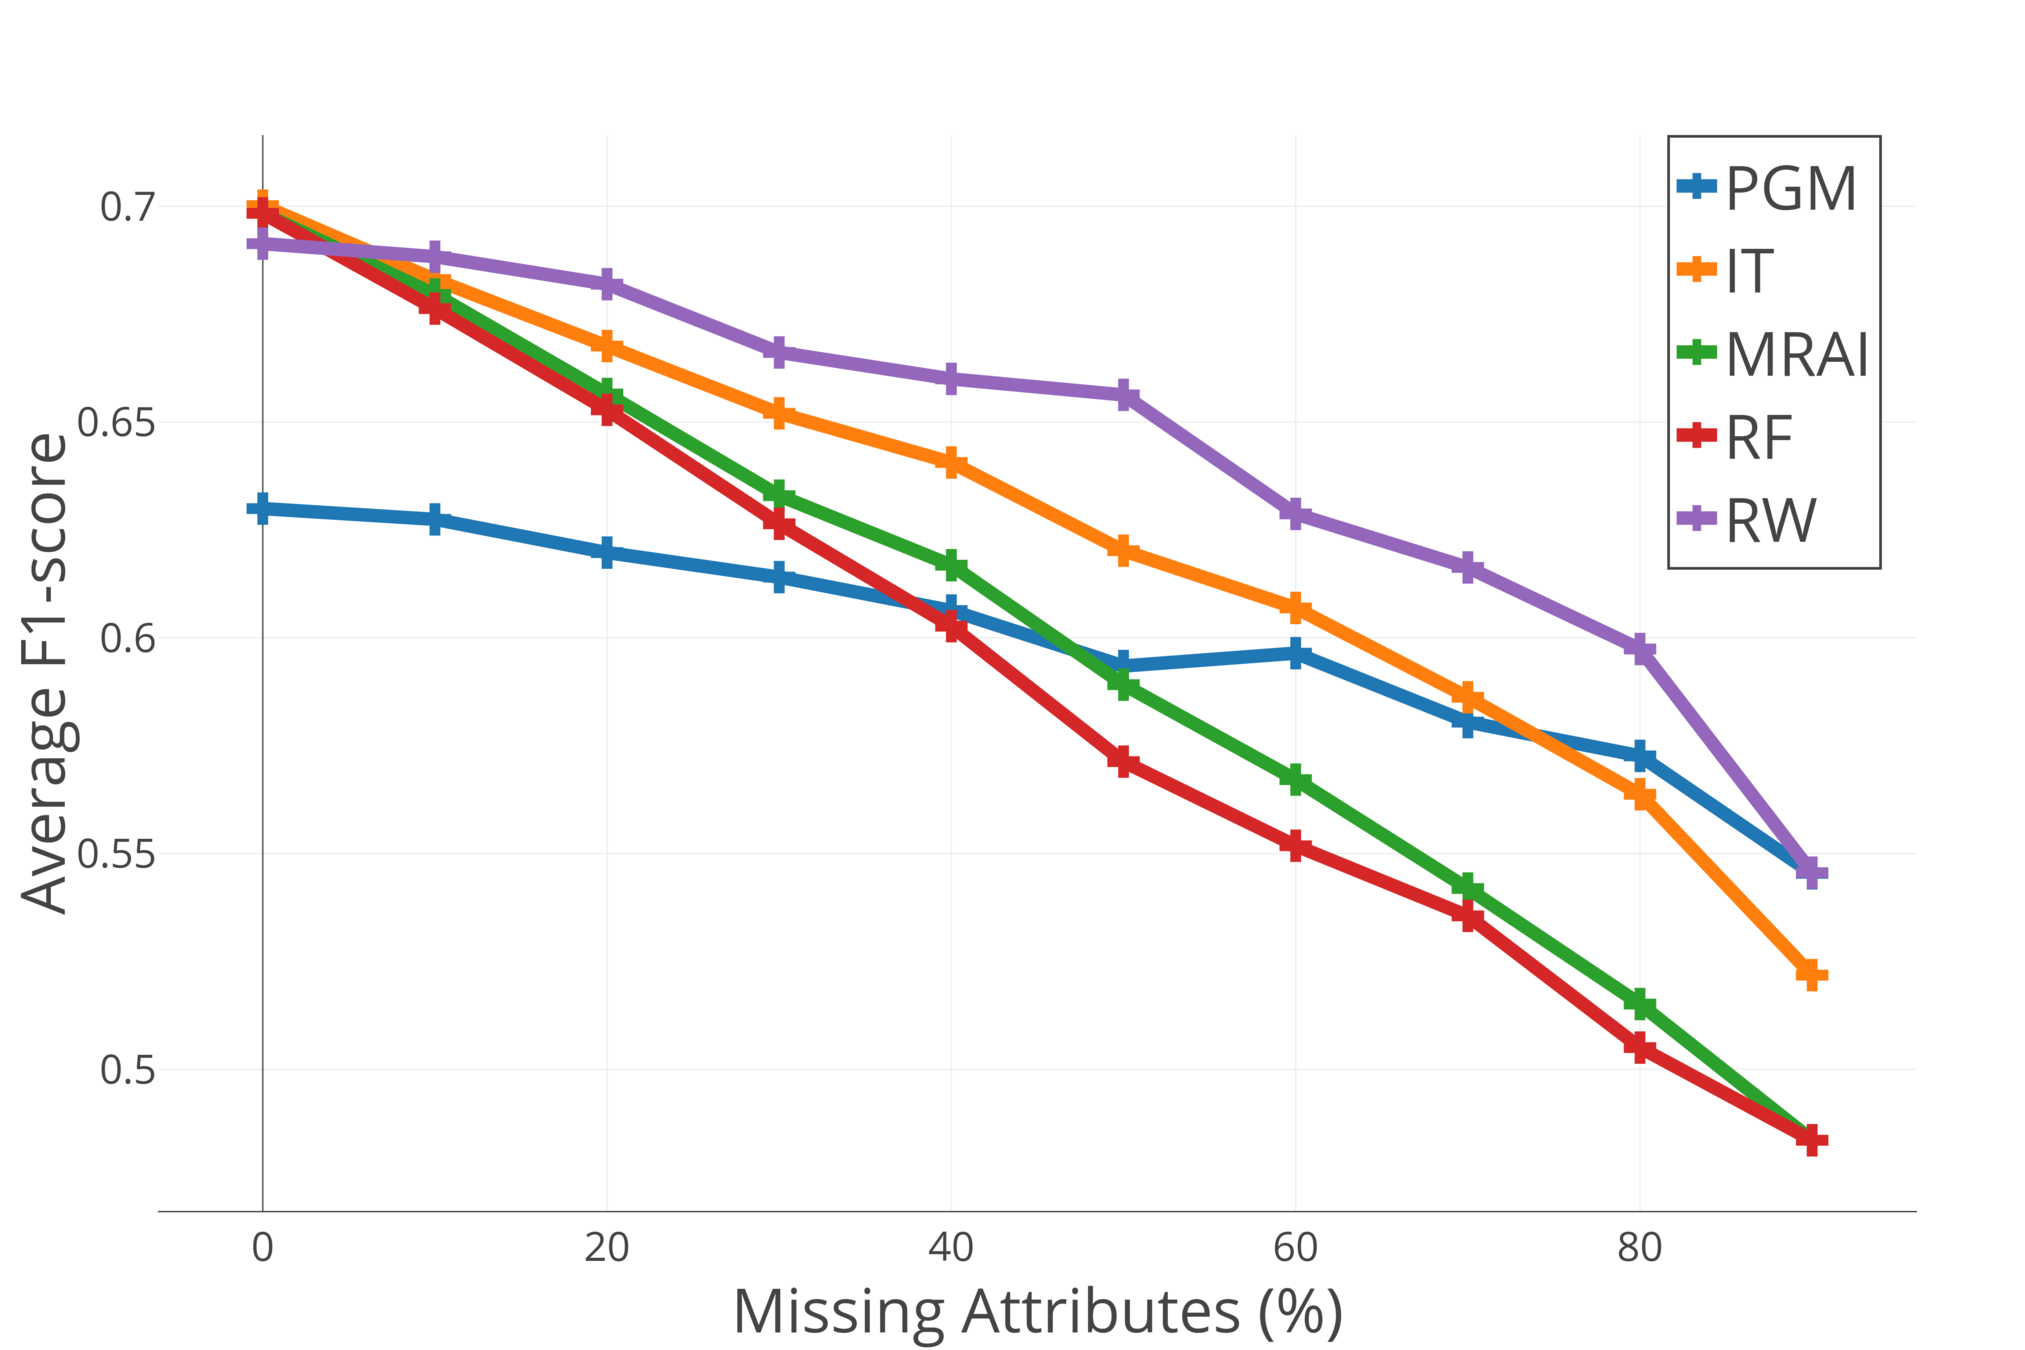
5. MERCS
2. Outcomes
5. MERCS
2. Outcomes
3. Anomaly Detection with MERCS
- Anomaly detection is hard, because it does not immediately translate to learning a function \(f\)
- Since MERCS is just a huge ensemble of predictive functions, it does implicitly capture some kind of general structure of the datasete
- Two questions;
- Is this sufficient for Anomaly Detection?
- Can we extract this knowledge easily?
5. MERCS
- Ongoing research, too early to tell.
- Our idea:
- Learn a MERCS model on historical data
- Given a new instance, do a prediction with every component model of MERCS
- Compare those predictions to the observed values = residuals
- Aggegrate those residuals into a binary classification; anomaly yes/no
5. MERCS
3. Anomaly Detection with MERCS
- Ongoing research, too early to tell.
- Potential payoffs;
- You can inspect the outcomes. You can go and check which predictors were wrong and thus contributed to the anomaly classification.
- You can deal with missing values
- The idea is pretty general, you can put this on top of any kind of predictive model that happens to work well in your use-case.
5. MERCS
3. Anomaly Detection with MERCS
Anomaly Detection for Beam Transfer Installations
By eliavw
Anomaly Detection for Beam Transfer Installations
Summary of our research in collab with CERN @ 2019


