Training
Introduction to
BDA and ML
Abdullah Fathi

(JPK)
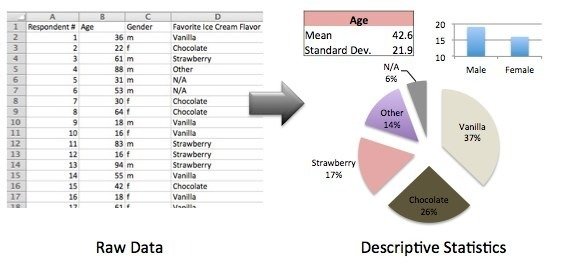
What is Big Data Analytic?
Set of techniques/processes used to discover relationships, recognize patterns, predict trends, and find associations in your data
Benefit & Advantages of BDA
- Risk Management: Banco de Oro, a Phillippine banking company, uses Big Data analytics to identify fraudulent activities and discrepancies.
- Product Development and Innovations: Rolls-Royce, uses Big Data analytics to analyze how efficient the engine designs are and if there is any need for improvements
- Quicker and Better Decision Making Within Organizations: Starbucks uses Big Data analytics to make strategic decisions.
- Improve Customer Experience: Delta Air Lines uses Big Data analysis to improve customer experiences. They monitor tweets to find out their customers’ experience regarding their journeys, delays, and so on
Example
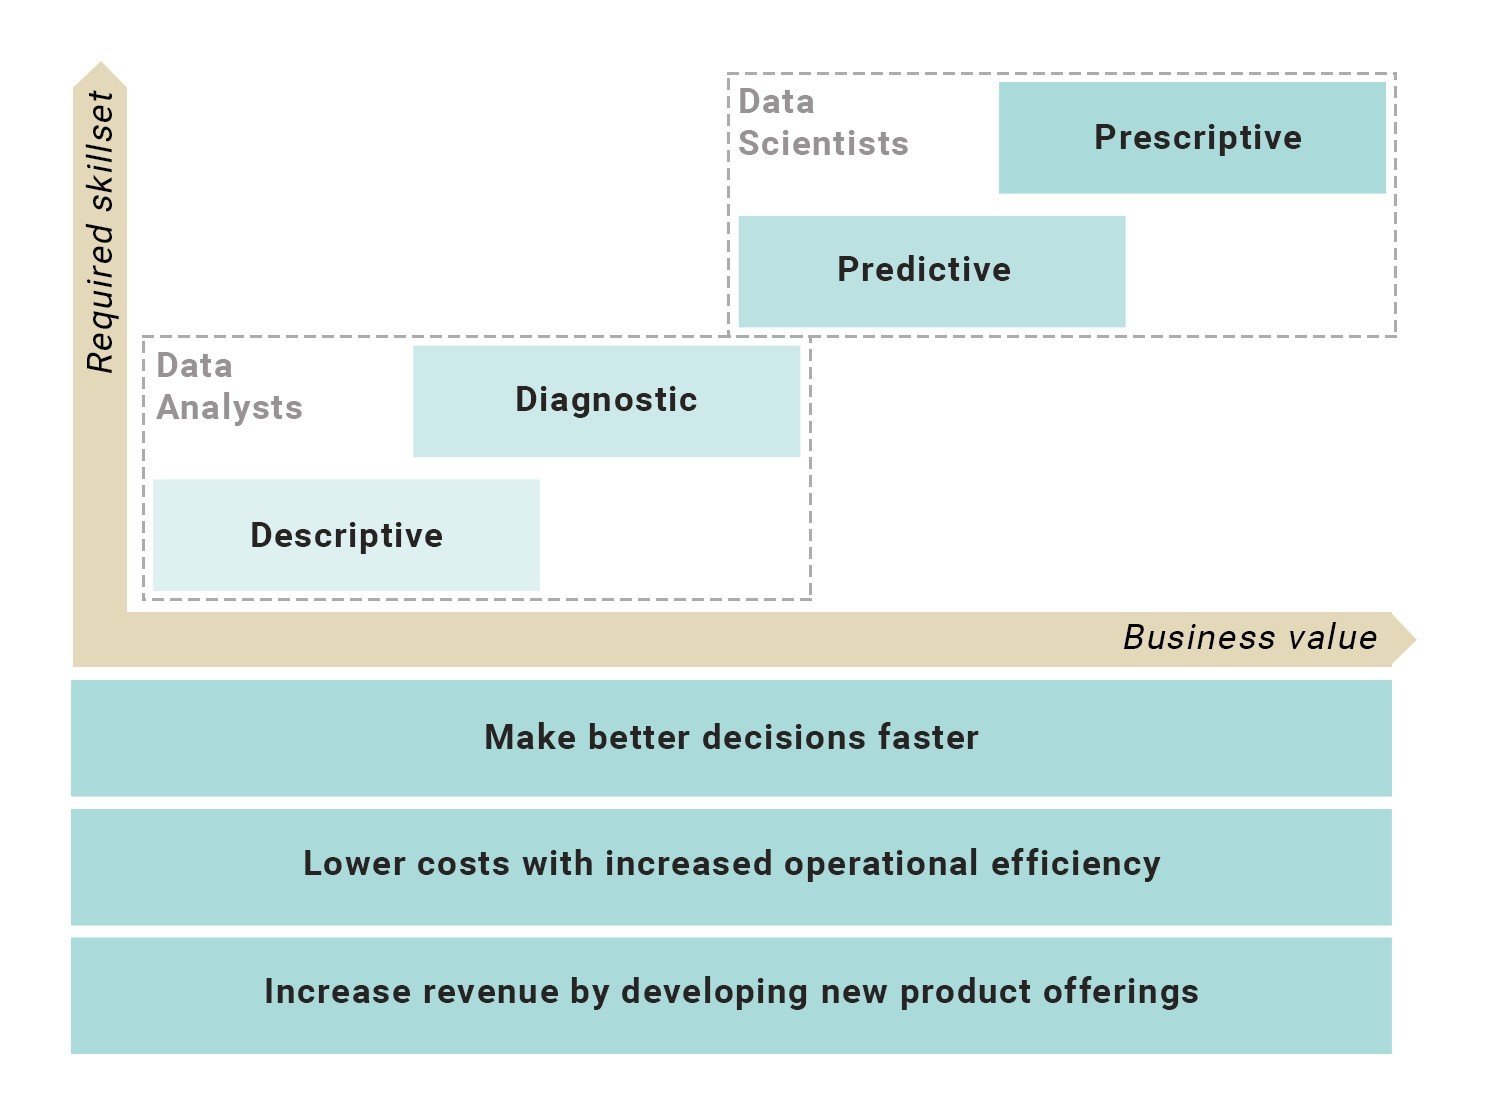
4 Major Types of Analytic
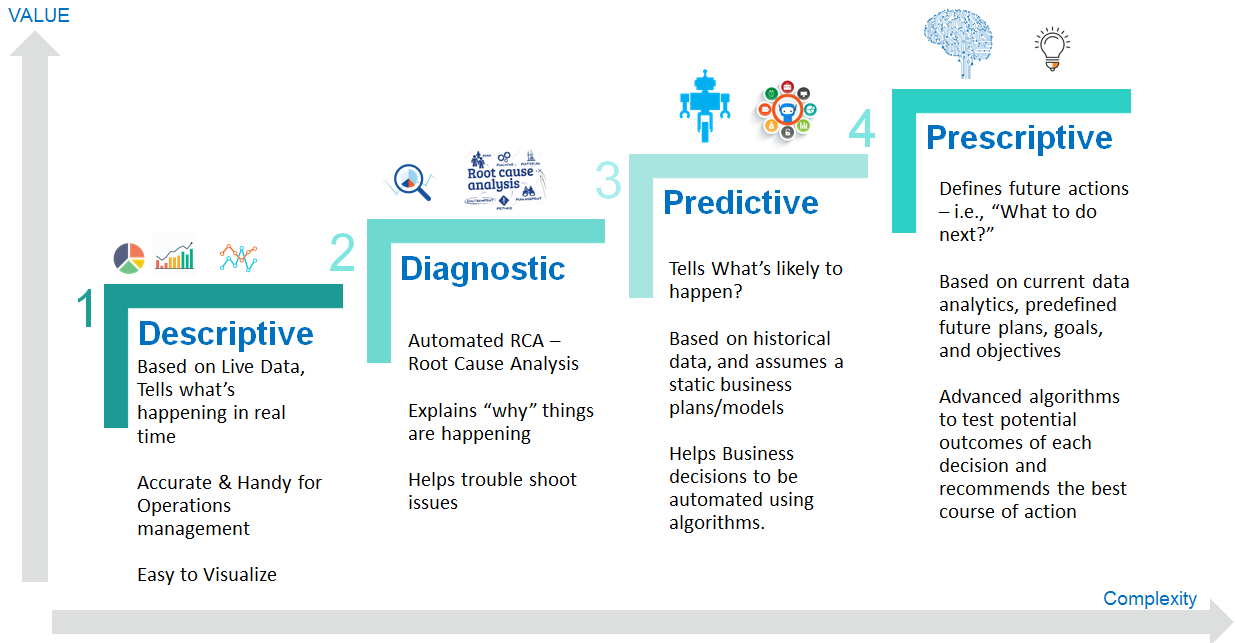
Descriptive
Analytic
Explains What Happened
-
Descriptive analytics juggles raw data from multiple data sources to give valuable insights into the past
-
Describing, summarizing, and identifying patterns through calculations of existing data, like mean, median, mode, percentage, frequency, and range
-
The baseline from which other data analysis begins.
-
It is only concerned with statistical analysis and absolute numbers, it can’t provide the reason or motivation for why and how those numbers developed
- Statistics
- Distribution
Some example of analyses used at this stage:
Statistic
- Provide valuable information
- The most important statistical parameters are the minimum, the maximum, the mean, and the standard deviation
| Minumum | Maximum | Mean | Standard Deviation | |
|---|---|---|---|---|
| Total Amount (RM) | 12 | 500 | 51 | 56 |
As we can see, each customer has spent an average of RM51, but some people have spent up to RM500
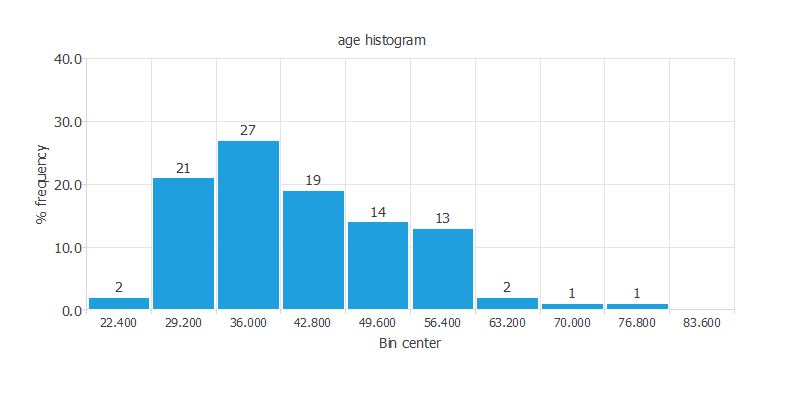
Distributions
- show how the data is arranged over its entire range
- Histograms show how continuous variables are distributed
- A normal (gaussian) or uniform distribution is, in general, desirable
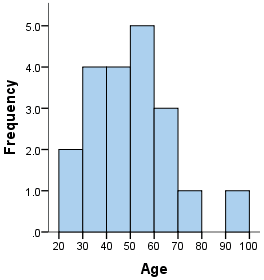
Distributions
As we can see, most of the customers are between
30 and 40 years old
Diagnostic
Analytic
Explains Why Did Something Happened
-
Like descriptive analytics, diagnostic analytics also focus on the past
-
Look for cause and effect to illustrate why something happened
-
The objective is to compare past occurrences to determine causes
-
Provided in the context of probability, likelihood, or a distributed outcome.
What is Diagnostic Analytics?
- Scatter Charts
- Correlation
In this stage, usually we focus on the following techniques:
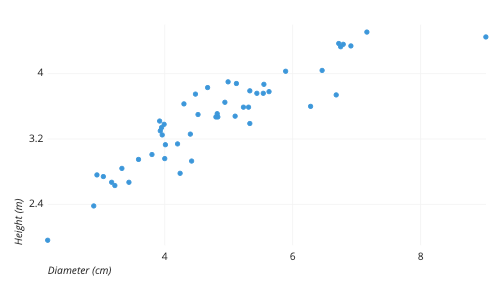
Scatter Charts
Scatter charts might help to discover dependencies between the output variables and the input variables
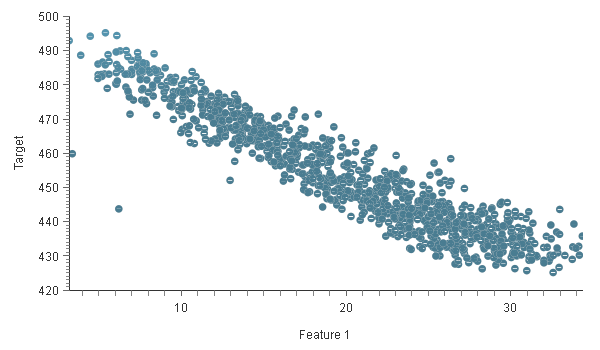
Scatter Charts
The chart above shows that as the value of Feature 1 increases, the value of Target decreases
Correlations
- Helpful technique to discover dependencies between input and output variables
- A correlation is a numerical value between 0 and 1 that expresses the strength of the relationship between two variables.
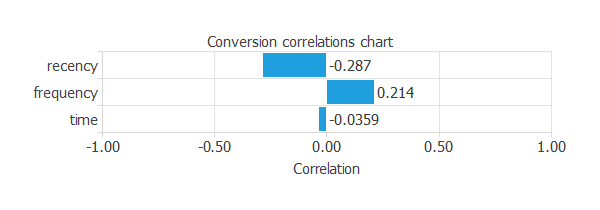
The maximum correlation (-0.287) is a yield between the recency and the conversion. Such a high correlation indicates that we have to study this variable more thoroughly
Correlations
Predictive
Analytic
What is Likely To Happen
-
Uses the findings of descriptive and diagnostic analytics to detect clusters and exceptions and to predict future trends
-
Based on Machine Learning or Deep Learning
-
The more data points you have, the more accurate the prediction is likely to be
What is Predictive Analytics?
No analytics will be able to tell you exactly what WILL happen in the future.
Predictive analytics put in perspective what MIGHT happen, providing respective probabilities of likelihoods
given the variables that are being looked at
- K-Nearest Neighbour (KNN)
- Decision Trees
- Neural Networks
In this stage, It encompasses various machine learning techniques such as:
K – Nearest neighbors
K-nearest neighbors is a very simple method used for classification and approximation
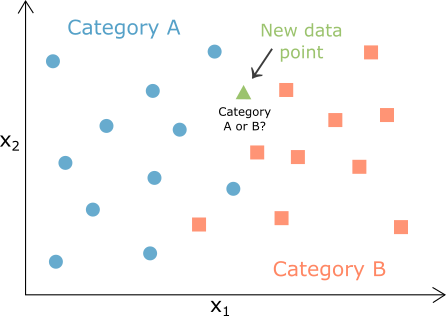
K – Nearest neighbors
Decision Trees
- Decision trees are also a simple method used for classification and approximation.
- A decision tree is a mathematical model helping you to choose between several courses of action. It estimates probabilities to calculate likely outcomes
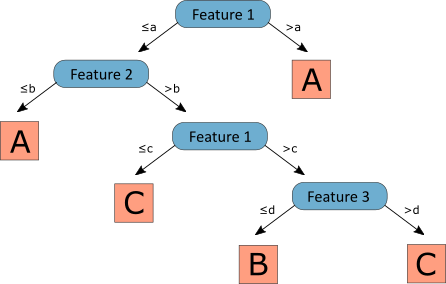
Decision Trees
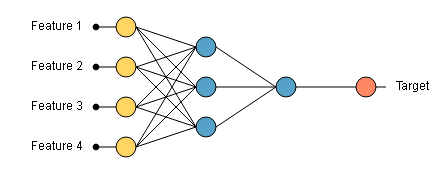
Neural Network
The outputs from the neural network depend on the inputs fed to it and the different parameters within the neural network
The graph above shows a neural network with four inputs (feature 1, 2, 3, and 4). When we introduce the values of the four features in the neural network, we get an output
Prescriptive
Analytic
What Action Should be Taken
-
Combines all of your data and analytics, then outputs a model prescription: What action to take
-
Analyze multiple scenarios, predict the outcome of each, and decide which is the
best course of action based on the findings -
Prescribe what action to take to eliminate a
future problem or take full advantage of a promising trend -
Uses Machine Learning, Algorithms, Artificial Intelligence (AI)
What is Prescriptive Analytics?
In this phase, we not only is predicted what will happen in the future using our predictive model but also is shown to the decision-maker the implications of each option
| Traditional Analytics (BI) | Big Data Analytics | |
|---|---|---|
| Focus On | - Descriptive Analytics - Diagnostic Analytics |
- Predictive Analytics - Prescriptive Analytics |
| Data Sets | - Limited Data Sets - Cleansed Data - Simple Model |
- Large Scale Data Sets - More types of data - Raw data - Complex data models |
| Supports | Causation: What happened and why? | Correlation: New insight. More accurate answers |
BDA Life Cycle
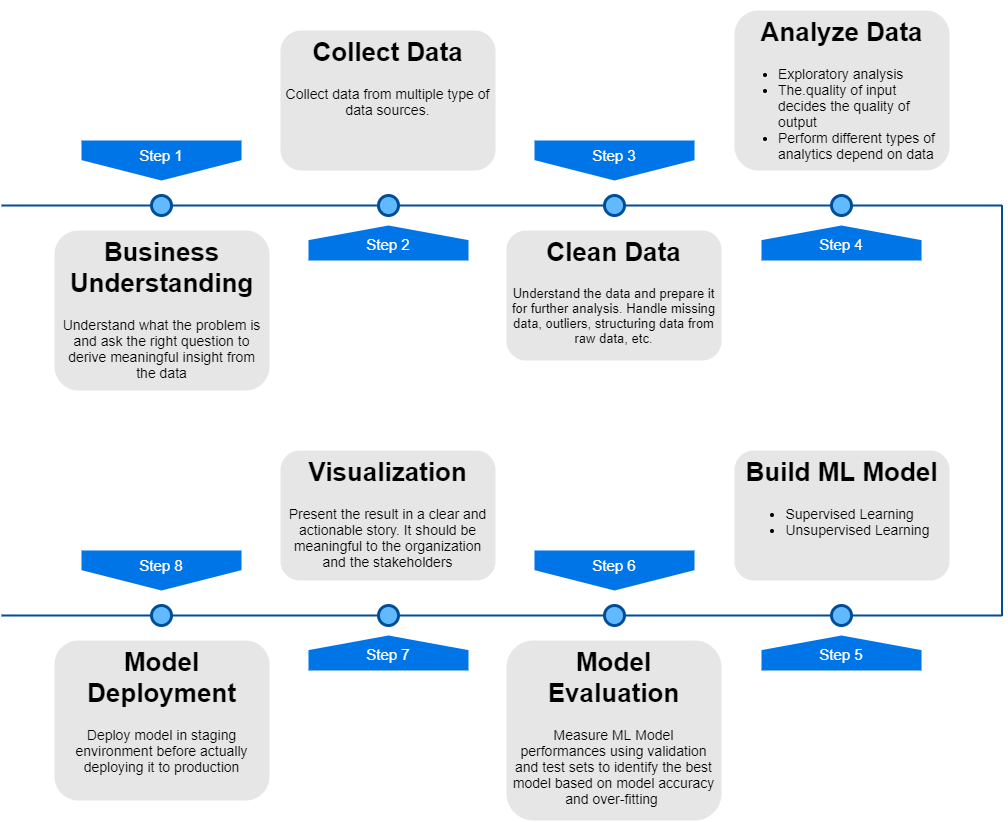
Step 1: Business Understanding
- Coming up with hypothesis and figuring how to test it
- Data analyst's job is to understand the business and its goals in enough depth that they can frame the problem the right way
- After you've defined a problem, determine which sources of data will best help you solve it
Step 2: Collect Data
- Create a strategy for collecting and aggregating the appropriate data.
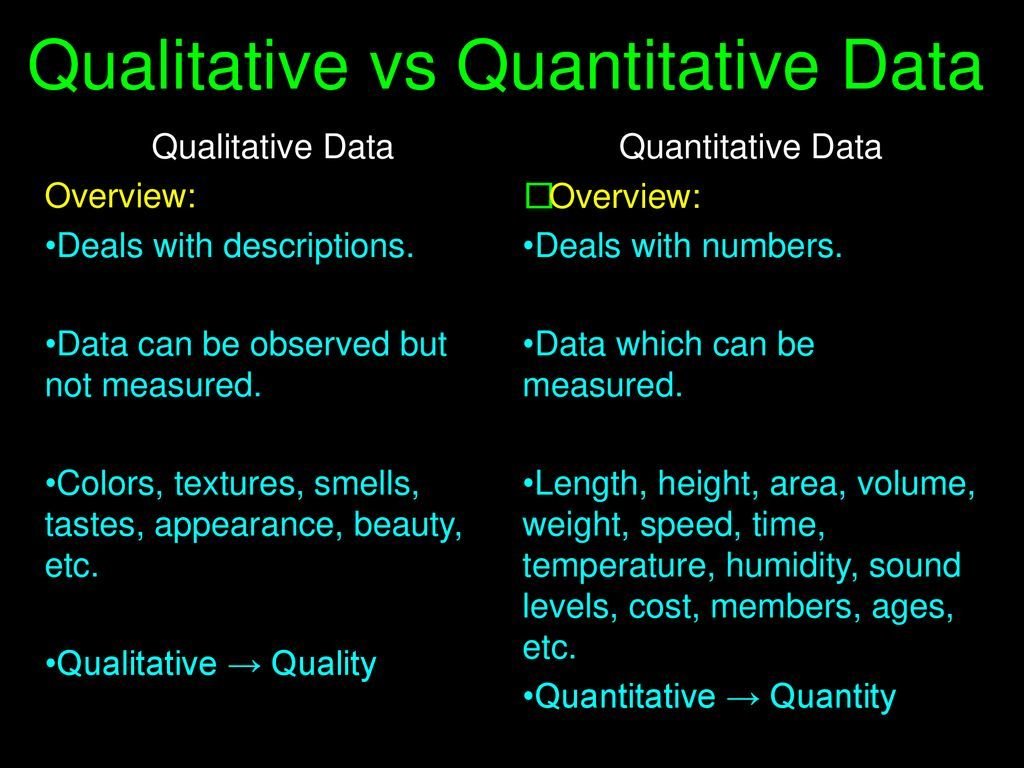
- Determine which data you need:
- Quantitative (numeric) data
- Qualitative (descriptive) data
- These data need to fit in one of these categories:
- 1st party data
- 2nd party data
- 3rd party data
Step 2: Collect Data
1st party data
- Internal data from your system in agencies or any sort of data from your agency that you can directly access to it.
- First-party data is usually structured and organized in a clear, defined way.
- Other sources of first-party data might include customer surveys, interviews or direct observation
Step 2: Collect Data
2nd party data
- First-party data of other agencies or organizations
- Example: system, app, social media activity
Step 2: Collect the Data
3rd party data
- Data that has been collected and aggregated from numerous sources by third-party organizations
- Often contains a vast amount of unstructured data points
Step 3: Cleaning the data
- Make the data ready for analysis
- Make sure you're working with high-quality data
- Data cleaning task:
- Get Rid of unwanted observations
- Fix structural errors
- Standardize your data
- Remove unwanted outliers
- Type conversion and syntax errors
- Deal with missing data
- Validate your dataset
A good data analyst will spend around 60-80% of their time cleaning the data. Focusing on the wrong data points will severly impact your analytical result
What happens if an Analysis is Performed on Raw Data?
Wrong data class prevents calculations to be performed
Missing data prevents
functions to work properly
Outliers corrupt the output and produce bias
The size of the data requires too much computation
Step 3.1: Get Rid of unwanted observations
- Remove observations (or data points) you don't want
- Remove irrelevant observations, those that don't fit the problem you're looking to solve
- Let say we are running analysis on vegetarian eating habits, we could remove any meat-related observations from our data set.
- Remove duplicate data
- Duplicate data commonly occurs when you combine multiple datasets, scrape data online, or receive it from third-party sources.
Step 3.2: Fix structural errors
- Typos and inconsistent capitalization, which often occur during manual data entry
- "merah", "Merah" may appear as separate classes (or categories)
- Look out for the use of underscores, dashes, and other punctuation
Step 3.3: Standardize your data
- Decide whether values should be all lowercase or all uppercase, and keep this consistent throughout your dataset
- Numerical data use the same unit of measurement
- kilometre/meter: combining these in one dataset will cause a problem
- date (dd/mm/yyyy or mm/dd/yyyy)
Step 3.4: Remove unwanted outliers
- Outliers are data point that dramatically differ from others in the set
- Can cause problem with certain of data models and analysis such as linear regression models
- Only remove outliers if you can prove that it is due to incorrect data entry
Deleting and Exchanging Outlier
Deleting and exchanging methods have their drawbacks with small samples
Assumption: The data point is faulty
An outlier totally out of scale might be a wrong measurement
- Not likely when measurements are automated
- Human mistakes are more likely to occur
Outliers can be valid measurements and they might reveal hidden potentials
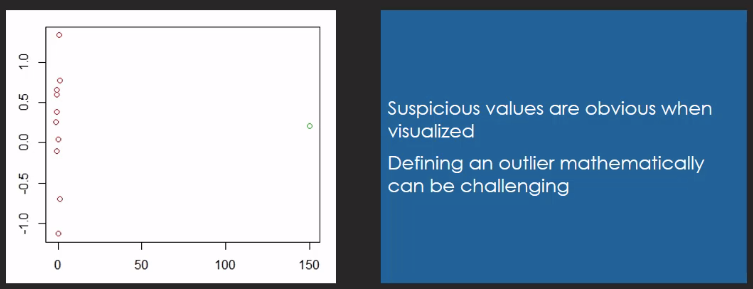
Scatterplot with Outlier
Step 3.5: Type conversion and syntax errors
- Ensure that numbers are numerical data
- Ensure that text as text input, dates as object, and so on
- Remove syntax error/white space
Step 3.6: Deal with missing data
NA
- Missing data is common in raw data
- NA: Not Available or Not Applicable
- There could be various reasons behind NAs
- The amount of missing values matters
- Get information on the missing values from the person providing/creating the dataset
Step 3.6: Deal with missing data
- 3 common approach to handle missing data:
- Remove the entries associated to missing data: Losing other important information
- Impute (or guess) the missing data based on other similar data: Might reinforce existing pattern, which could be wrong
- Flag the data as missing (often the best one): ensure that empty field has the same value such as '0' (if numerical) or 'missing'
Carrying out an exploratory analysis
- Thing that many data analyst do (alongside cleaning data)
- Helps identify initial trends and characteristics, and can even refine your hypothesis.
Step 4: Analyze the data
3 Methods applied:
- Univariate Analysis
- Bivariate Analysis
- Multivariate Analysis
Exploratory Data Analysis (EDA): To discover relationships between measures in data and to gain insight on the trends, pattern and relationship among various entities with the help of statistic and visualisation tools
Univariate Analysis
Uni means one and variate means variable
- There is only one dependable variable
- Objective: derive the data, define and summarise it
- In dataset, it explore each variable separately
- 2 kind of variables:
- Categorical
- Numerical
Univariate Analysis: Frequency distribution Tables
Reflects how often an occurrence has taken place in the data. It gives a brief idea of the data and make it easier to find a pattern
| IQ Range | Number |
|---|---|
| 118-125 | 3 |
| 126-133 | 7 |
| 134-141 | 4 |
| 142-149 | 2 |
| 150-157 | 1 |
Example: The list of IQ scores is: 118, 139, 124, 125, 127, 128, 129, 130, 130, 133, 136, 138, 141, 142, 149, 130, 154
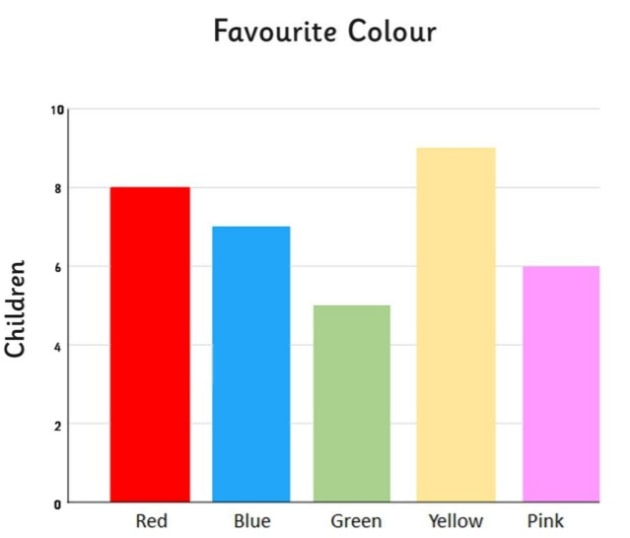
Univariate Analysis: Bar Charts
The bar graph is very convenient while comparing categories of data or different groups of data. It helps to track changes over time. Best to visualizing discrete data (variable that only store certain value)
Bar chart is a great way to display categorical variables in the x-axis. This type of graph denotes two aspects in the y-axis.
- The first one counts the number of occurrence between groups.
- The second one shows a summary statistic (min, max, average, and so on) of a variable in the y-axis
Univariate Analysis: Histogram
Similar to bar charts. Represent the group of variables with values in the y-axis
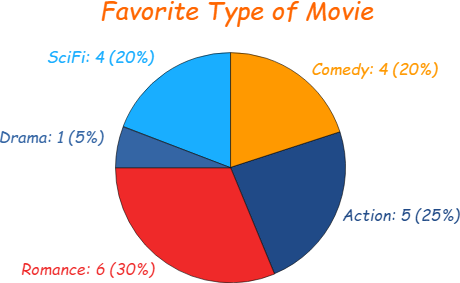
Univariate Analysis: Pie Charts
Mainly used to comprehend how a group is broken down into smaller pieces. The whole pie represents 100%.
Bivariate Analysis
Bi means two and variate means variable. Relationship between two variables
- There are 3 types of bivariate analysis:
- Two Numerical Variables
- Scatter Plot
- Linear Correlation
- Two Categorical Variables
- Chi-square test
- One Numerical and One Categorical
- z-test and t-test
- Two Numerical Variables
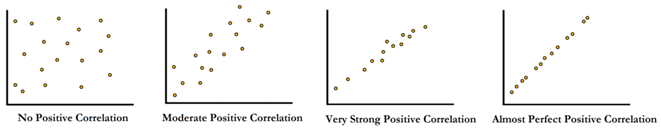
Bivariate Analysis: Scatter Plot
Represents individual pieces of data using dots. These plots make it easier to see if two variables are related to each other. The resulting pattern indicates the type (linear or non-linear) and strength of the relationship between two variables
Bivariate Analysis:
Linear Correlation
Represents the strength of linear relationship between two numerical variables
Bivariate Analysis:
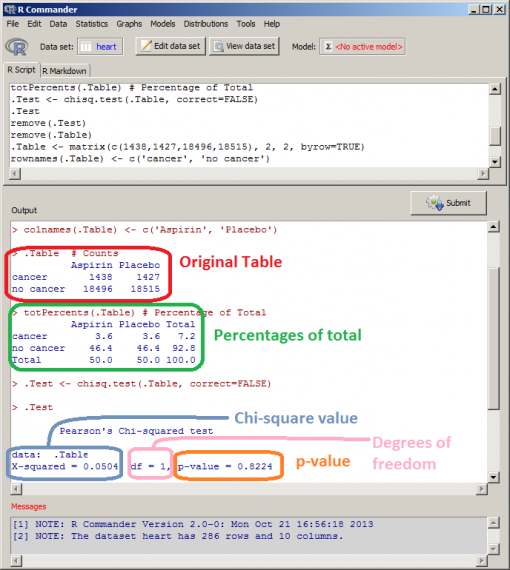
Chi-square Test
Use for determining the association between categorical variables
Bivariate Analysis:
Z-test and t-test
A t-test is a statistical test that is used to compare the means of two groups. It is often used in hypothesis testing to determine whether a process or treatment actually has an effect on the population of interest, or whether two groups are different from one another.
You want to know whether the mean petal length of iris flowers differs according to their species. You find two different species of irises growing in a garden and measure 25 petals of each species. You can test the difference between these two groups using a t-test.
- The null hypothesis (H0) is that the true difference between these group means is zero.
- The alternate hypothesis (Ha) is that the true difference is different from zero.
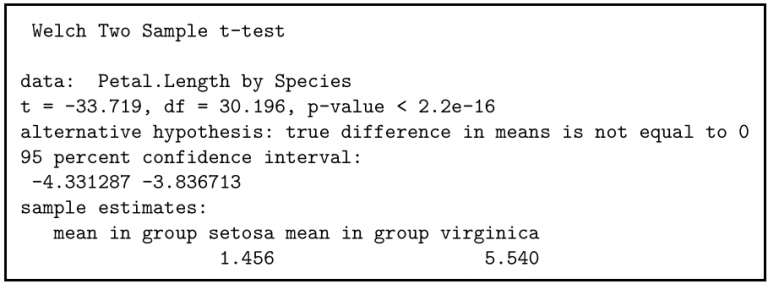
From the output table, we can see that the difference in means for our sample data is -4.084 (1.456 – 5.540), and the confidence interval shows that the true difference in means is between -3.836 and -4.331. So, 95% of the time, the true difference in means will be different from 0. Our p-value of 2.2e-16 is much smaller than 0.05, so we can reject the null hypothesis of no difference and say with a high degree of confidence that the true difference in means is not equal to zero.
Multivariate Analysis
Required when more than two variables have to be analyzed simultaneously. It is hard to visualize a relationship among 4 variables in graph.
- There are 2 types of multivariate analysis:
- Cluster analysis
- Principal Component Analysis (PCA)
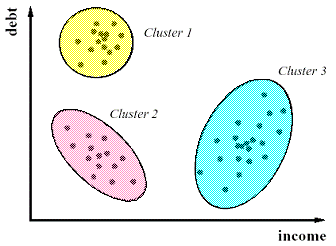
Multivariate Analysis:
Cluster Analysis
Classify different objects into clusters in a way that the similarity between two objects from the same group is maximum and minimal otherwise
Multivariate Analysis:
Principal Component Analysis (PCA)
Reducing dimensionality of a data table with large number of interrelated measures.
Step 5:
Build Predictive Model
Use various algorithms to build predictive models
Step 6:
Model Evaluation
Check the efficiency of our model
Step 7: Visualization
- Share the insight with the wider world
- Interpreting the outcomes, and presenting them in a manner that's digestible for all types of audience
- How you interpret will often influence the direction of business
- It's important to provide all the evidence that you've gathered.
BDA Technique
Association Rule Learning
Are people who purchase tea more or less likely to purchase carbonated drinks?
- Discover interesting correlations between variables in large databases
- First used by major supermarket chains to discover interesting relations between products,
Classification Tree Analysis
Which categories does this document belong to?
- Method of identifying categories that a new observation belongs to
- Which it being used to:
- Automatically assign documents to categories
- Categorize organism into grouping
- Develop profile of students who take online course
Regression Analysis
- Manipulating some independent variable to see how it influences a dependent variable
- Works best with quantitative data
- Regression analysis is used to determine:
- Levels of customer satisfaction affect customer loyalty
- The number of support calls received may influence by the weather forecast given the previous day
- Neighbourhood and size affect the listing price of houses
Time Series Analysis
Statistical technique used to identify trends and cycles over time
- Time series data is a sequence of data points which measure the same variable at different points in time.
- Main pattern you'll be looking out for in your data are:
- Trends: Stable, linear, increase or decrease over an extended time period
- Seasonality: Predictable fluctuations in the data due to seasonal factors over a short period of time. ex: you might see a peak in raincoat sales in November around the same time every year.
- Cyclic Pattern: Unpredictable cycles where the data fluctuates. As a result of economic or industry-related conditions.
Sentiment Analysis
How well is our new return policy being received?
- Determine the sentiments of speakers or writers with respect to topic
- Use NLP to determine whether data is positive, negative or neutral
- Sentiment analysis is being used to help:
- Improve service at a hotel chain by analyzing guest comments
- Customize incentives and services to address what customers are really asking for
- Determine what consumers really think based on opinions from social media
- Emoji Sentiment
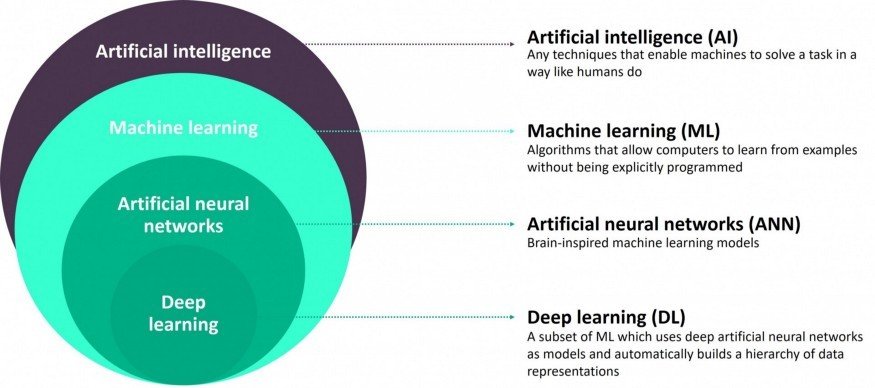
Machine Learning
Machine Learning
- Machine learning is a subset of artificial intelligence.
- Focuses mainly on designing systems which allow them to learn and make predictions based on some experience which is data.

Machine learning is becoming widespread among data scientist and is deployed in hundreds of products we use daily. One of the first ML application was spam filter
Applications of ML

Applications of ML

Supervised
VS
Unsupervised
Supervised Learning
Training data feed to the algorithm includes a label (answer)
-
Classification
- Most used supervised learning technique
-
Regressions
- Commonly used in ML field to predict continuous value.
- Predict the value of dependant variable based on a set of independant variables (also called predictors or regressors)
Lists of some fundamental supervised learning algorithms
- Linear Regression
- Logistic Regression
- Neares Neighbours
- Support Vector Machine (SVM)
- Decision trees and Random Forest
- Neural Networks
Unsupervised Learning
Training data is unlabeled.
The system tries to learn without a reference
List of unsupervised learning algorithms
- K-mean
- Hierarchical Cluster Analysis
- Expectation Maximization
- Visualization and dimensionality reduction
- Principal Component Analysis
- Kernel PCA
- Locally-Linear Embedding
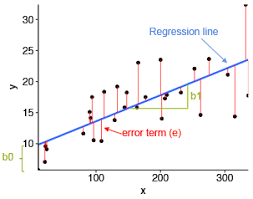
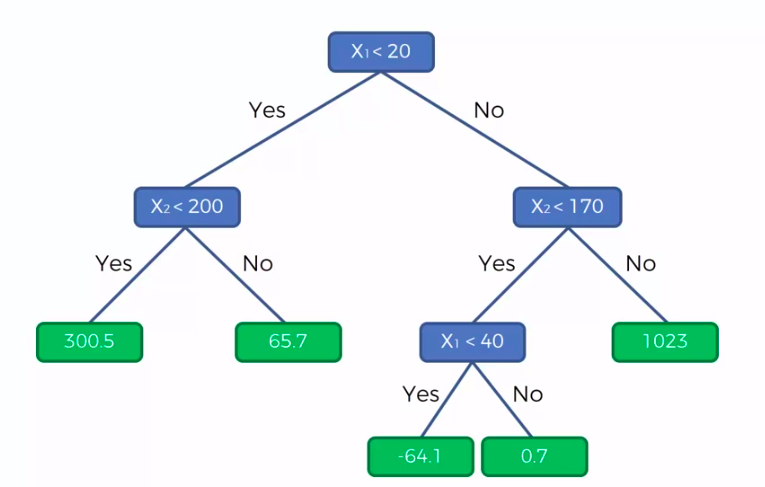
Regression
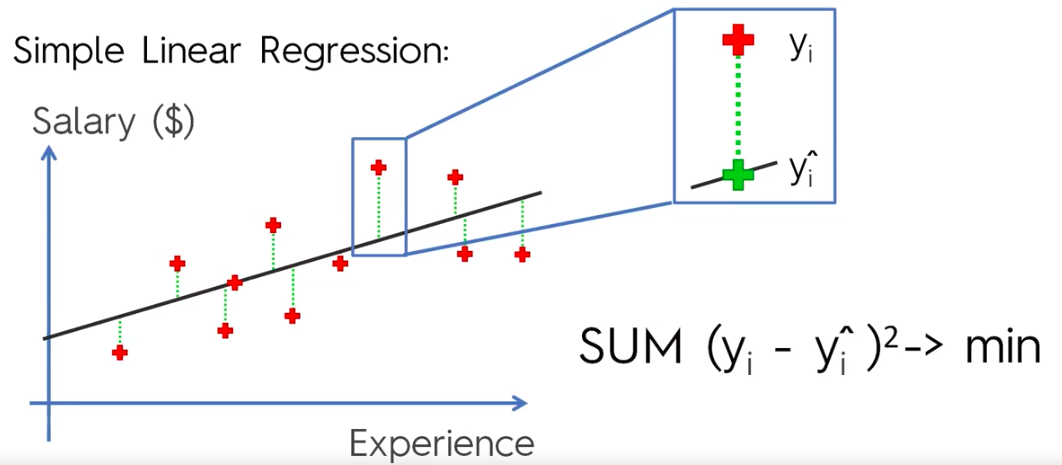
Simple Linear Regression
Decision Tree Regression
CART
Classification And Regression Trees
Classification Trees
Regression
Trees
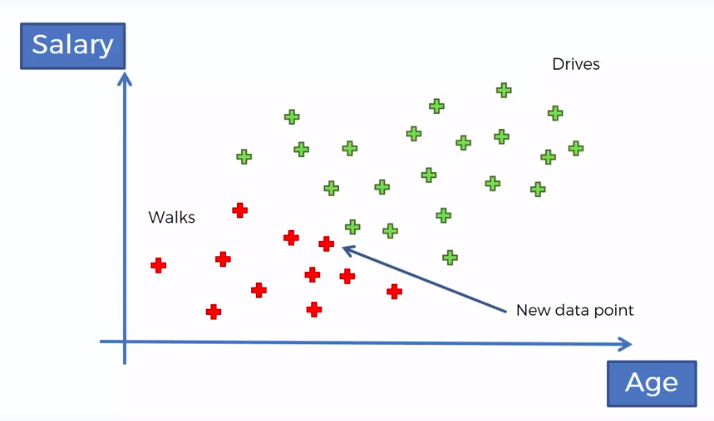
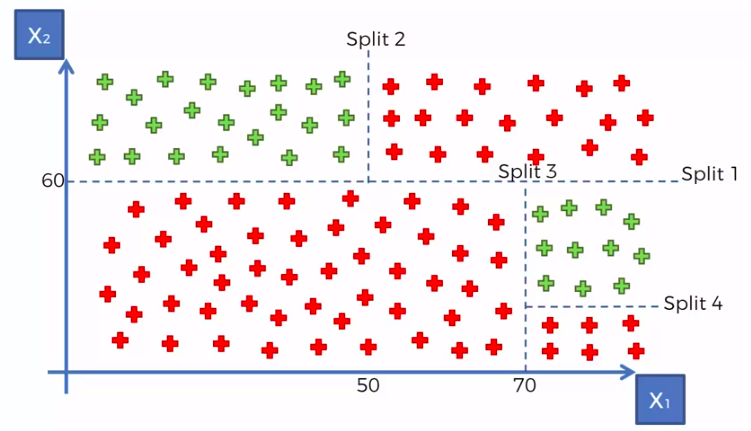
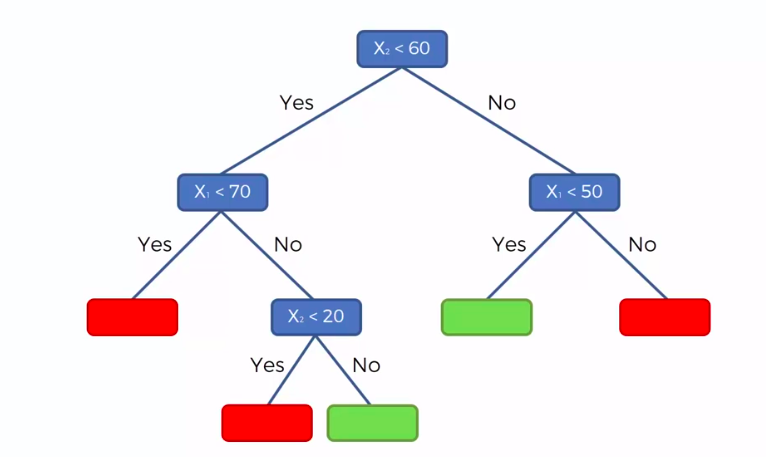
X1 and X2 is Independent Variable
Y is our Dependent Variable which we could not see because it is in another dimension (z-axis)
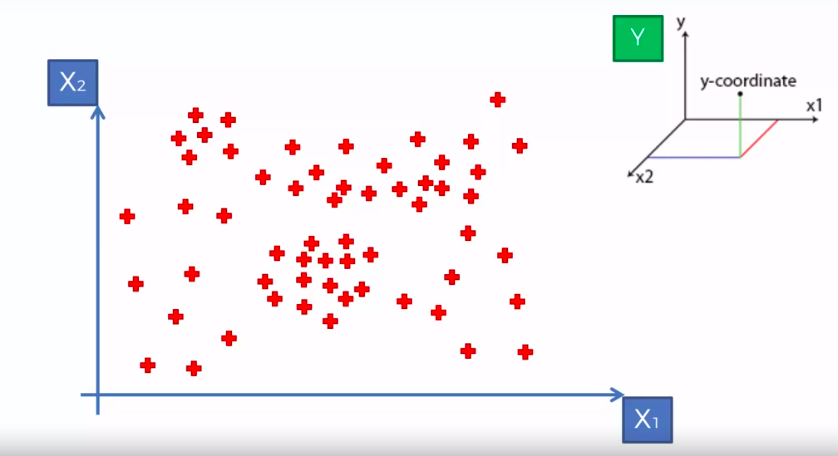
- Scatter plot will be split up into segment
- Split is determine by the algorithm.
- It is actually involve looking at something called information entropy
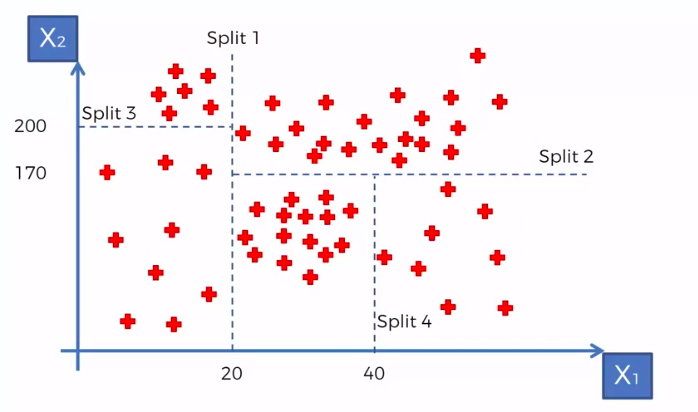
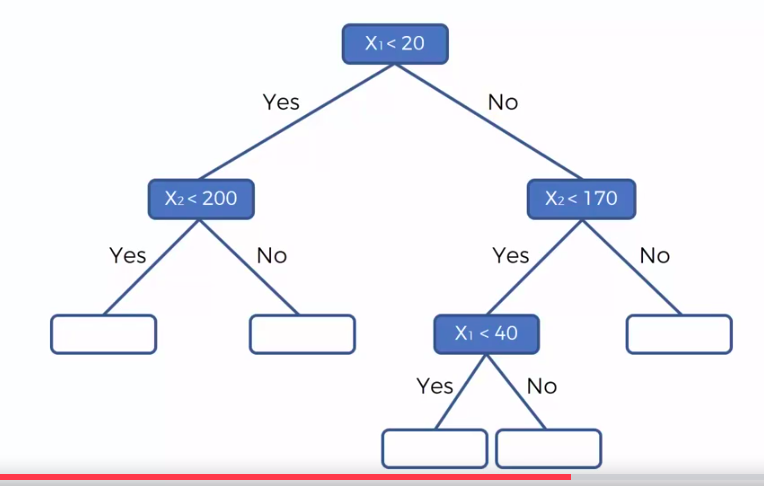
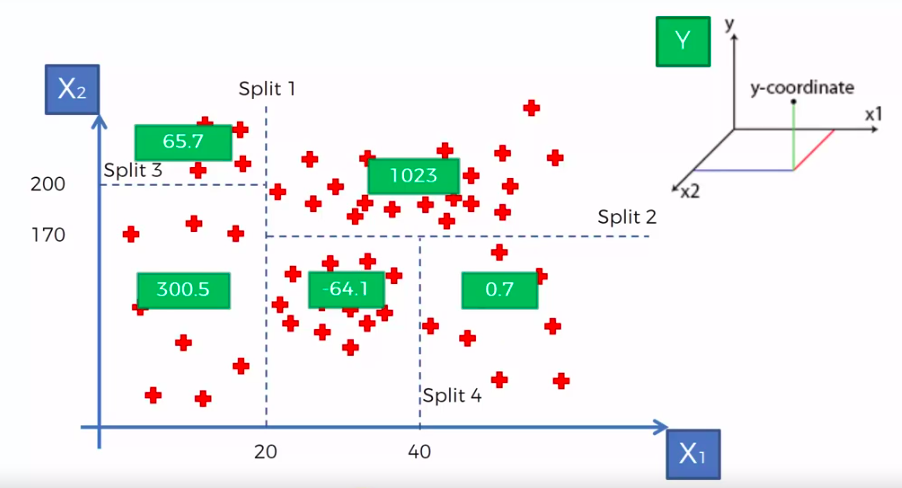
Calculate Mean/Average for each leaf
Random Forest Regression

We are not just predicting based on 1 Tree, We are predicting based on forest of trees. It will improve the accuracy of prediction because we take the average of many prediction
R-Squared

Classification
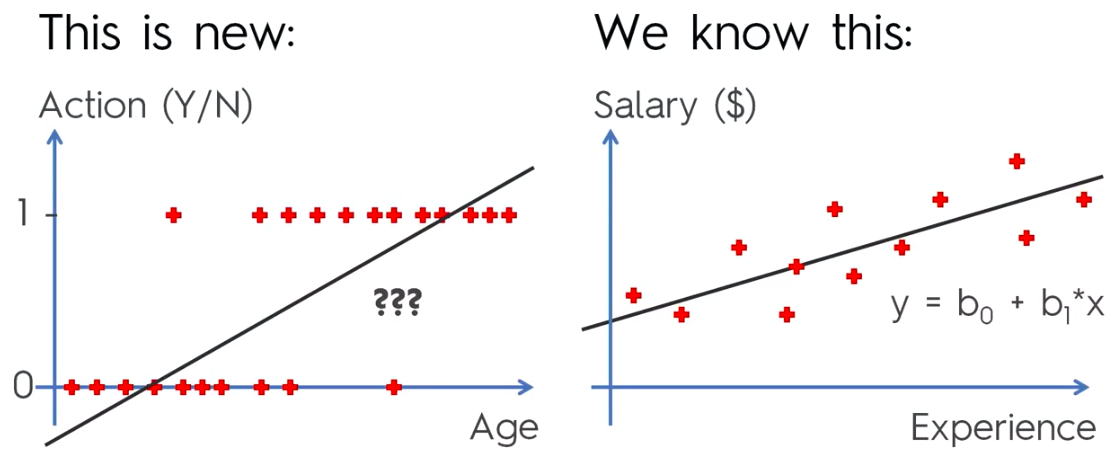
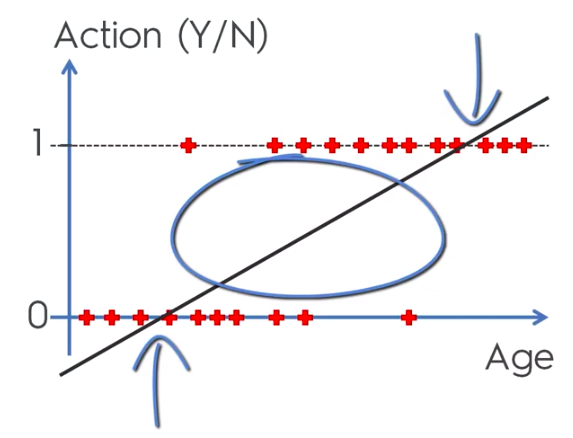
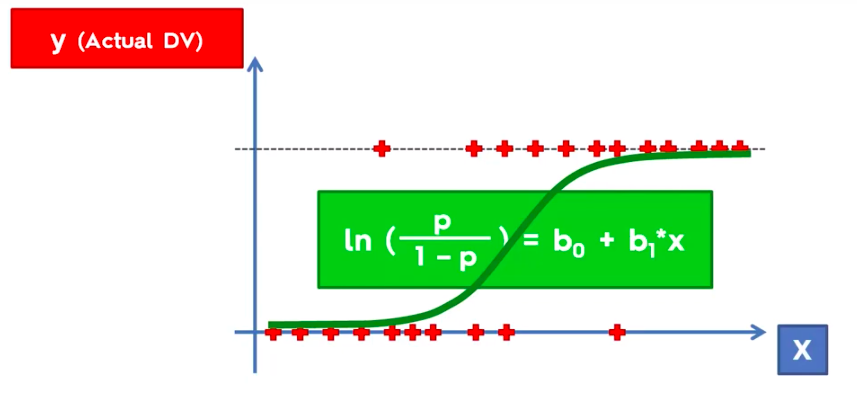
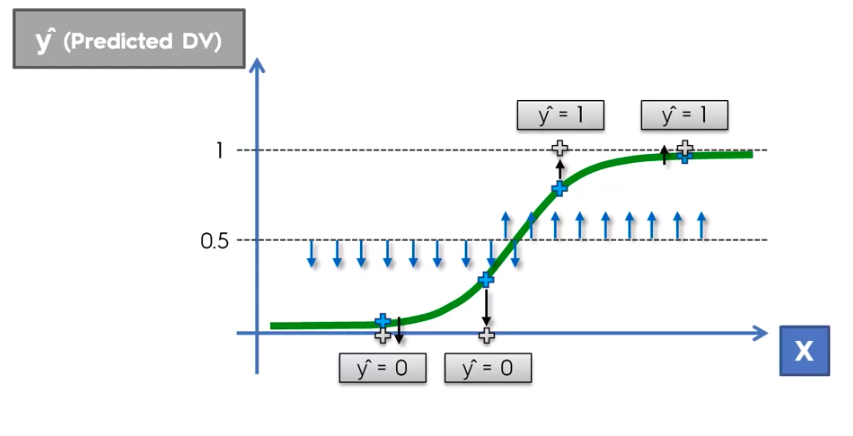
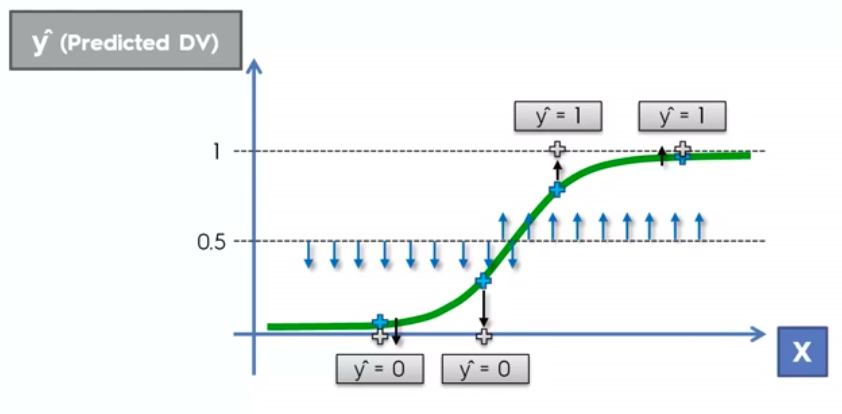
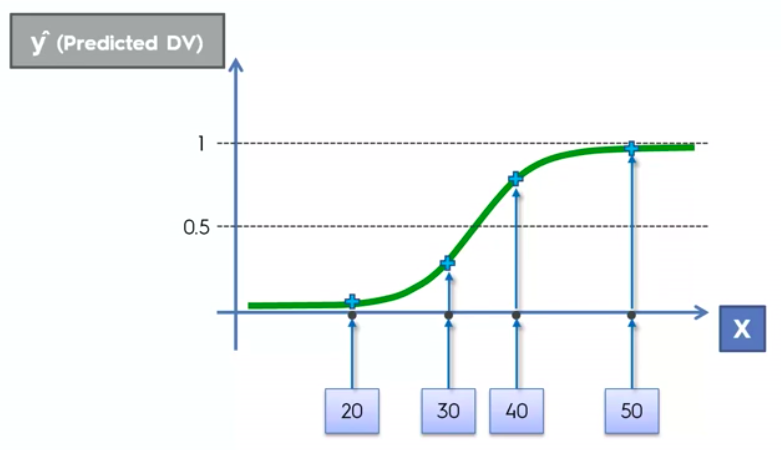
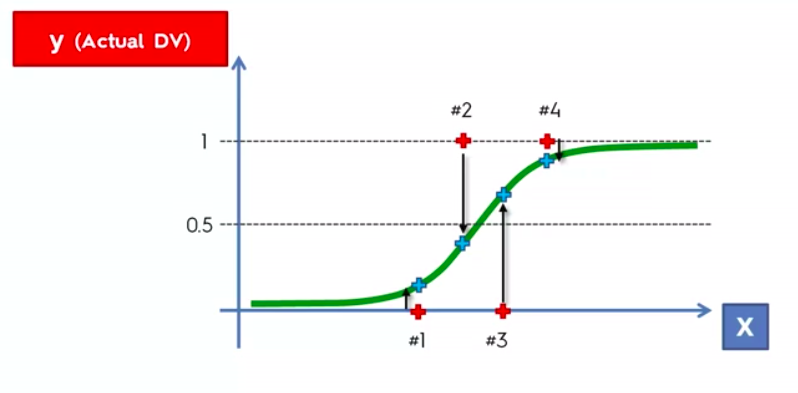
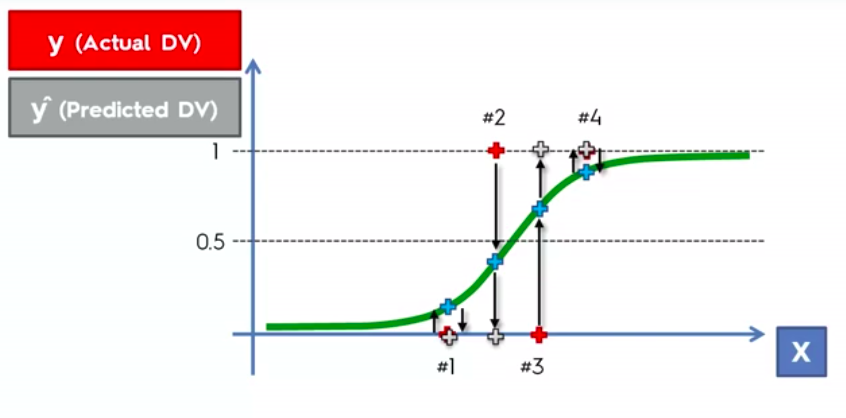
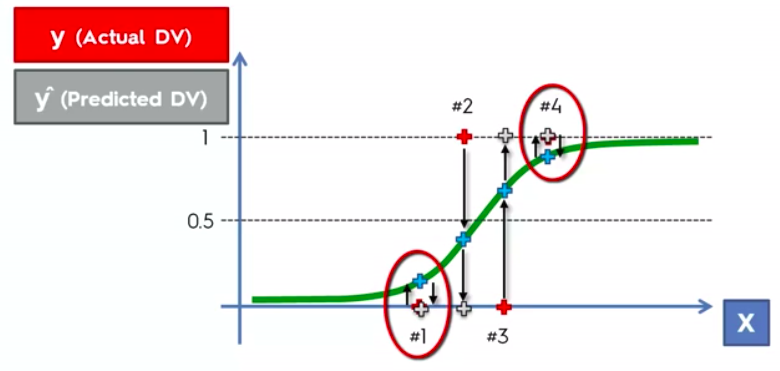
Logistic Regression
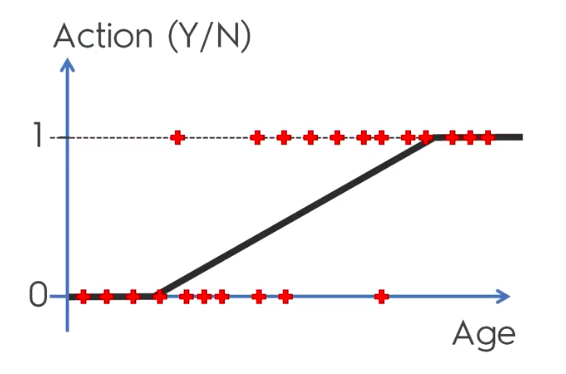
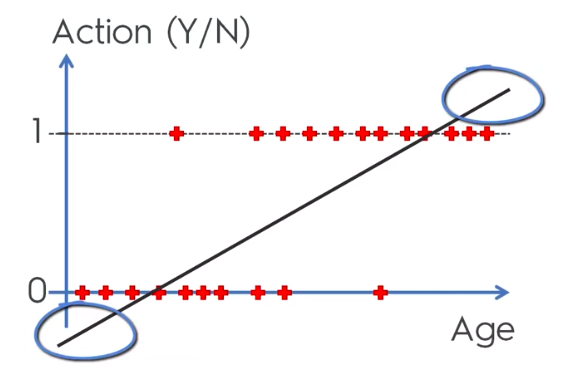
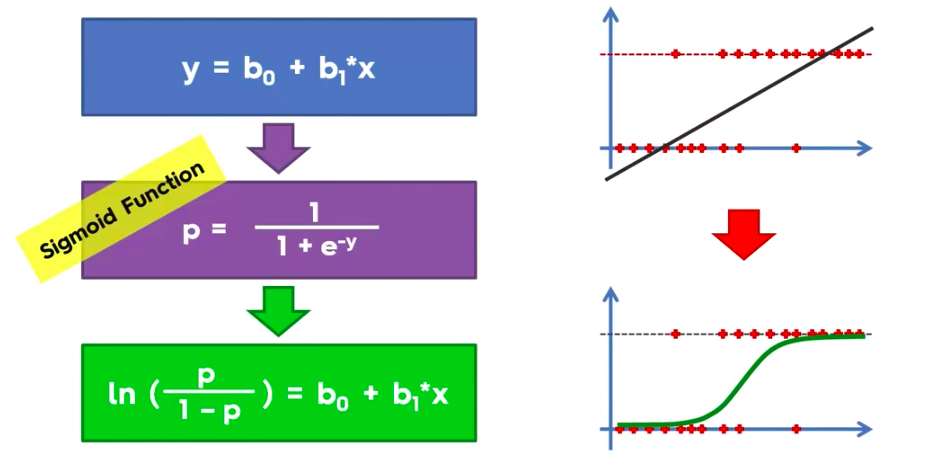
Logistic Regression Equation
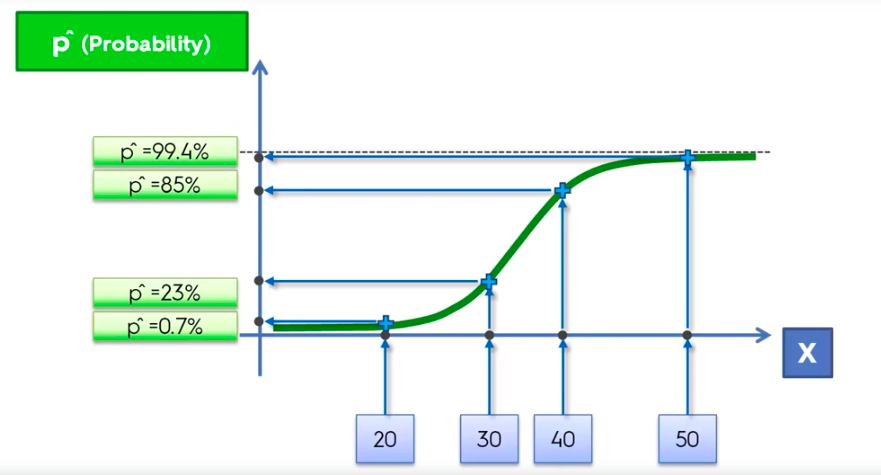
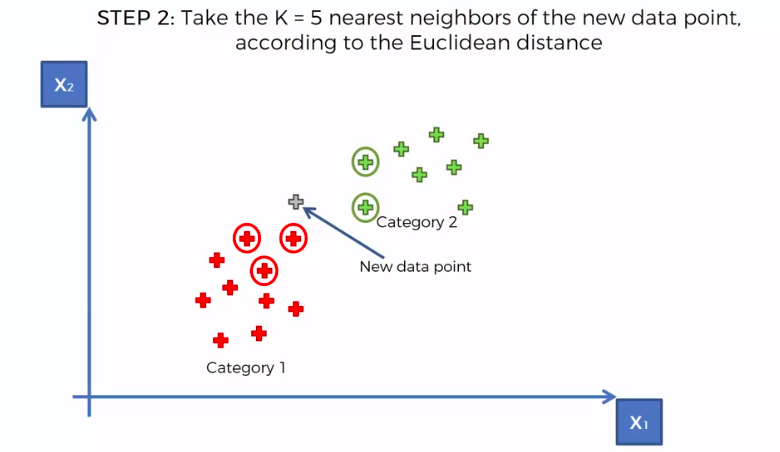
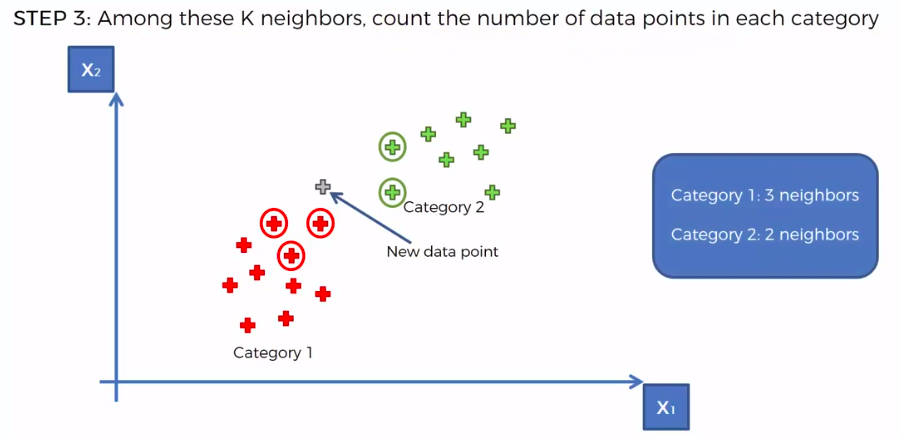
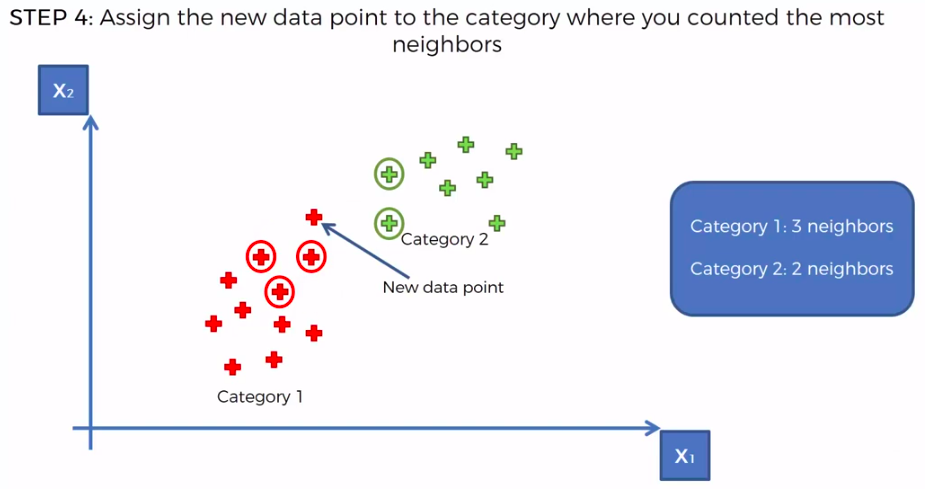
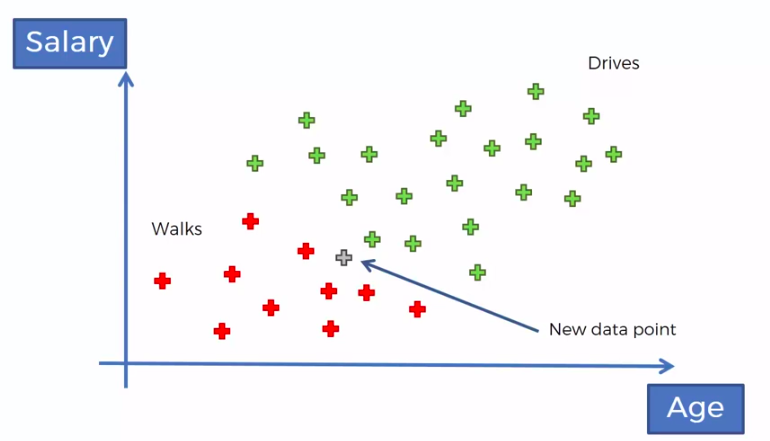
K-Nearest Neighbour
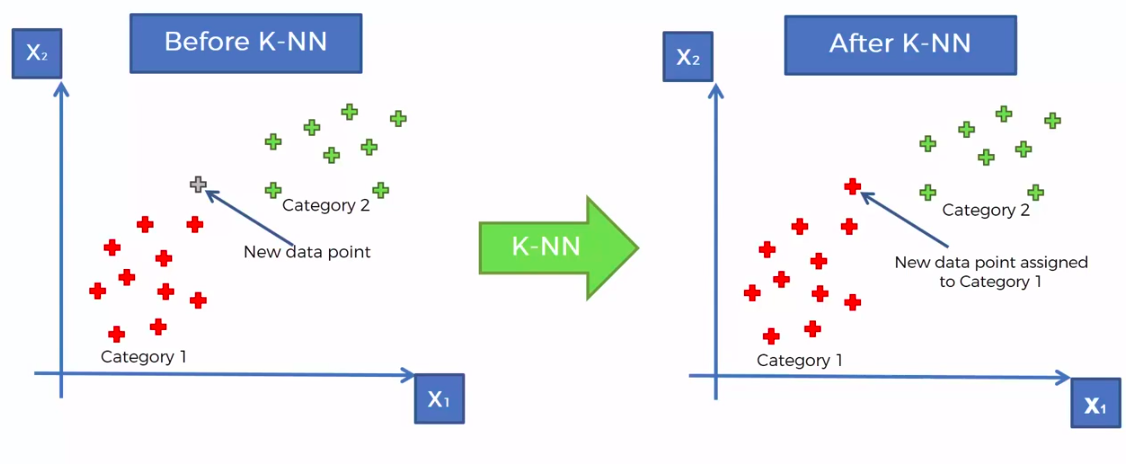
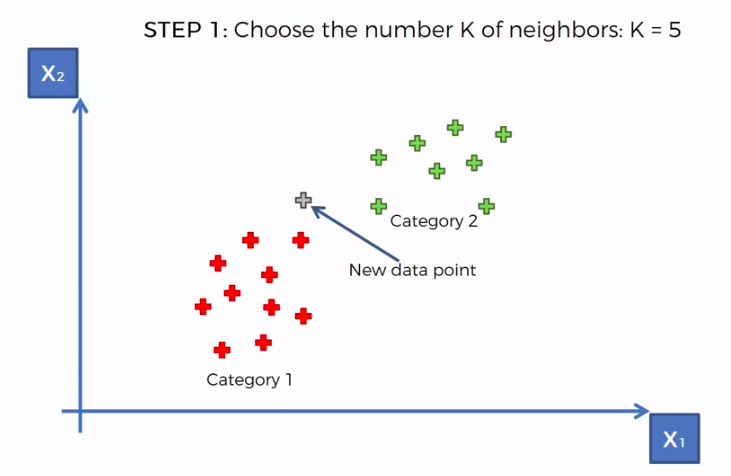
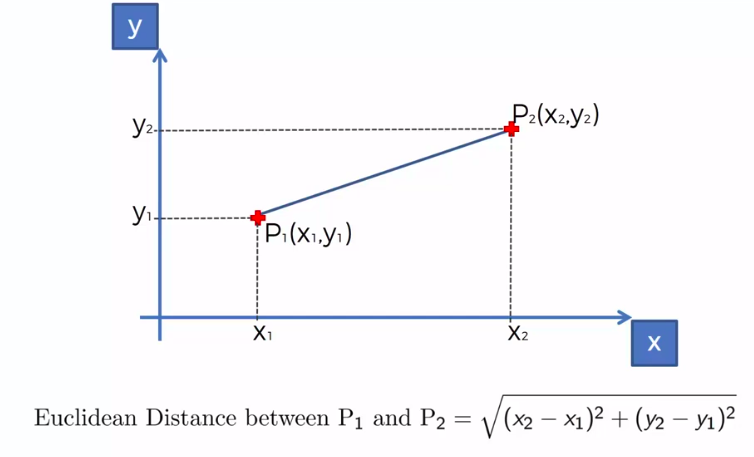
We can use other Distance as well such as Manhattan Distance. But Euclidean is the commonly used for geometry
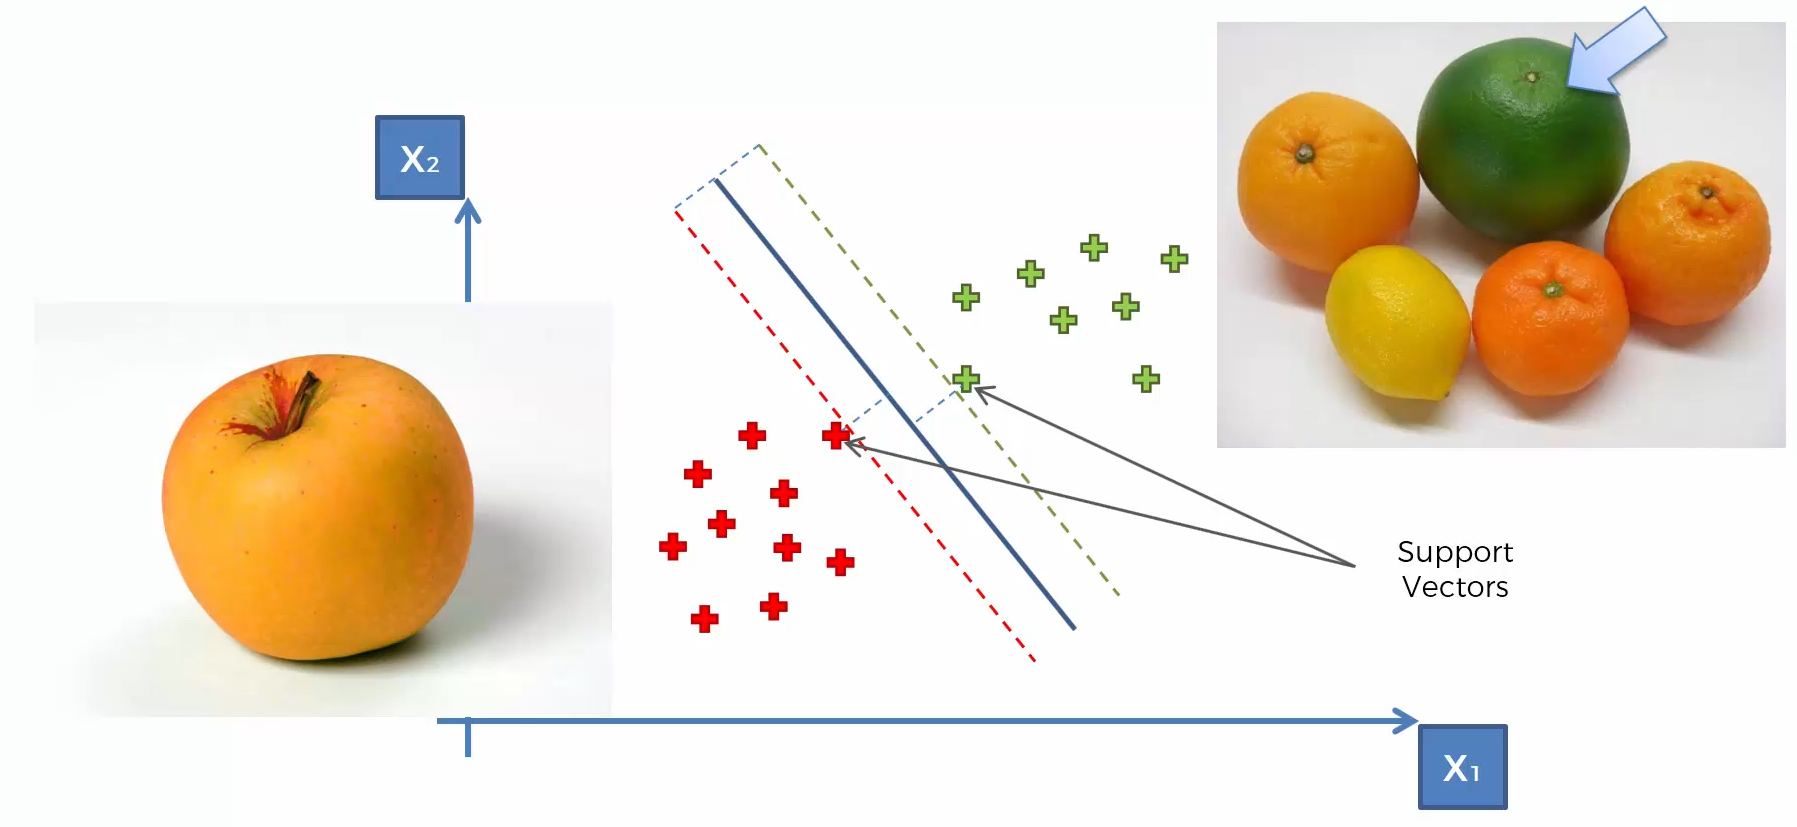
Support Vector Machine (SVM)
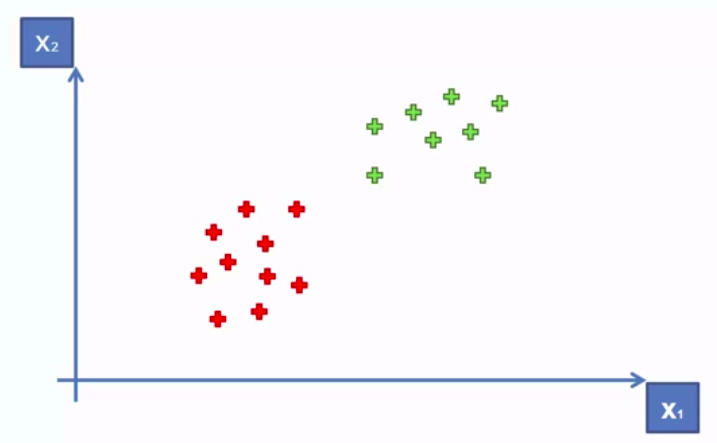
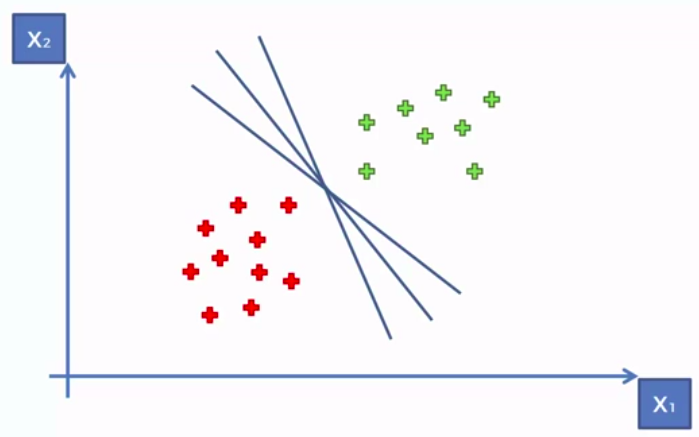
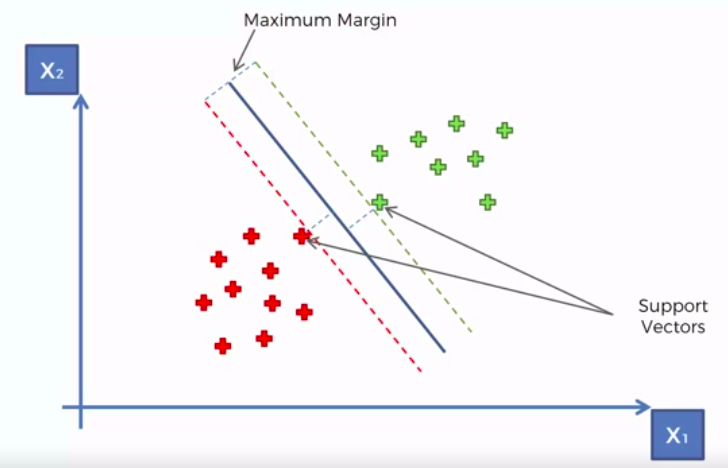
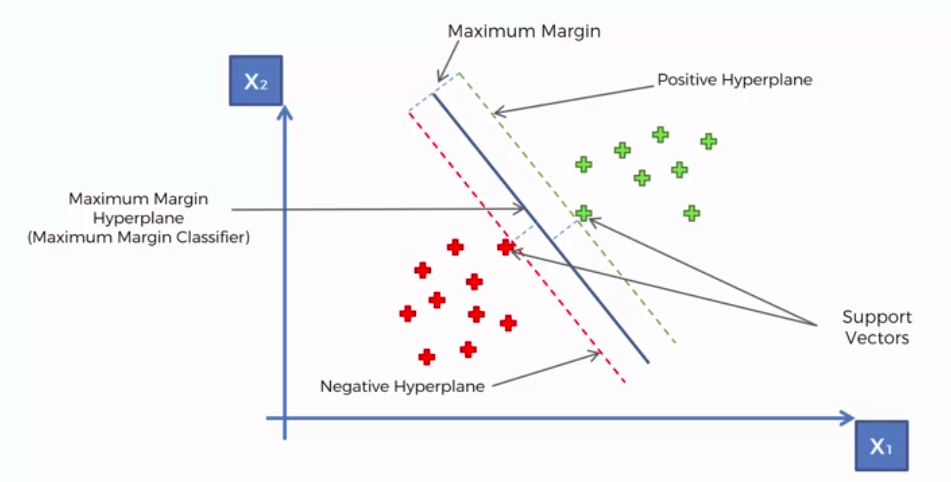
Whats so special about SVM?


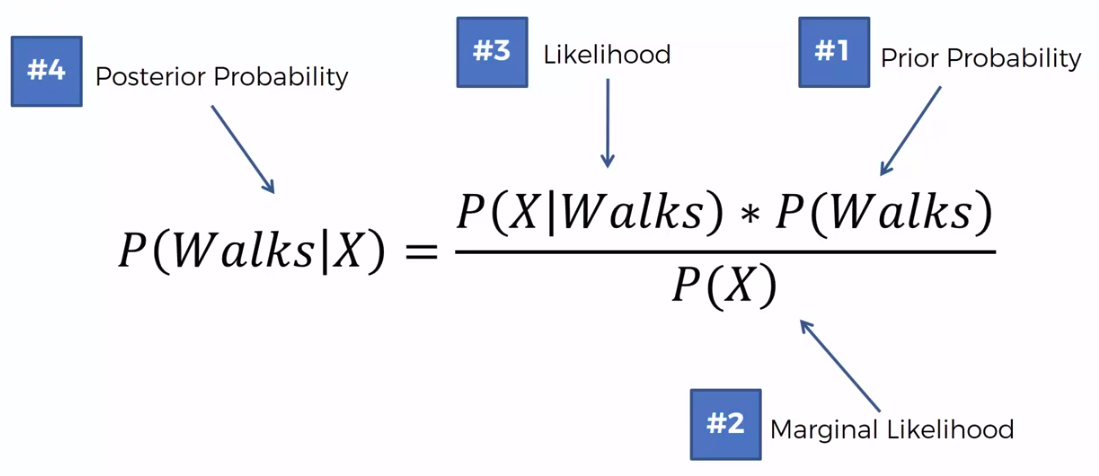
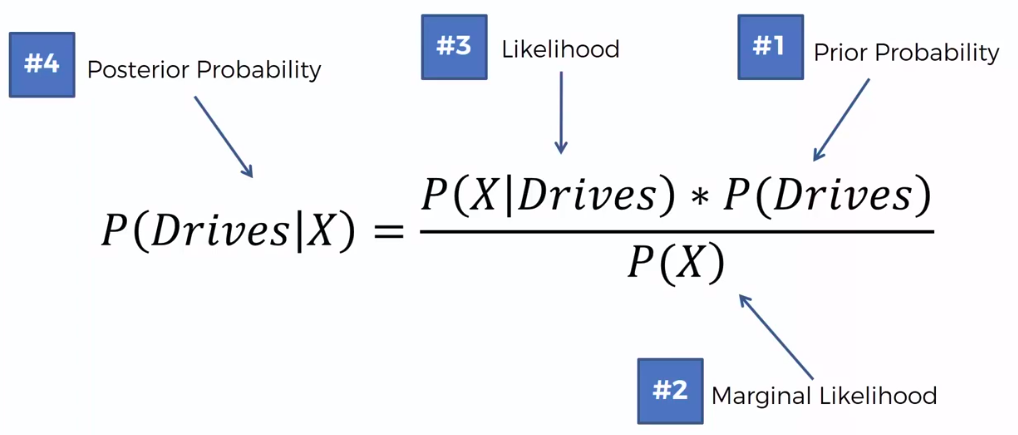
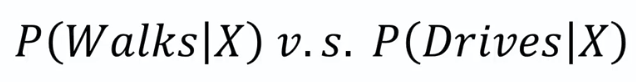
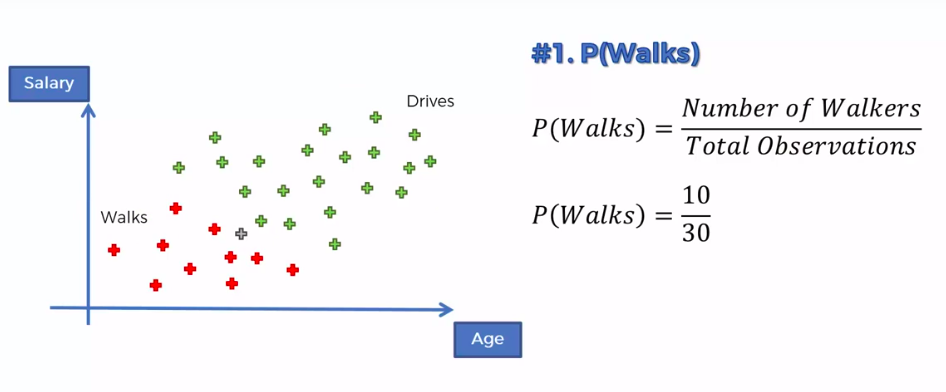
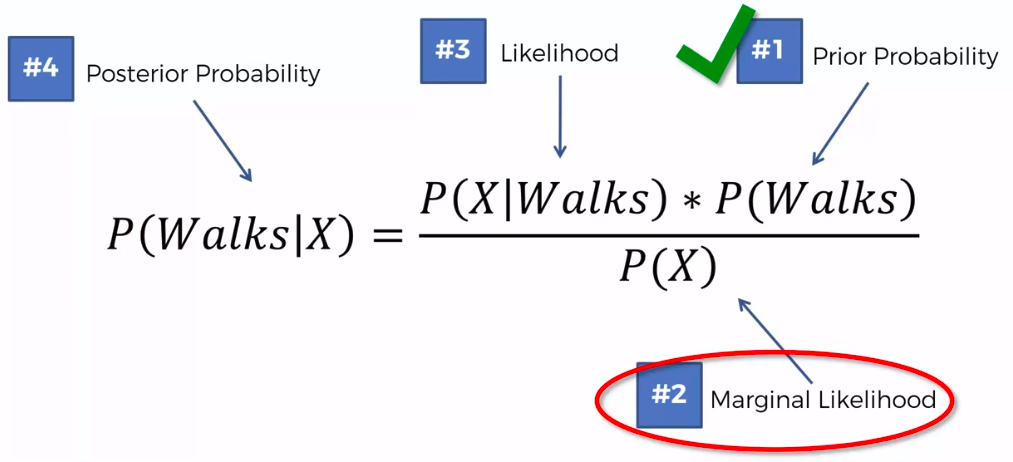
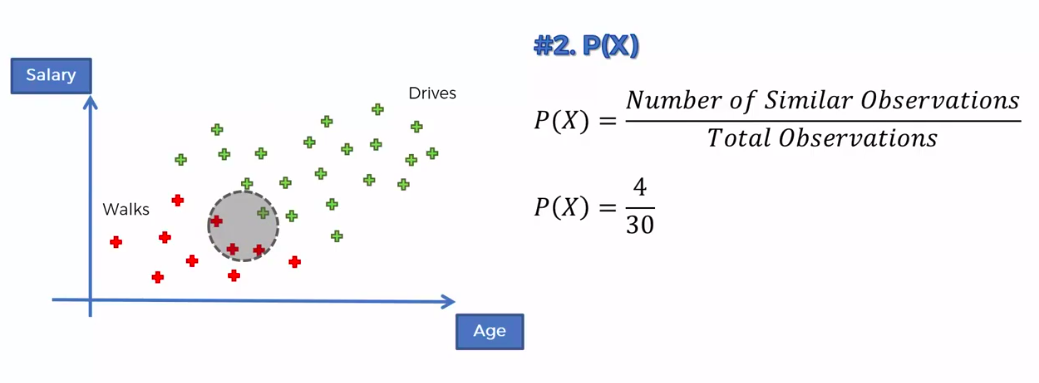
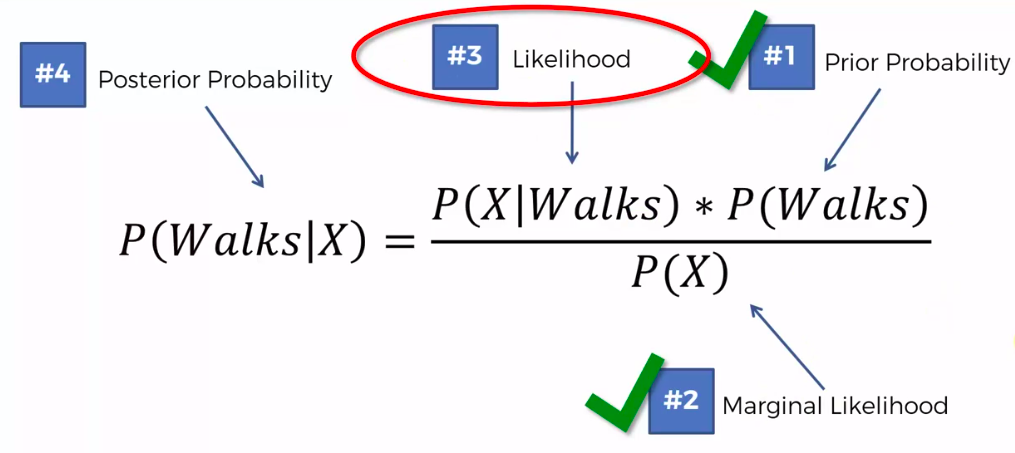
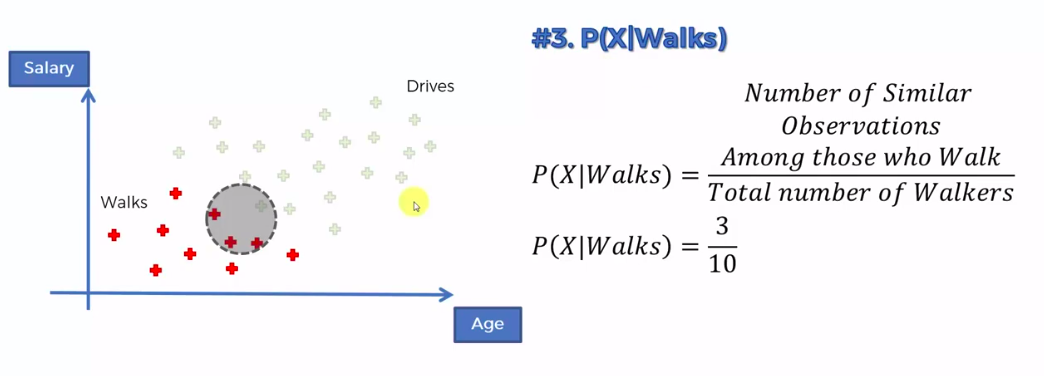
Naive Bayes
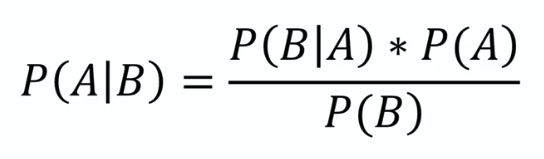
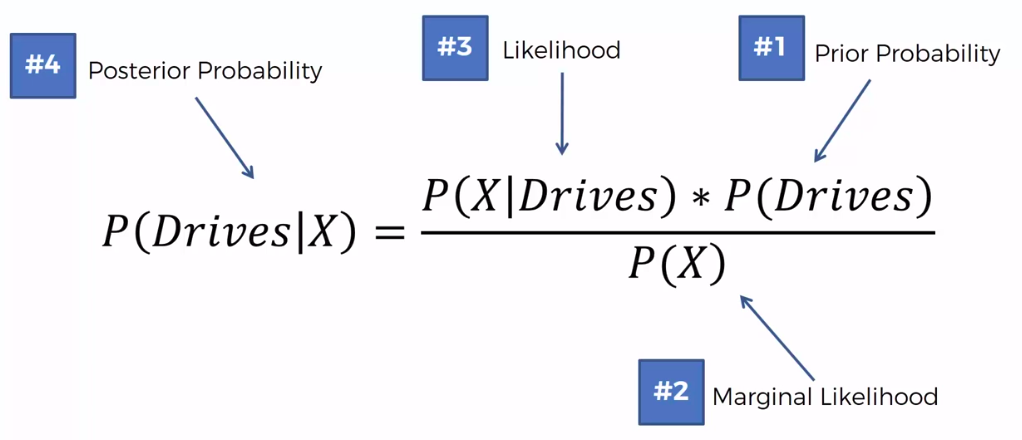
Bayes Theorem

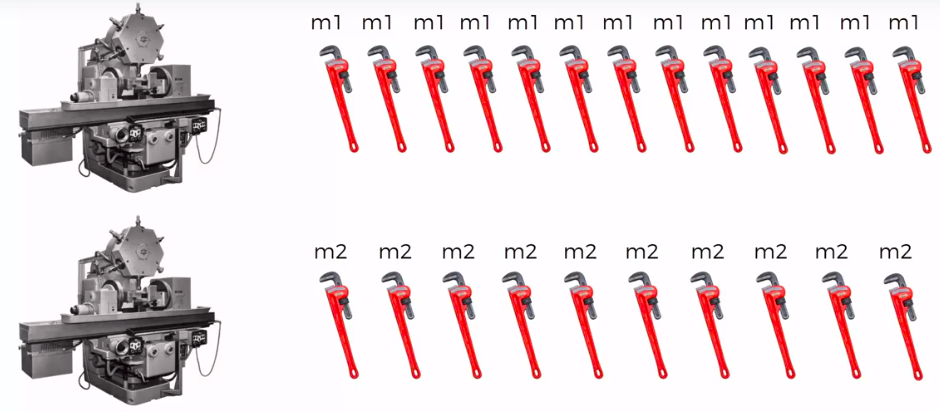


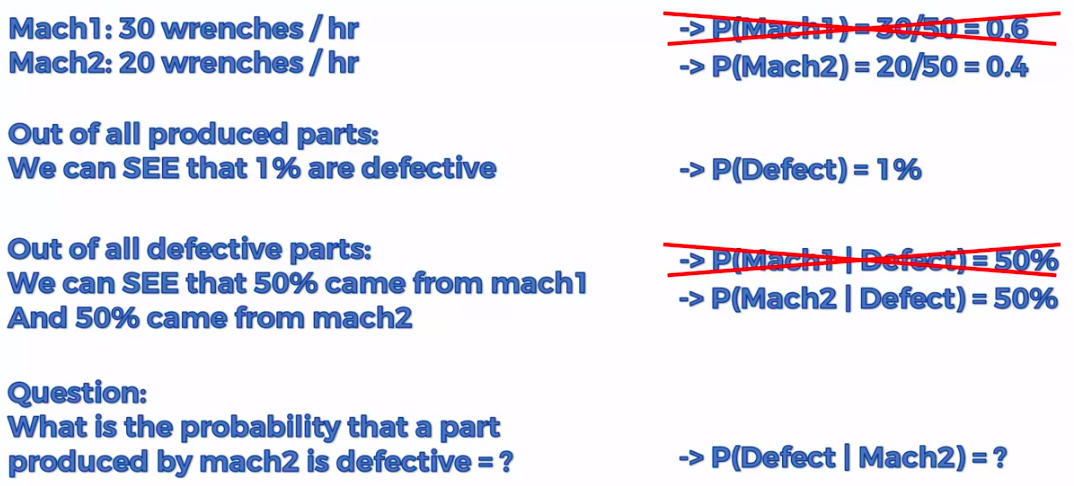
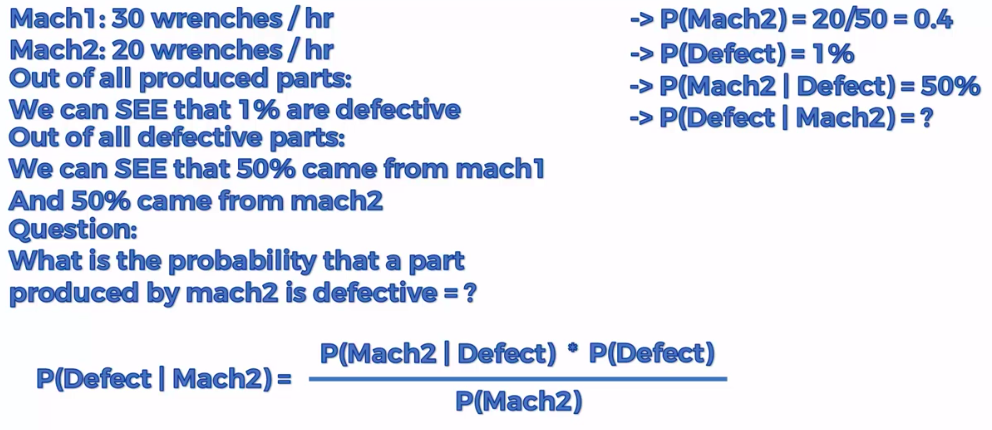
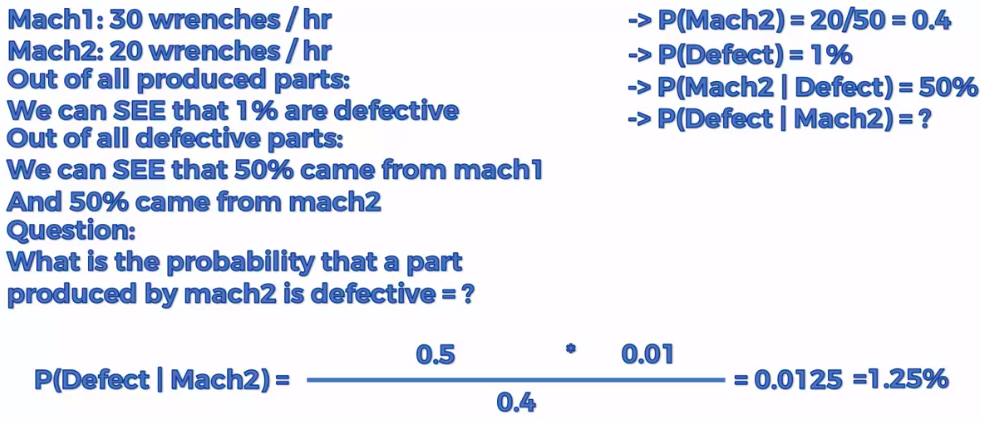
Defective Wrenche
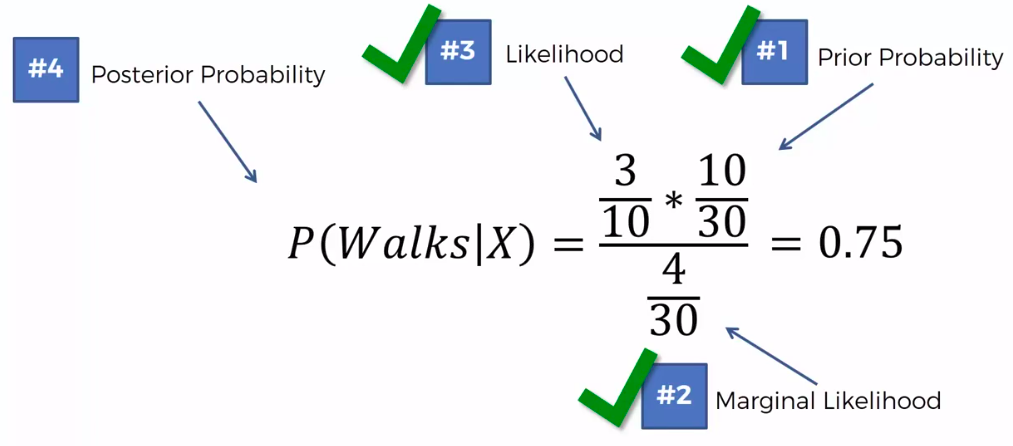
What's the probability?

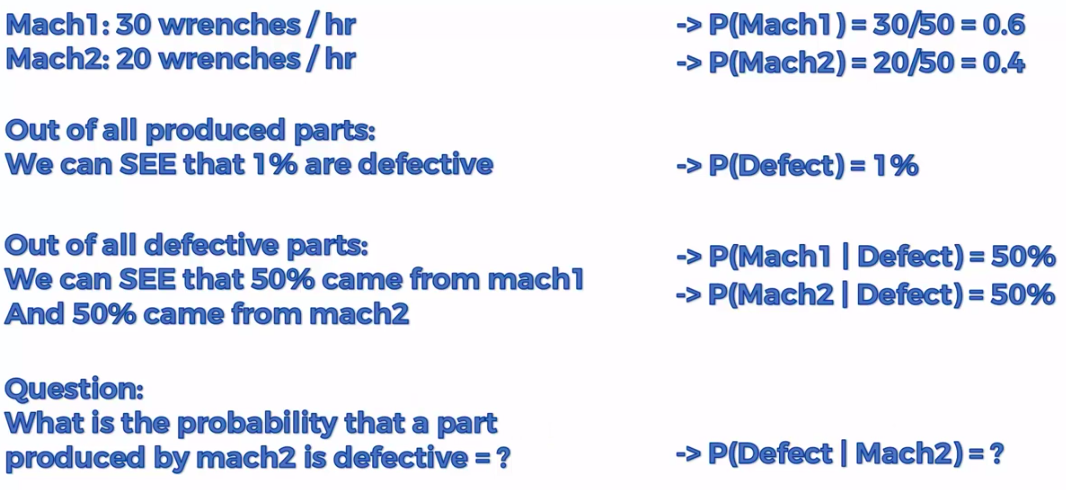
Mach1: 30 wrenches/hr
Mach2: 20 wrenches/hr
Out of all produced parts:
We can SEE that 1% are defective
Out of all defective parts:
We can SEE that 50% came from mach1 And 50% cam from mach2
Question:
What is the probability that a part produced by mach2 is defective = ?
Step 1
Step 2
Step 3
Assign class based on probability
Text
Ready ?
Step 1
Step 1
Step 1
Step 1
Step 1
Step 1
Step 2
Step 2
Step 3
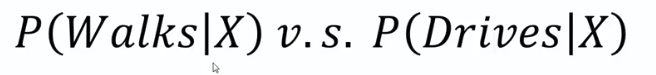
0.75 VS 0.25
0.75 > 0.25
Decision Tree
CART
Classification And Regression Trees
Classification Trees
Regression
Trees
Random Forest
Ensemble Learning

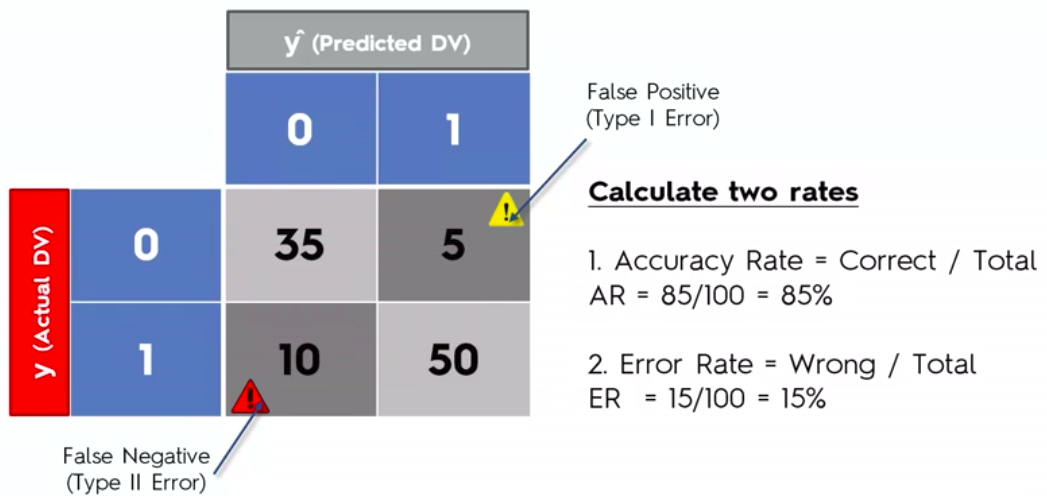
Evaluating Classifier Model Performance
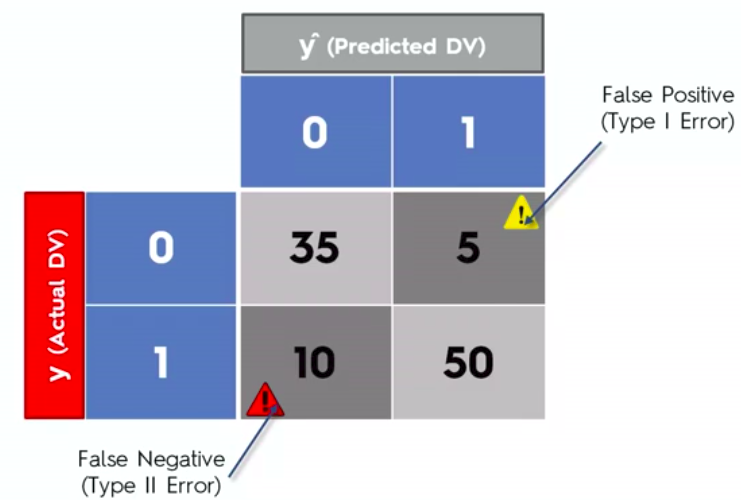
False Positives
&
False Negatives
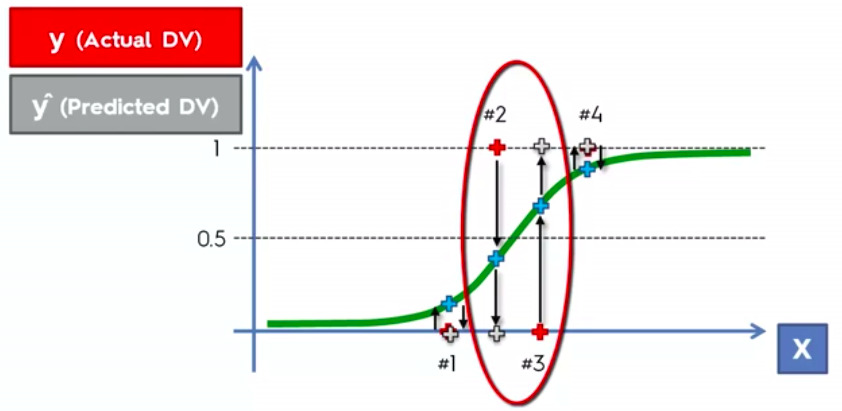
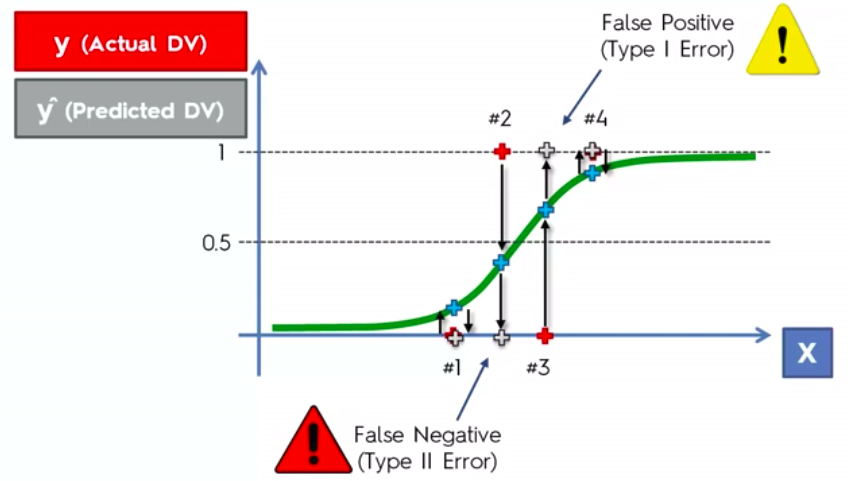
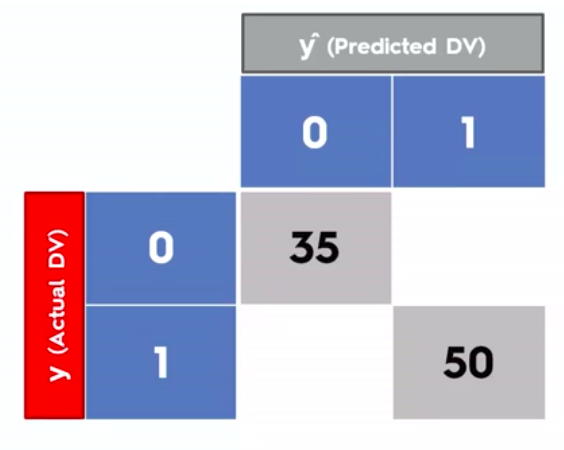
Confusion Matrix
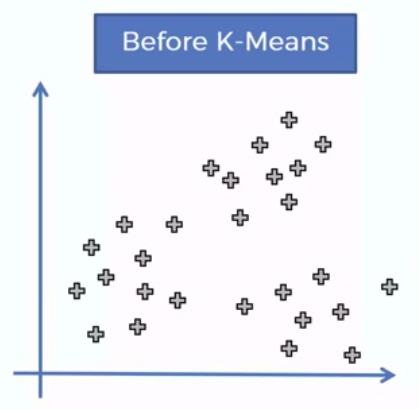
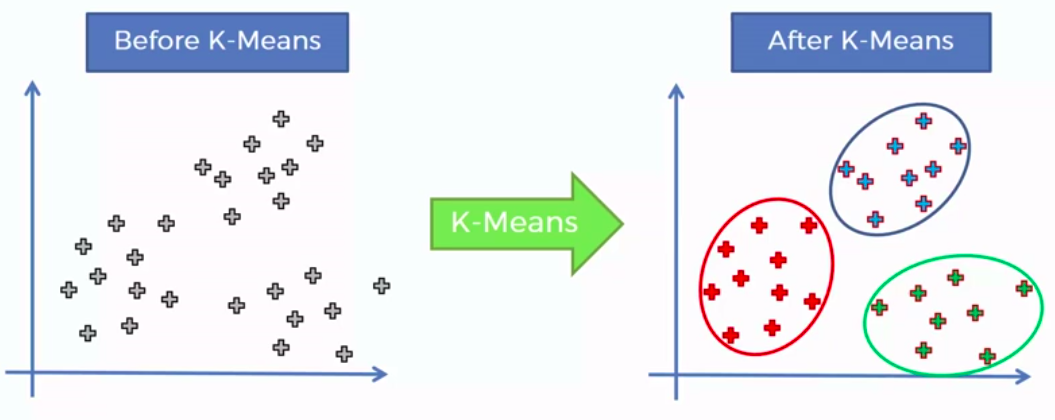
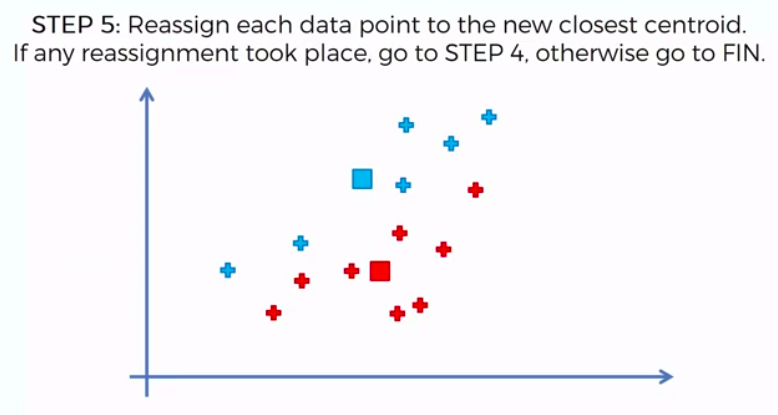
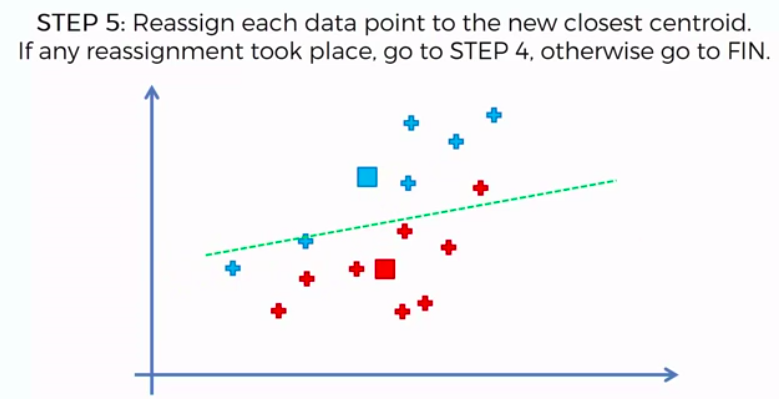
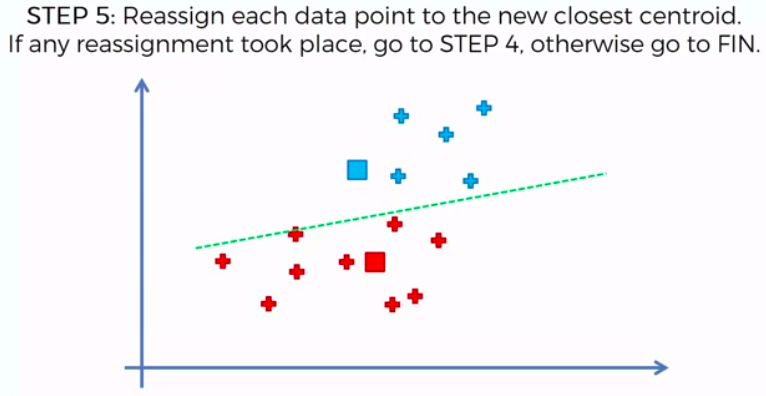
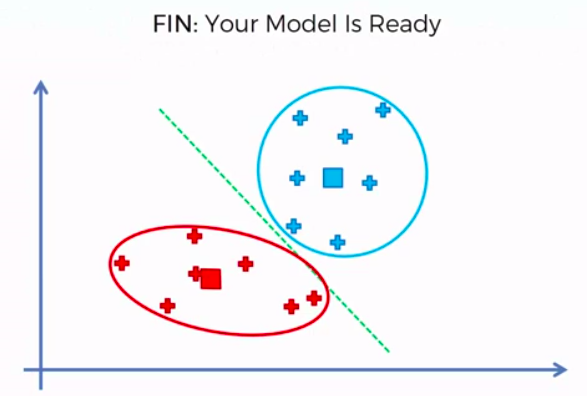
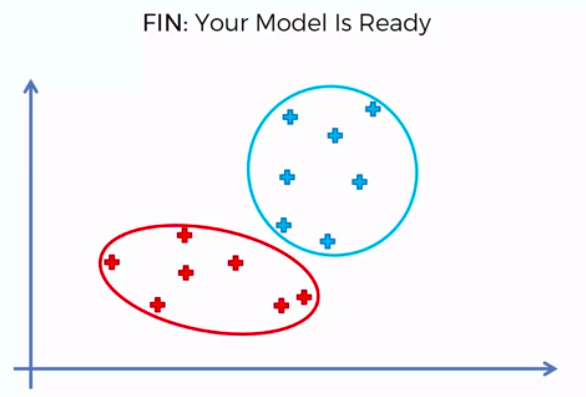
Clustering
Clustering is similar to classification, but the basis is different. In Clustering we don’t know what we are looking for, and we are trying to identify some segments or clusters in our data. When we use clustering algorithms on our dataset, unexpected things can suddenly pop up like structures, clusters and groupings we would have never thought of otherwise.
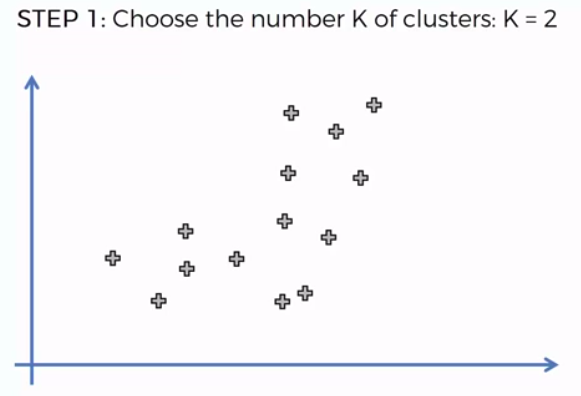
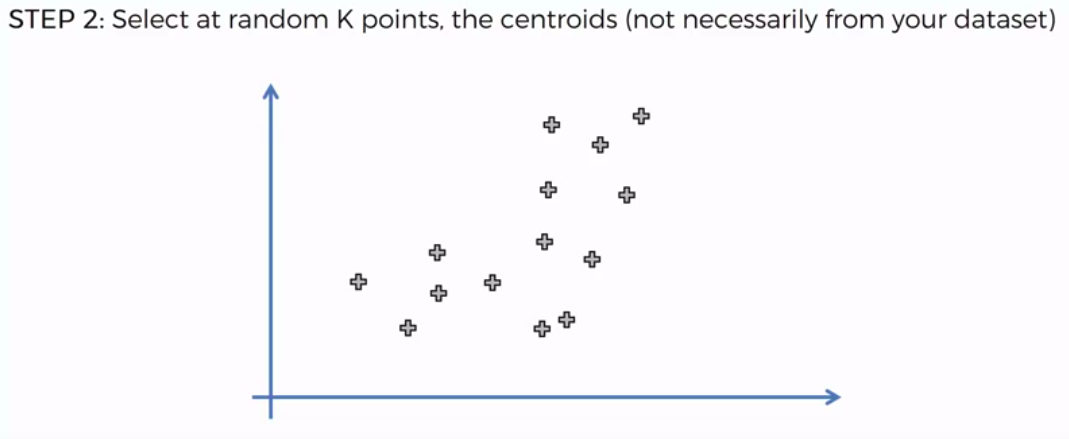
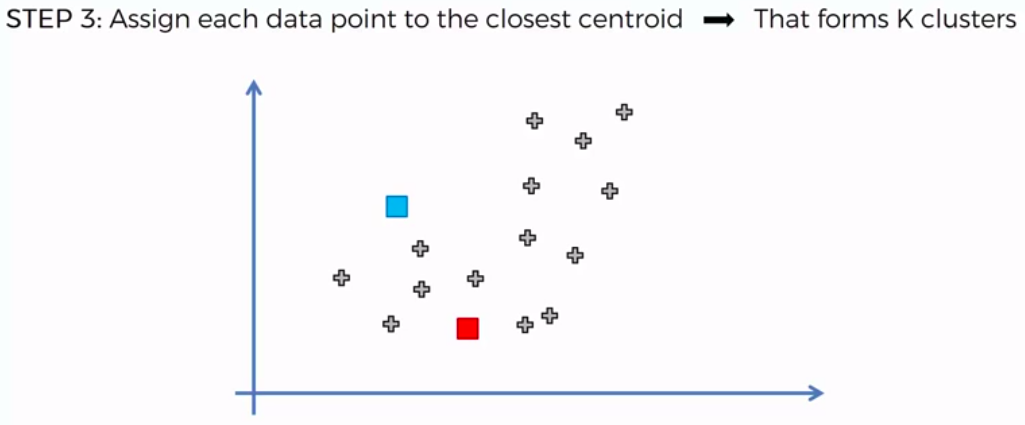
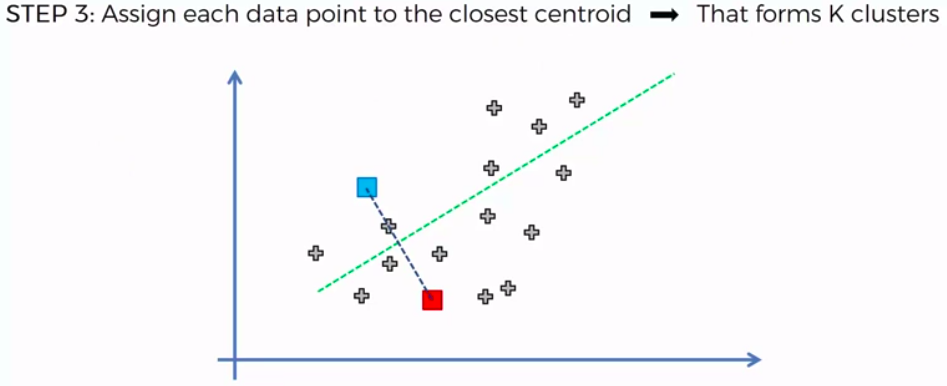
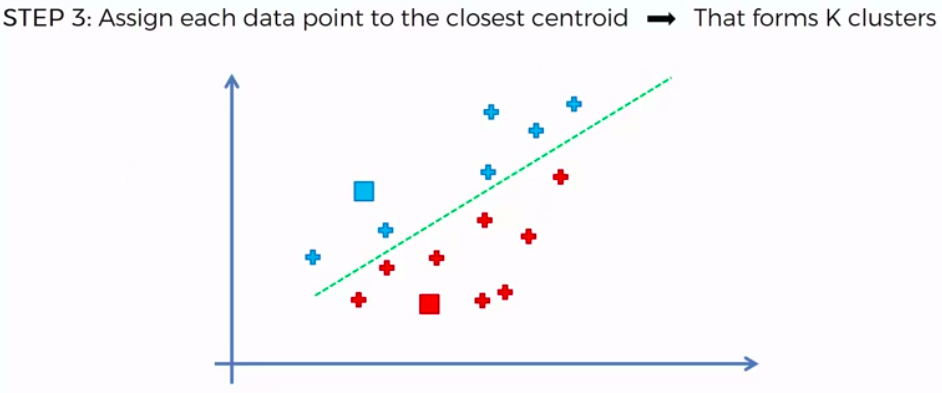
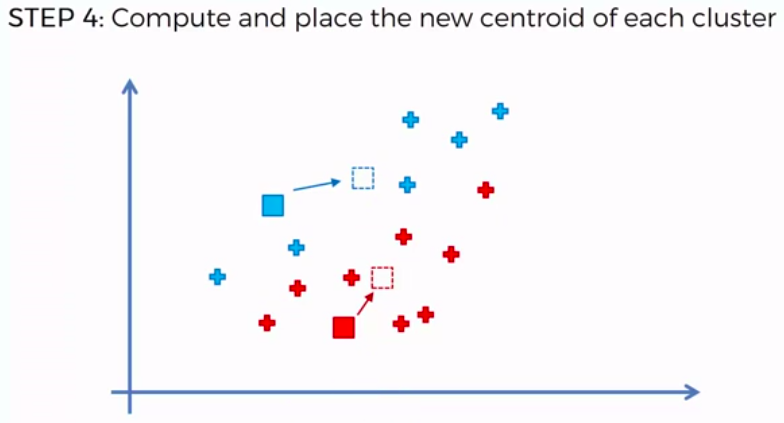
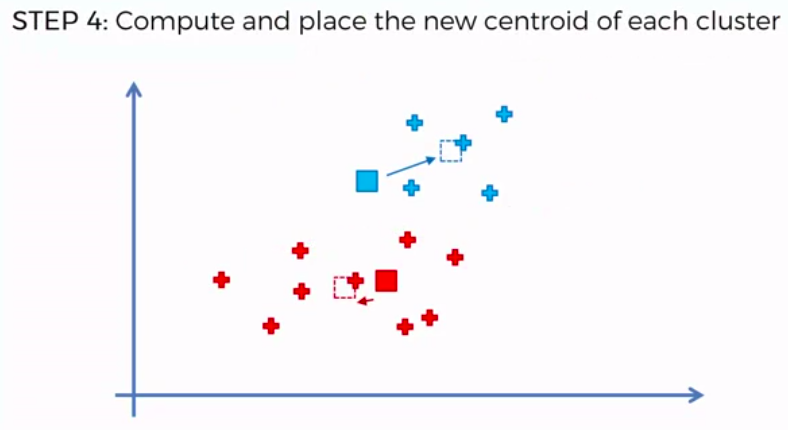
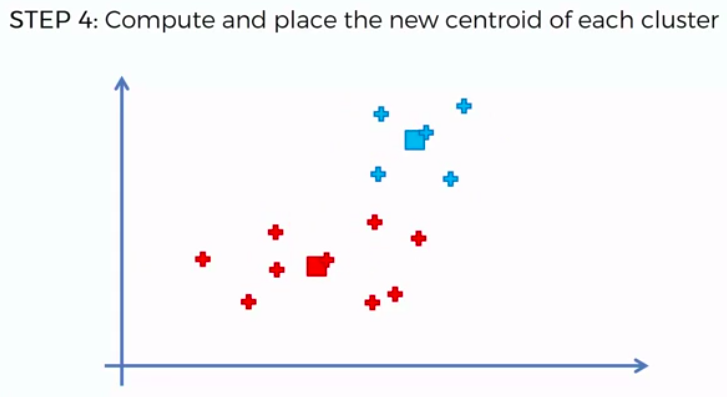
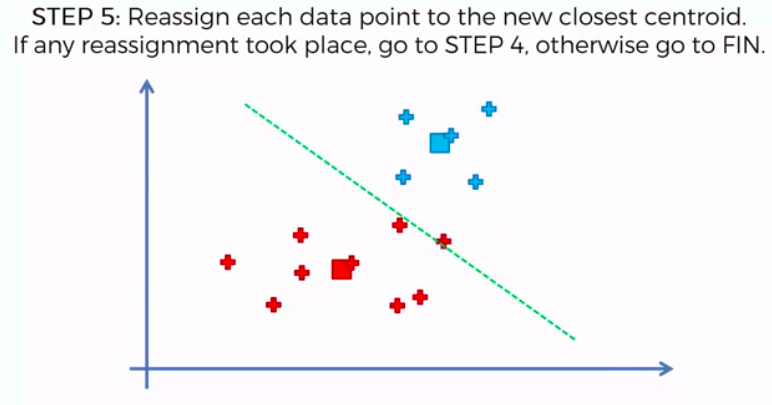
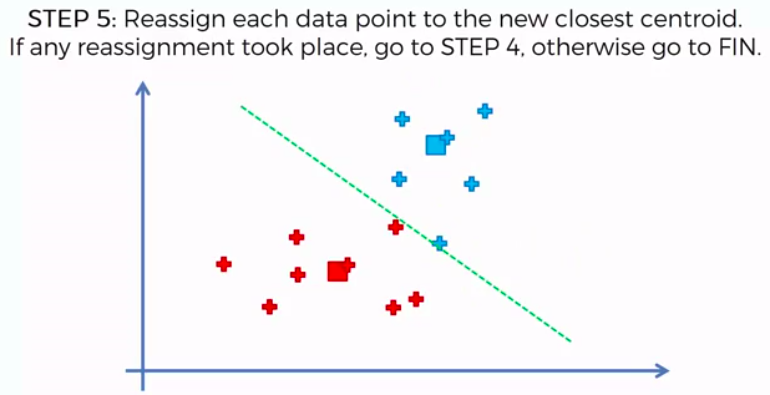
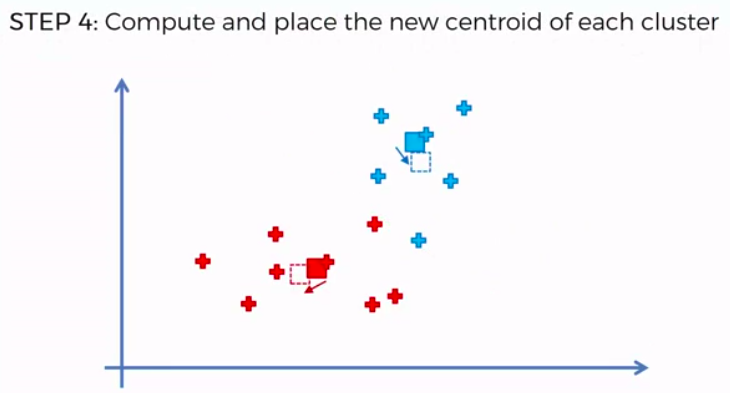
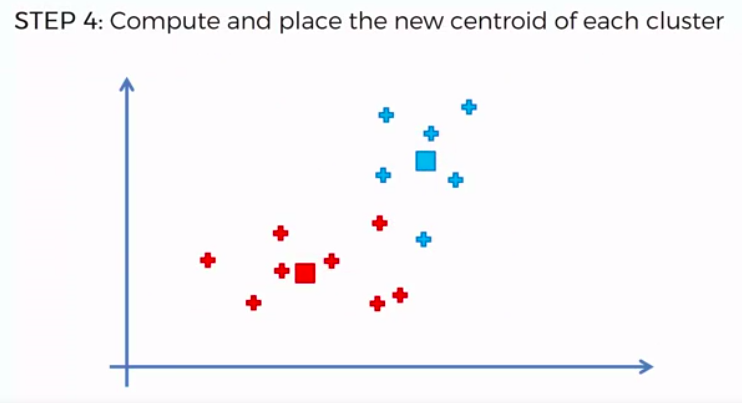
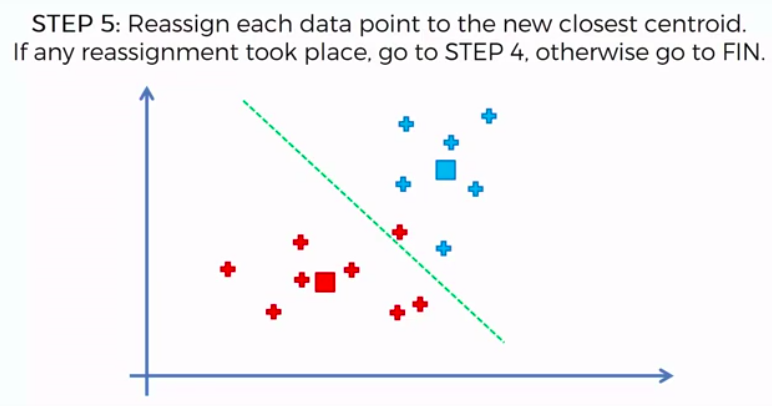
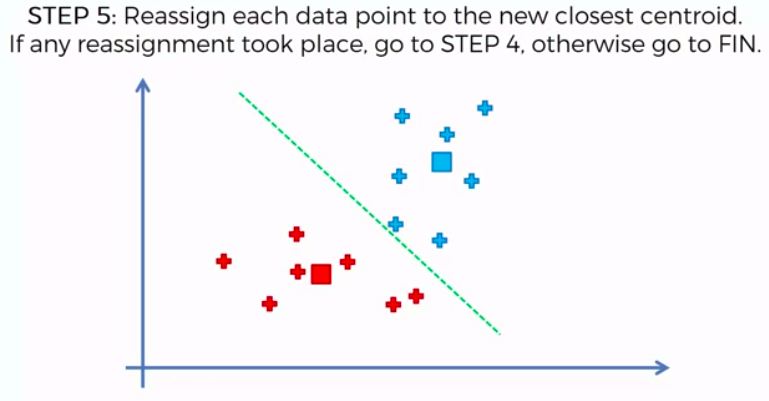
K-Means Clustering
We can apply K-Means for different purposes:
- Market Segmentation,
- Medicine with for example tumor detection,
- Fraud detection
- to simply identify some clusters of your customers in your company or business.
Association Rule Learning
(Apriori)


People who bought also bought ...
ARL:
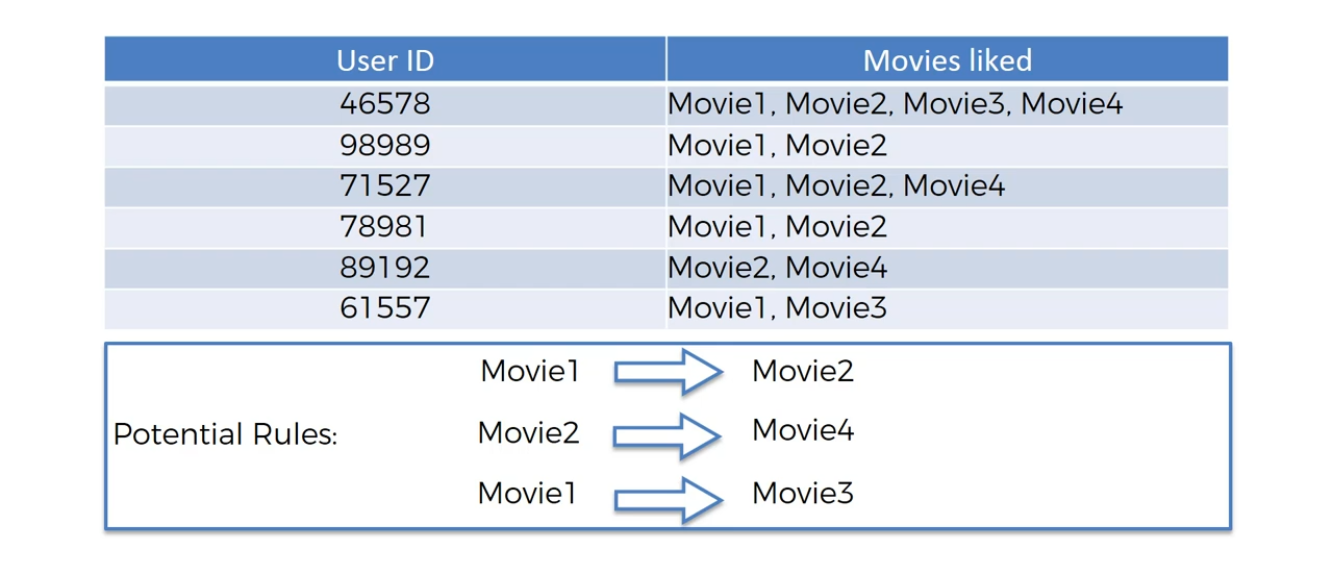
Movie Recommendation
ARL:
Market Basket Optimisation

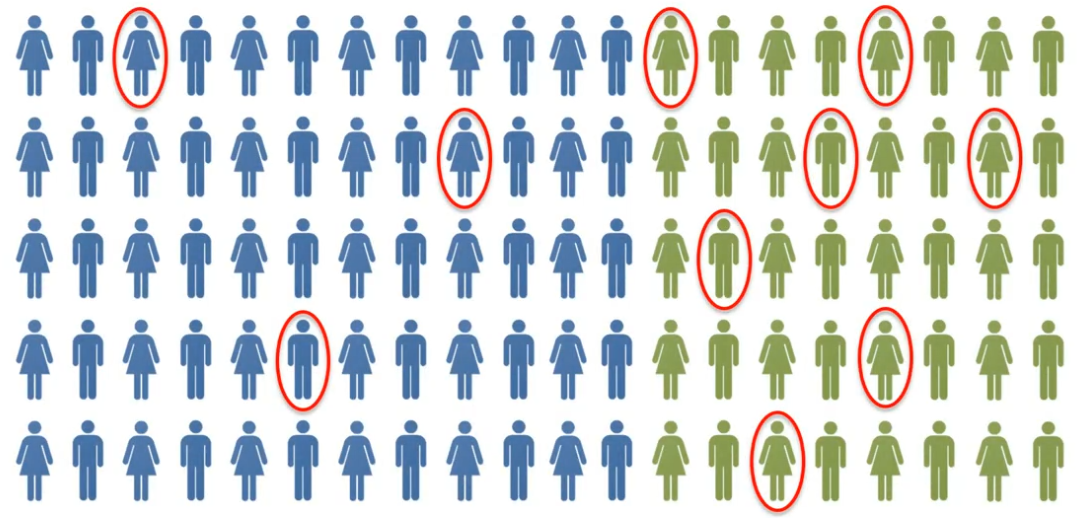
Step 1:
Find Support
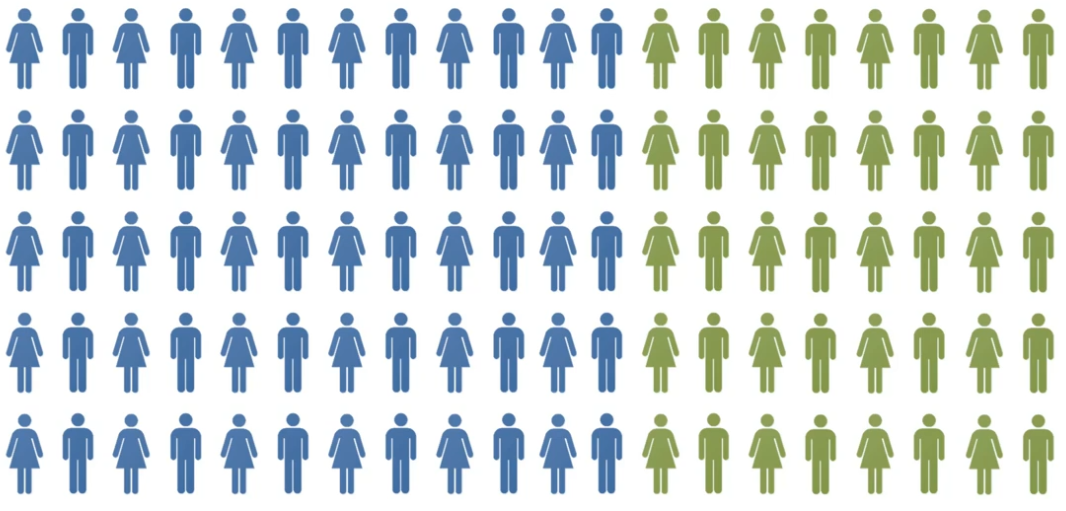
Apriori - Support
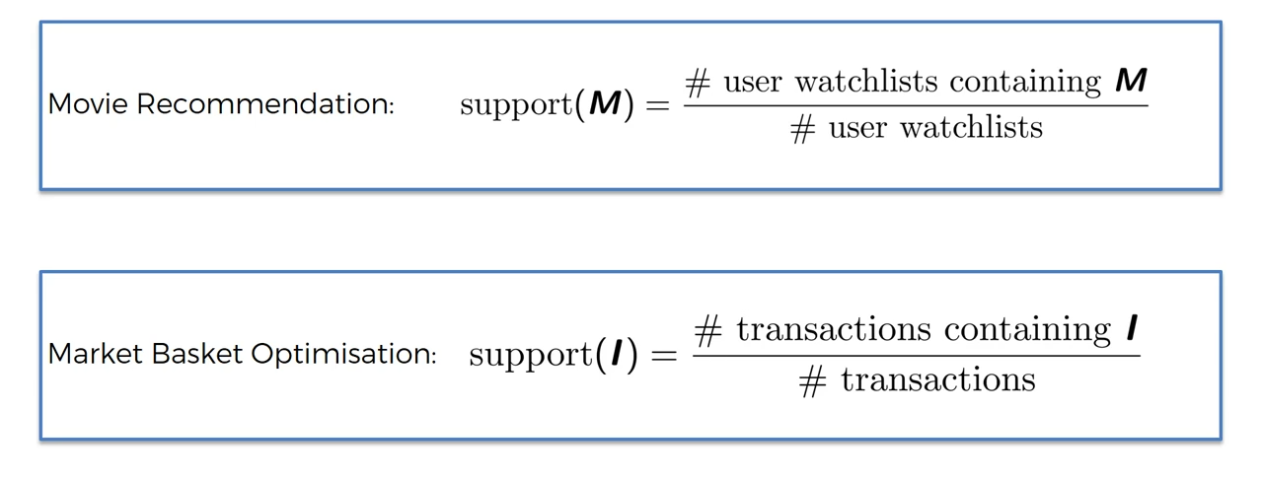
Apriori - Support
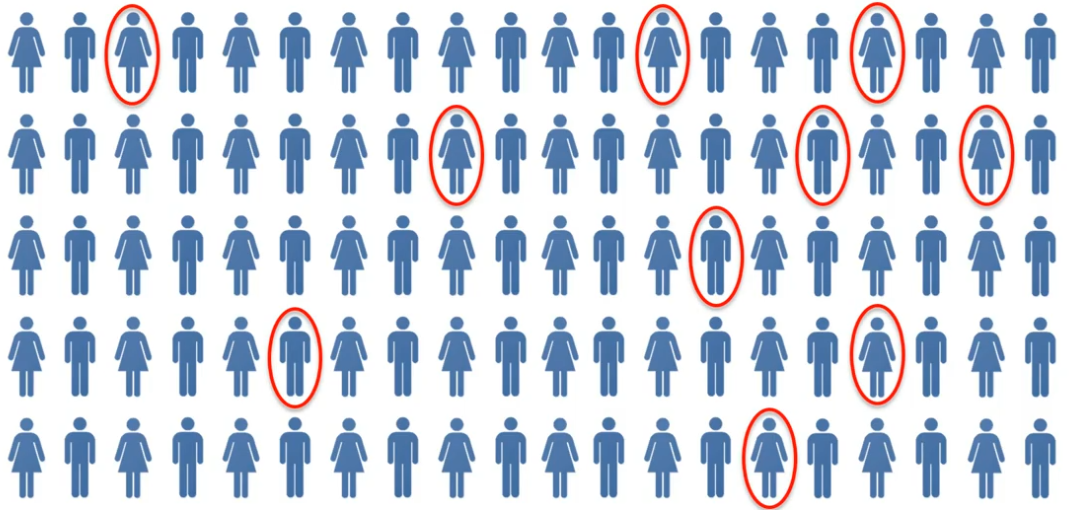
Apriori - Support
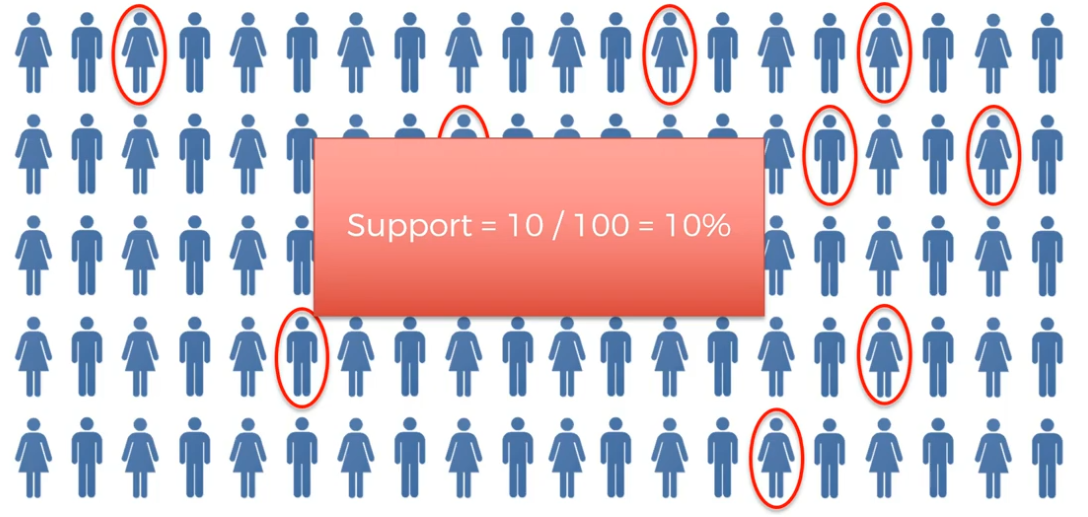
Apriori - Support
Step 2:
Find Confidence
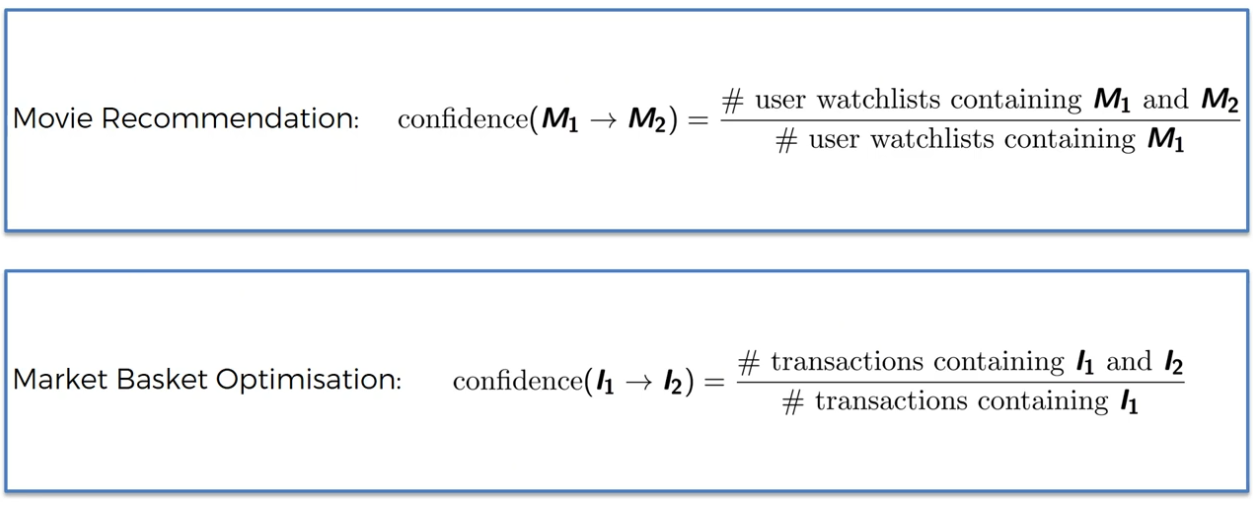
Apriori - Confidence
Apriori - Confidence

Apriori - Confidence
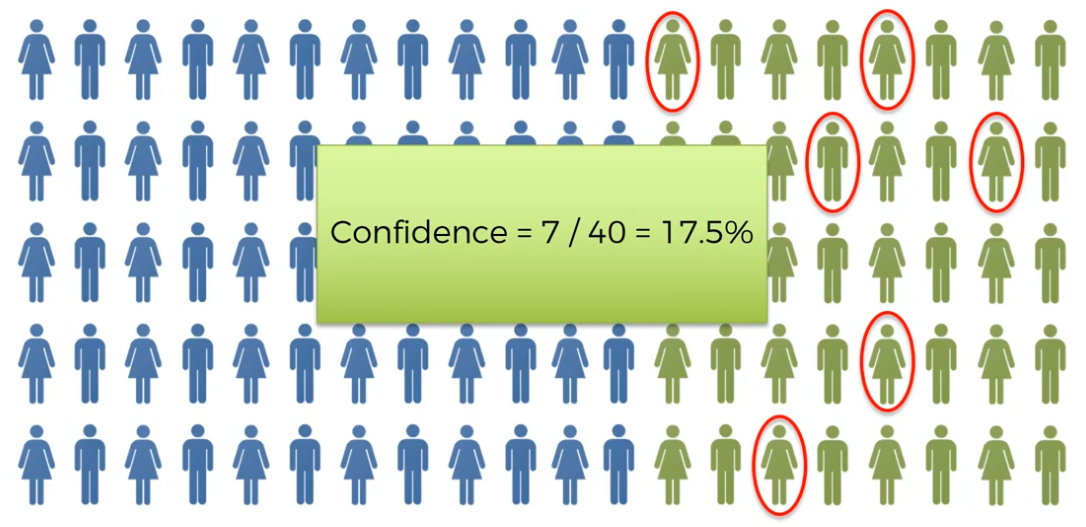
Apriori - Confidence
Step 3:
Calculate Lift
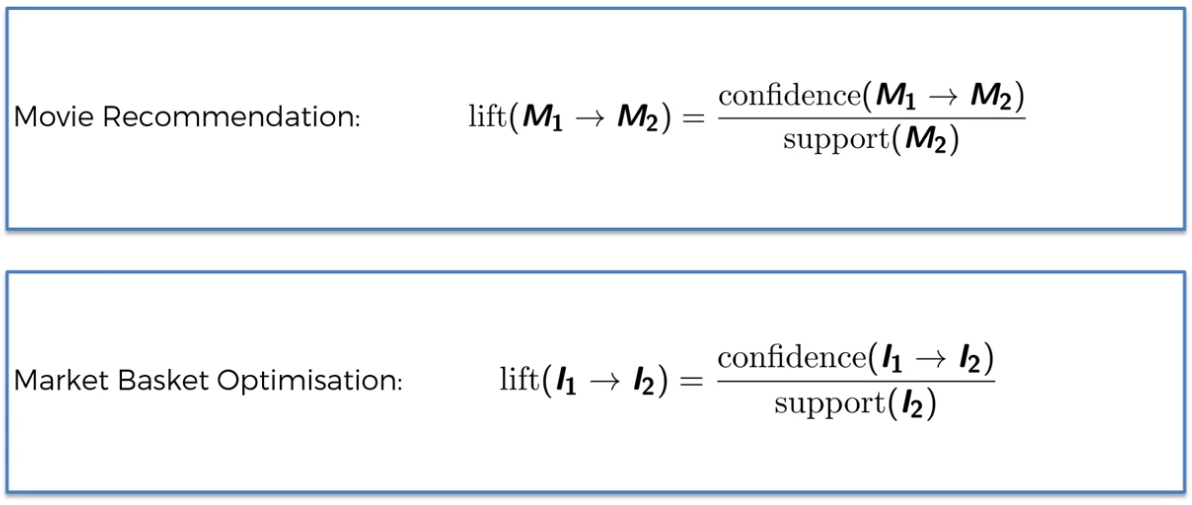
Apriori - Lift
Apriori - Lift
Apriori - Lift
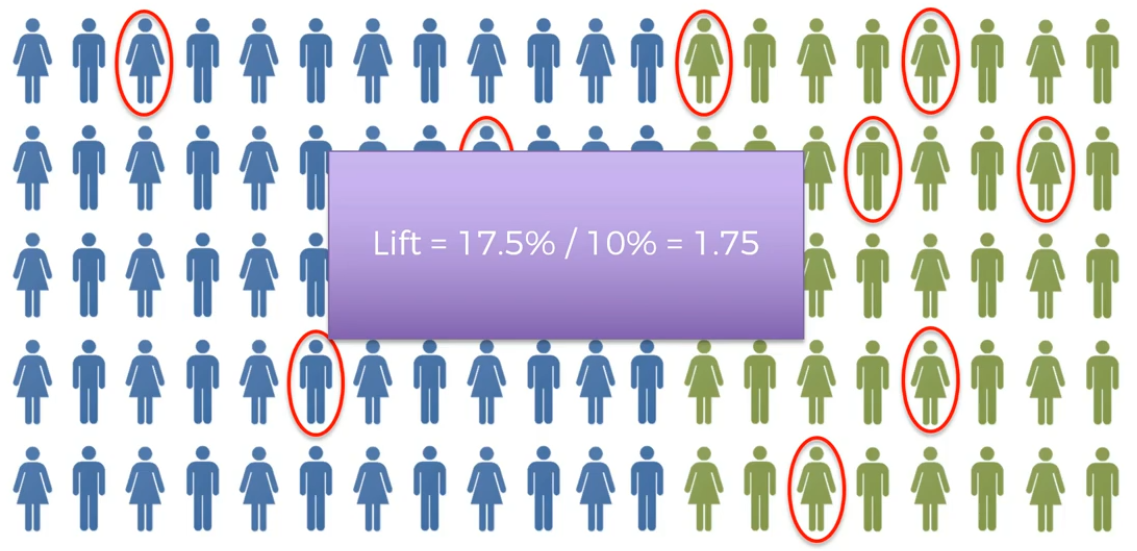
Apriori - Lift
THANK YOU
JPK- Training BDA
By Abdullah Fathi
JPK- Training BDA
Introduction to BDA and Machine Leaning


