Power Chart
George Zou
@georgezouq
一个为BI而生的图表组件

什么是 商业智能?
商业智能通常被理解为将企业中现有的资料转化为知识,帮助企业做出明智的业务经营决策的工具。


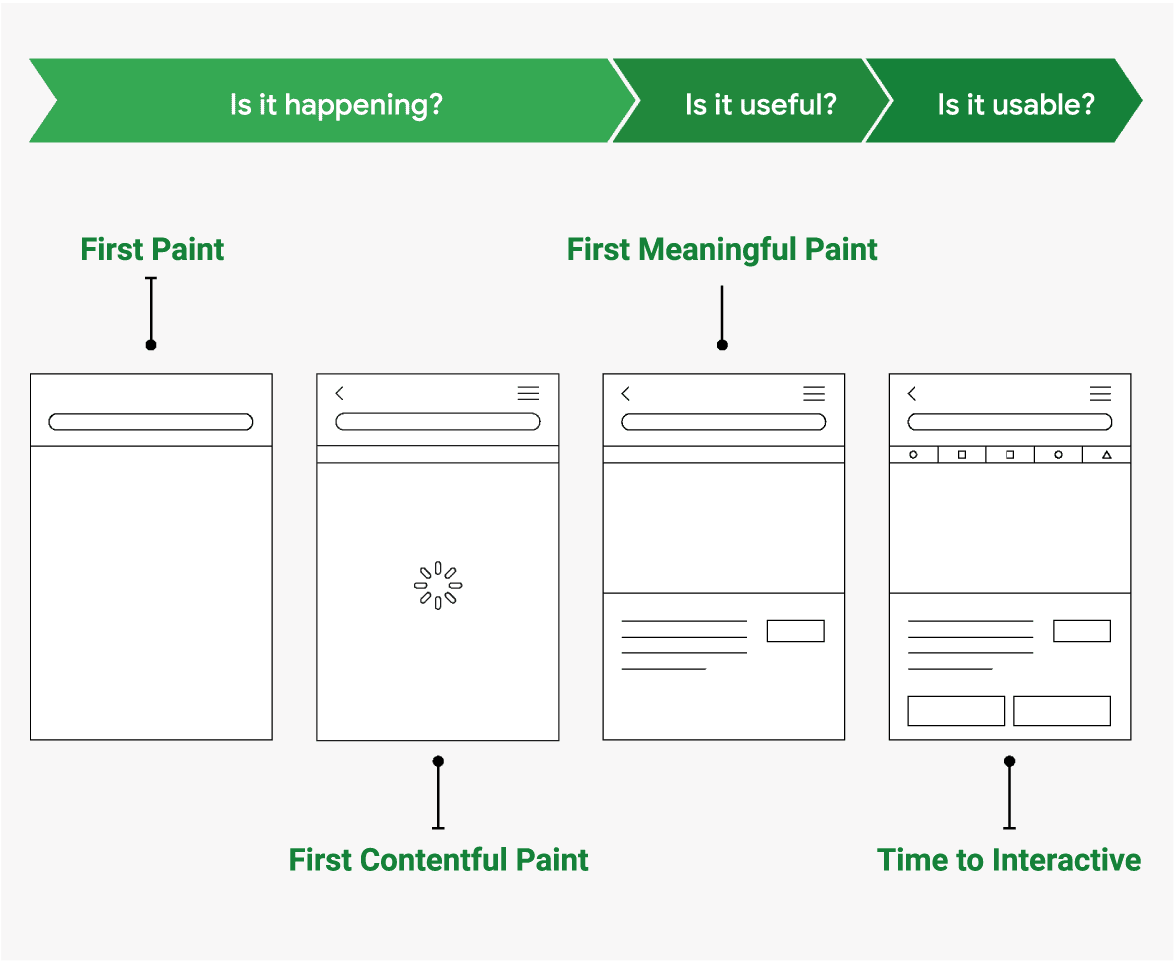
Speed feedback
Speed metrics
Budgets


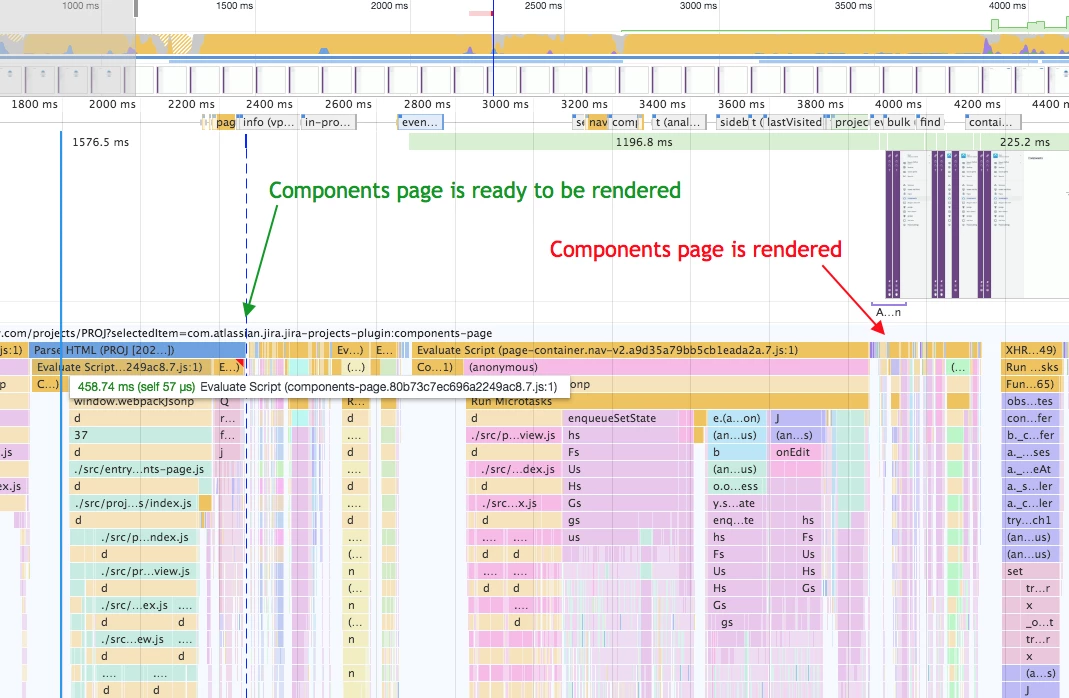
~1.2 seconds

~1.4 seconds
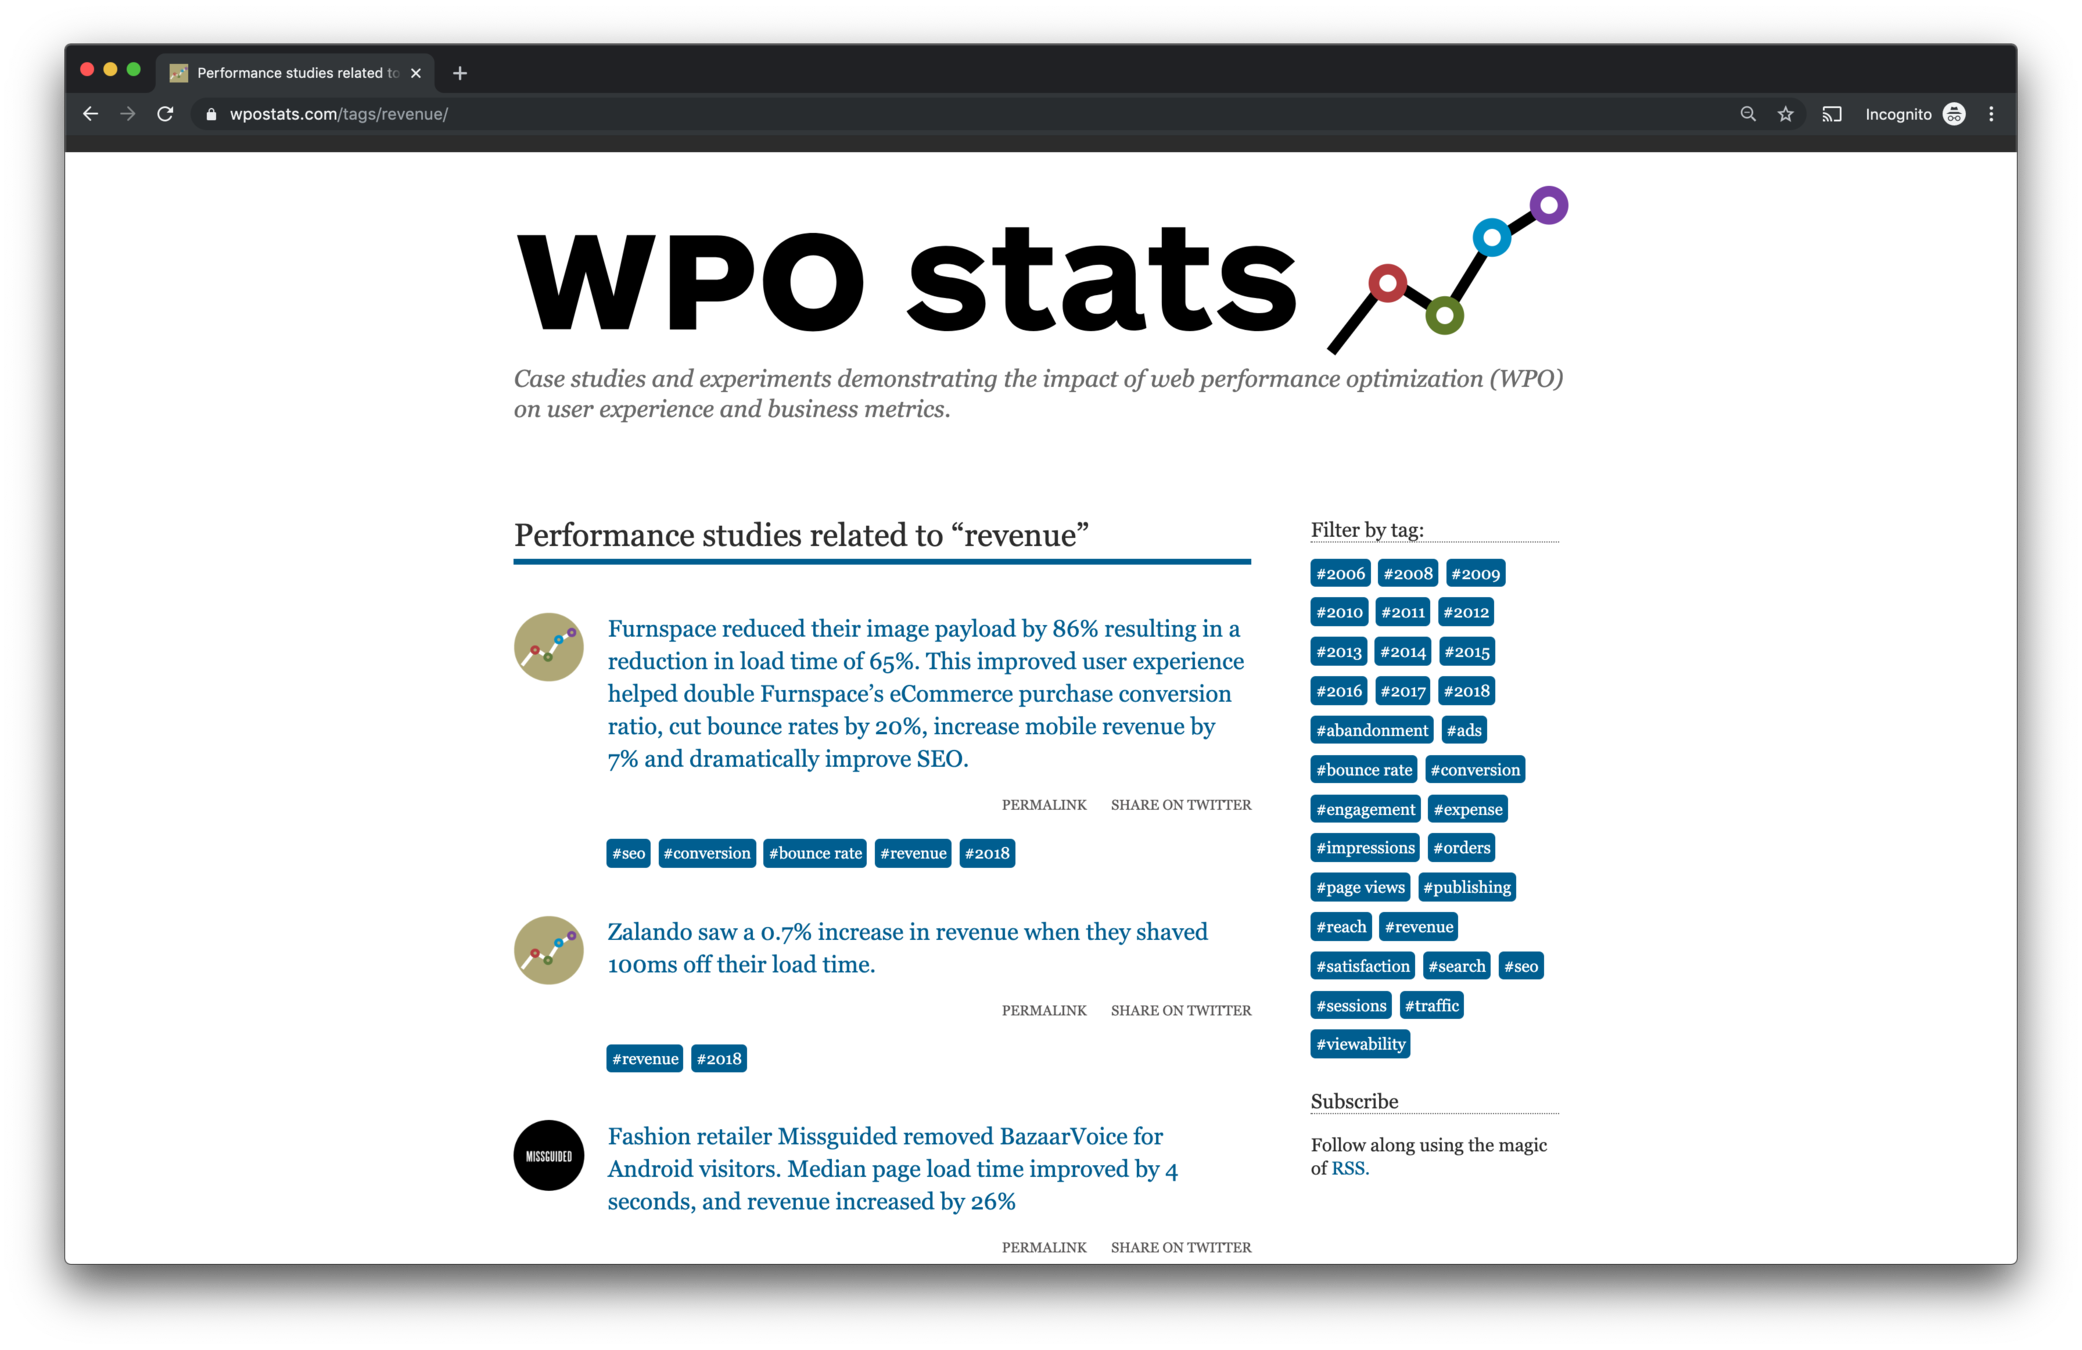
wpostats.com
How about 5G ?
A real picture of internet in the world
How faster is that?
Download speeds for anywhere from 100 Mb to 10Gbit per second. 5G is expected to be as much as 10-100 times faster than 4G. Plus: 4G gets improved as a side effect as well
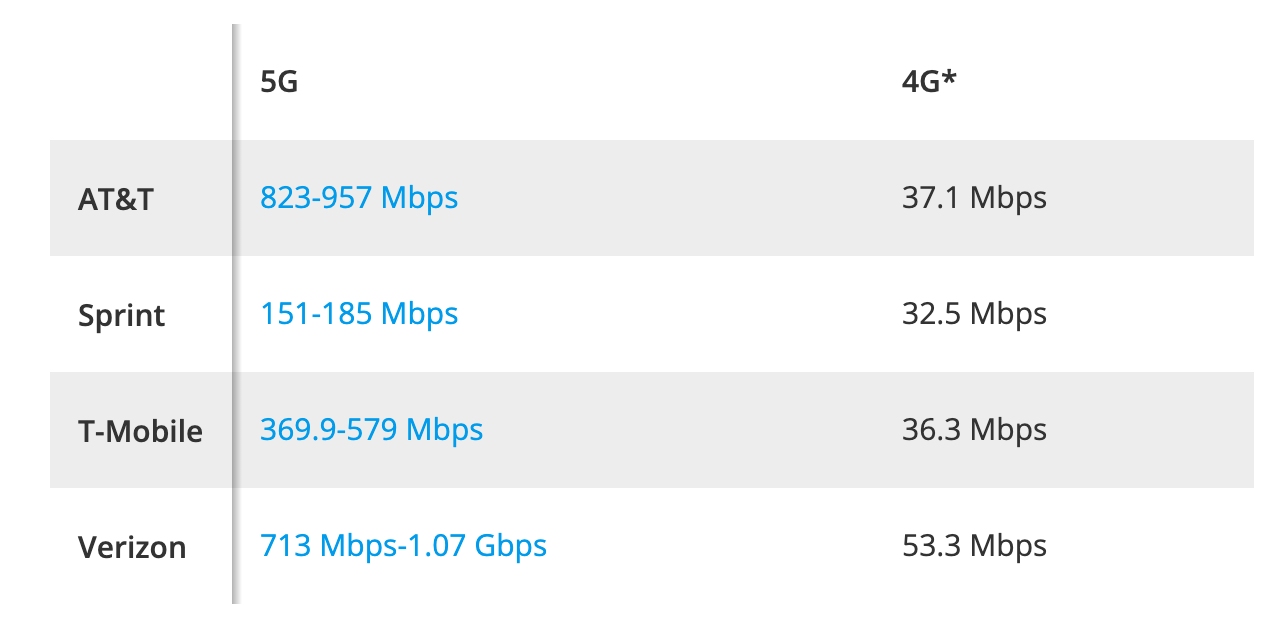
Downloading 1 episode of Game of Thrones within 90 sec (4K) or 35 sec (1080p), or fetching the entire season in 15 mins (4K)
You ready ?
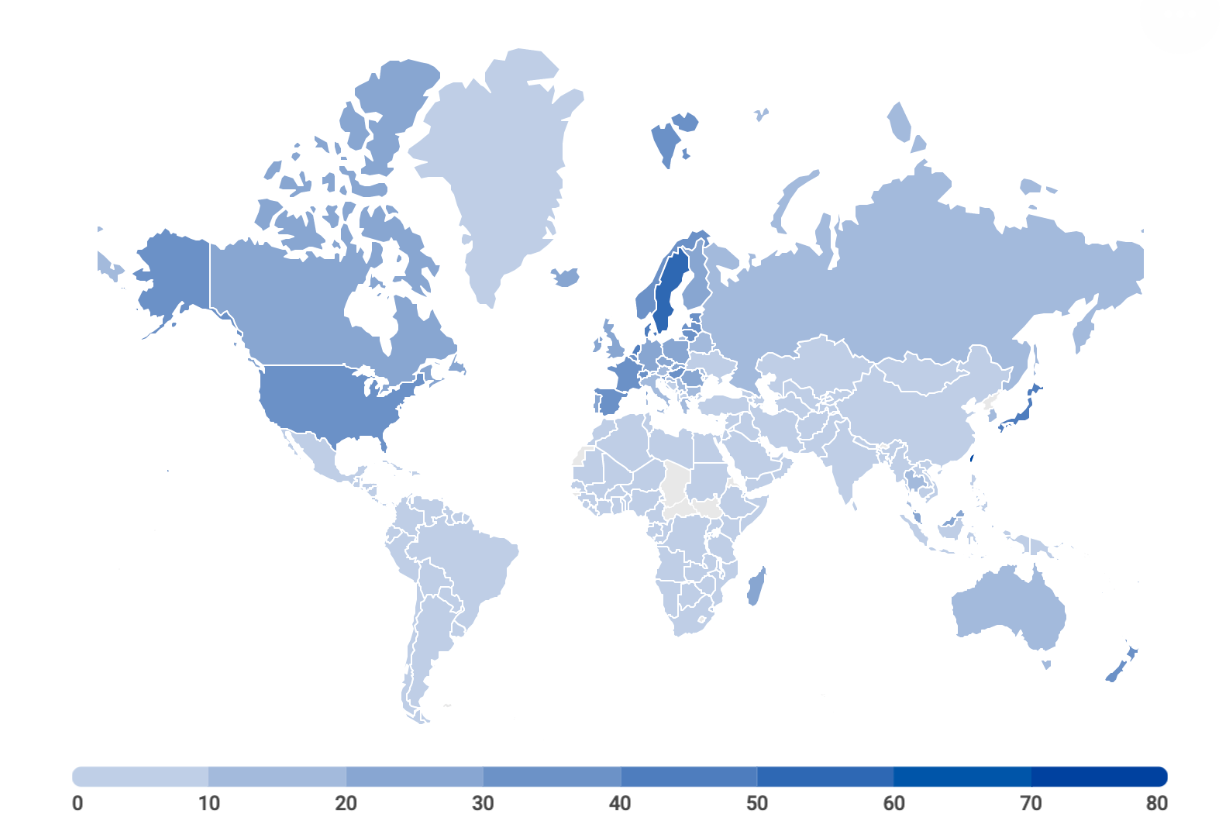

4
64
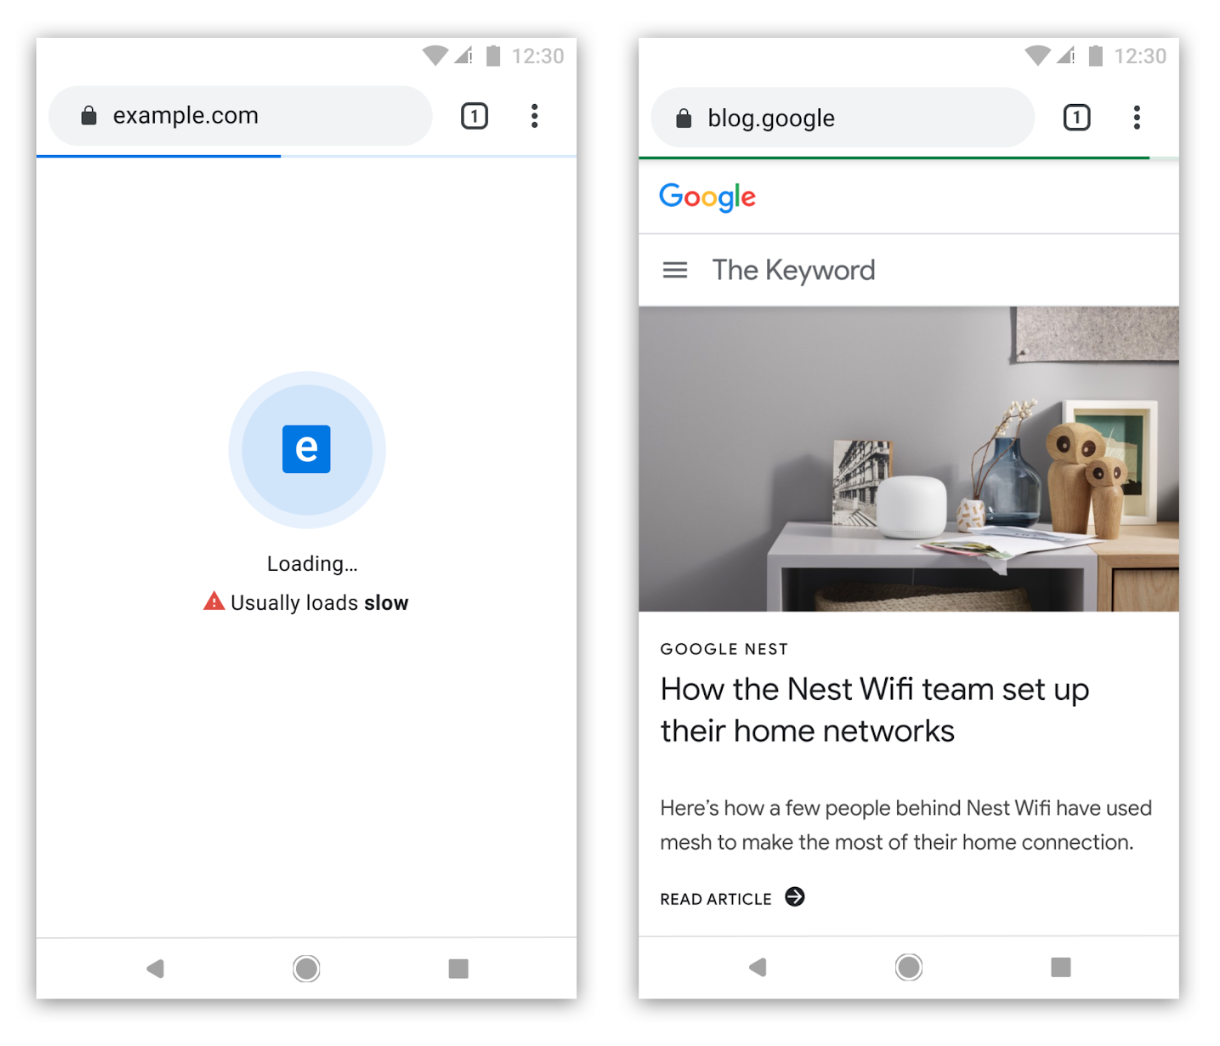
Measuring Performance
A real picture of internet in the world
Step 1: Define baselines
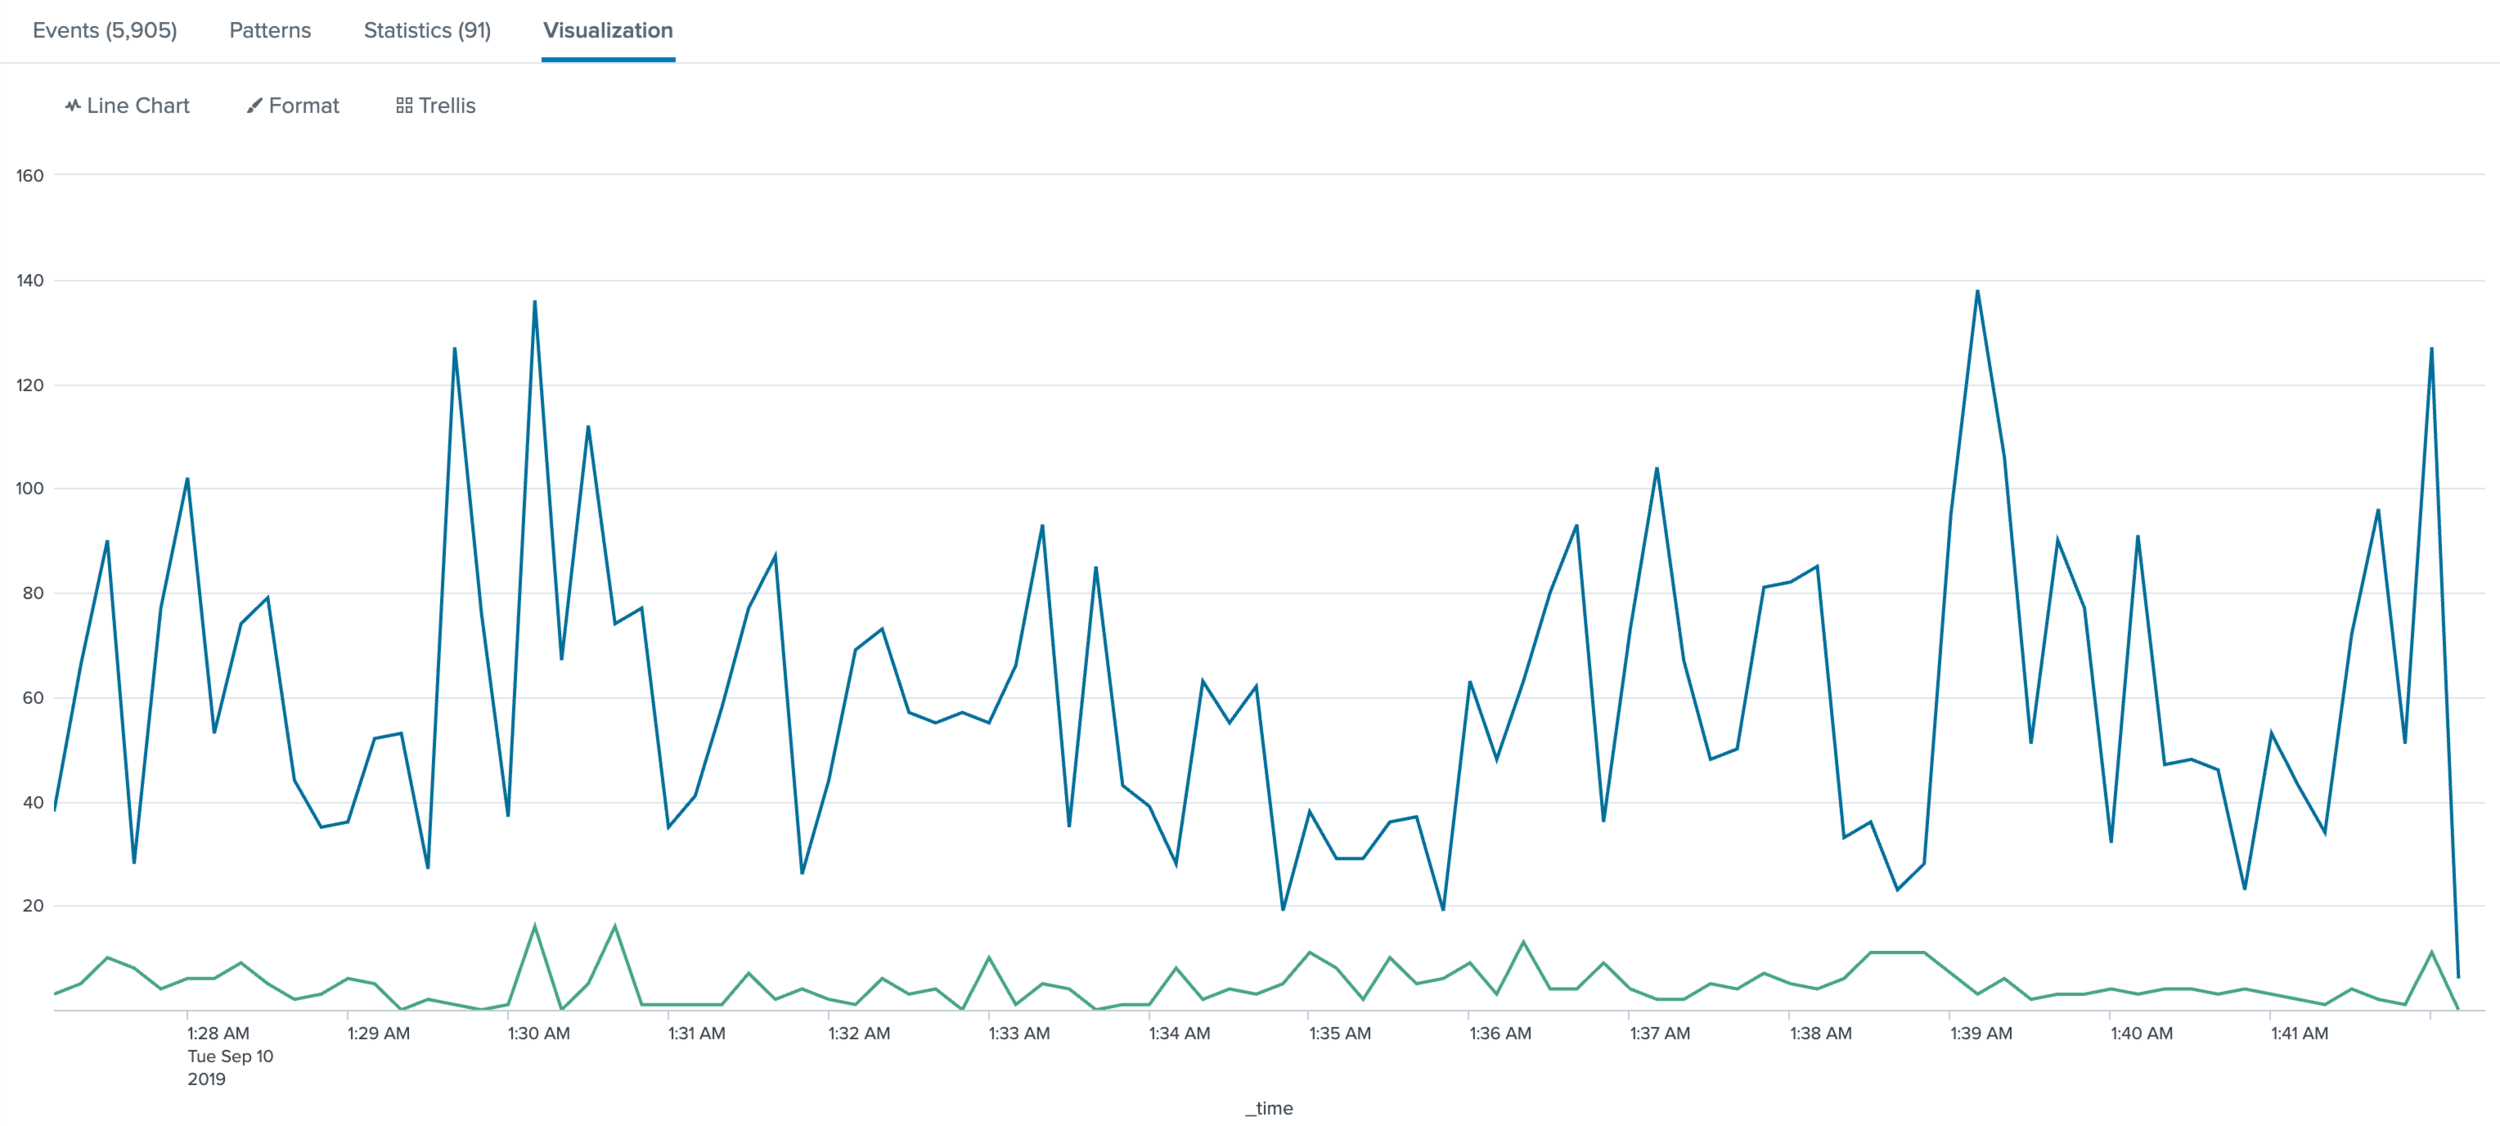
Page load errors
APDEX
(SATISFIED COUNT)
+
(TOLERATING COUNT / 2)
TOTAL SAMPLES
=
APDEX
170 + (20 / 2)
200
90
60

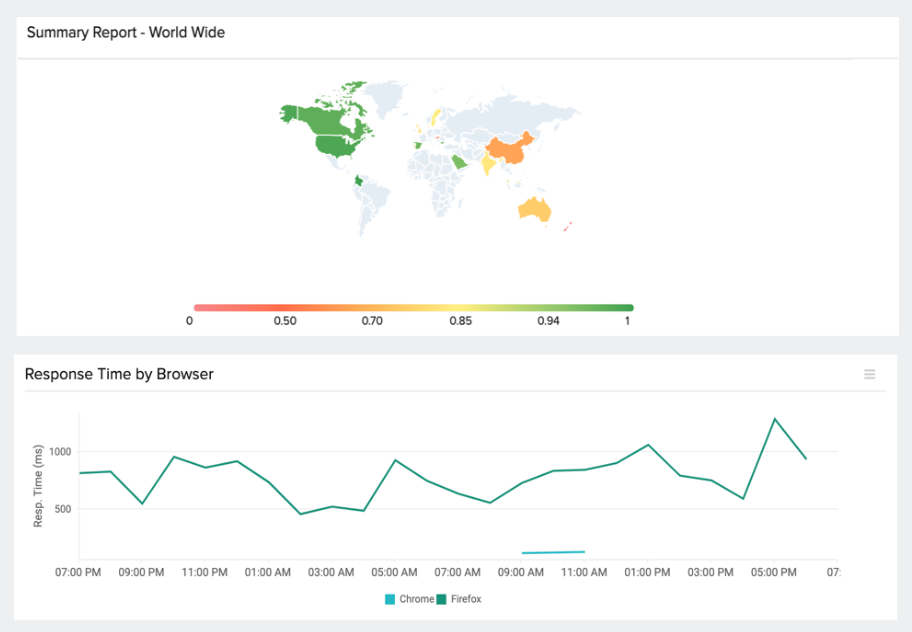
📈 Real user Monitoring
Setting performance budget
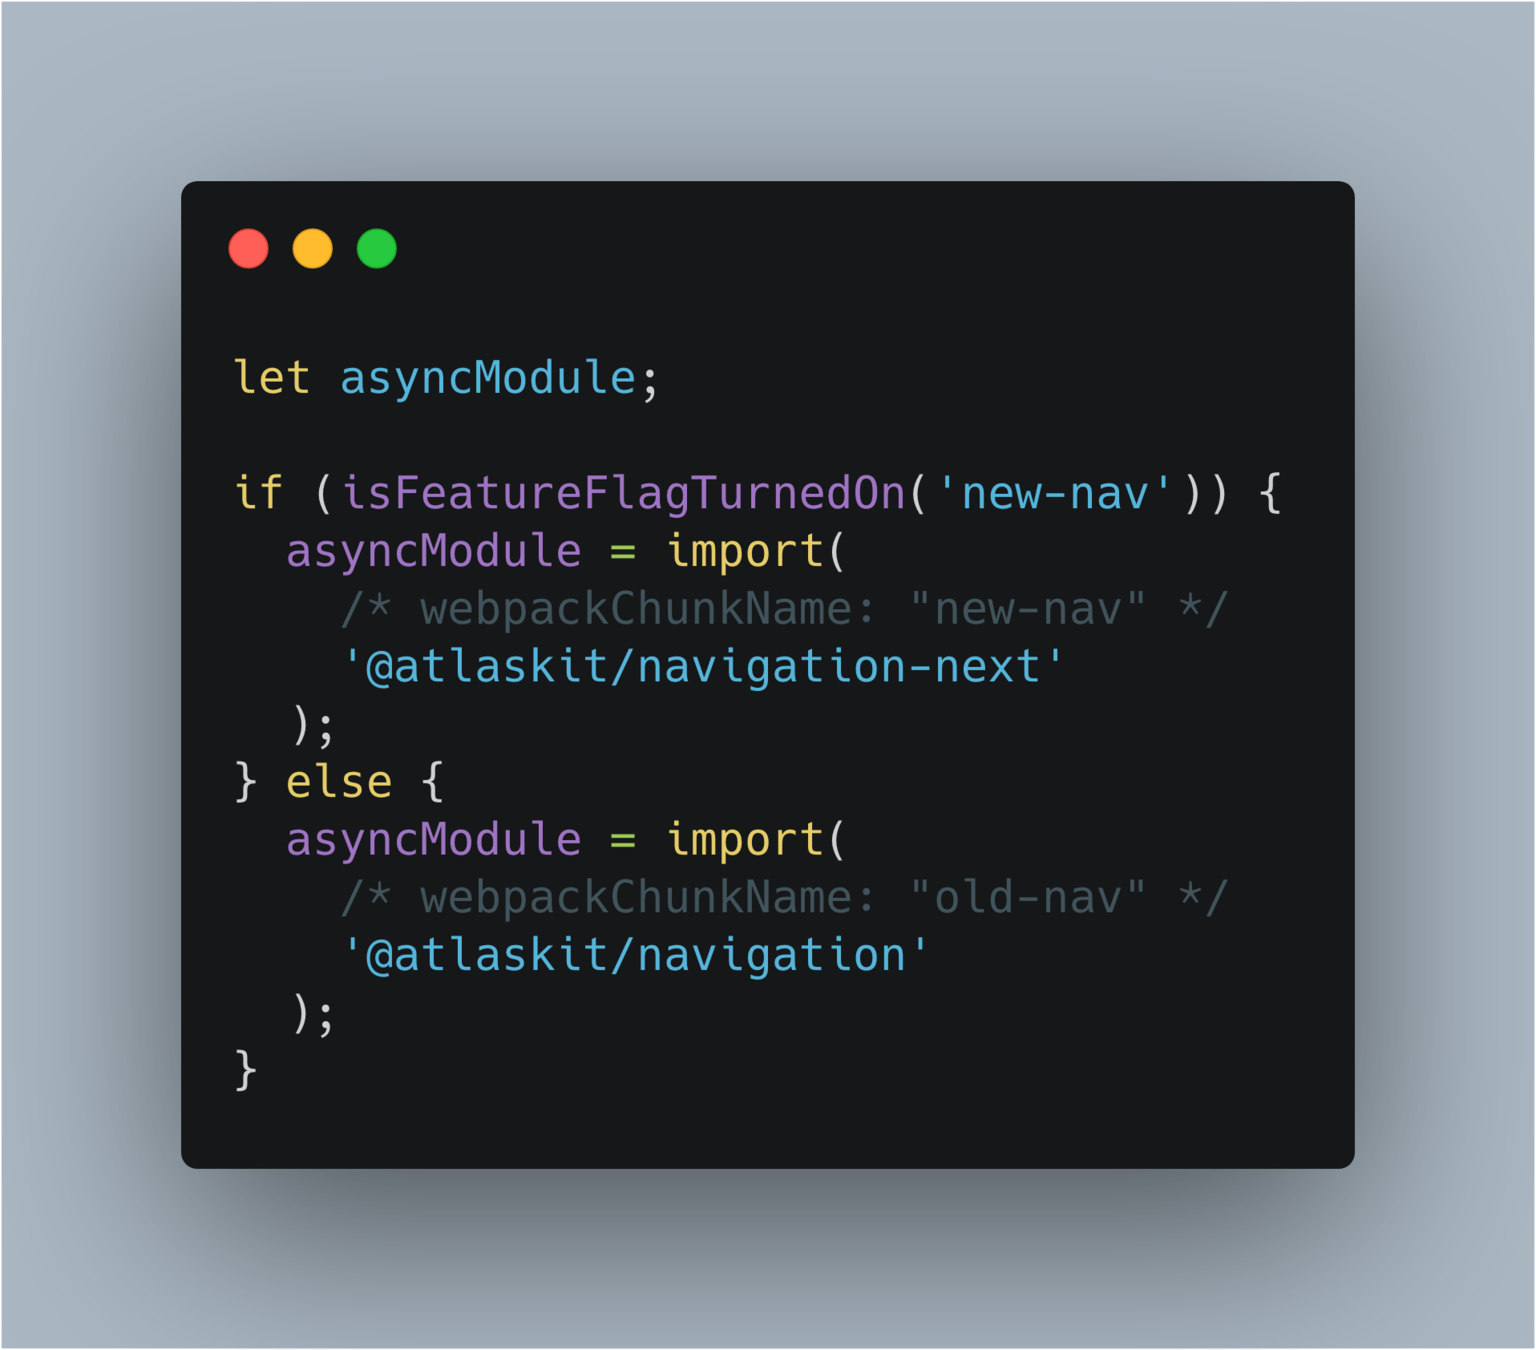
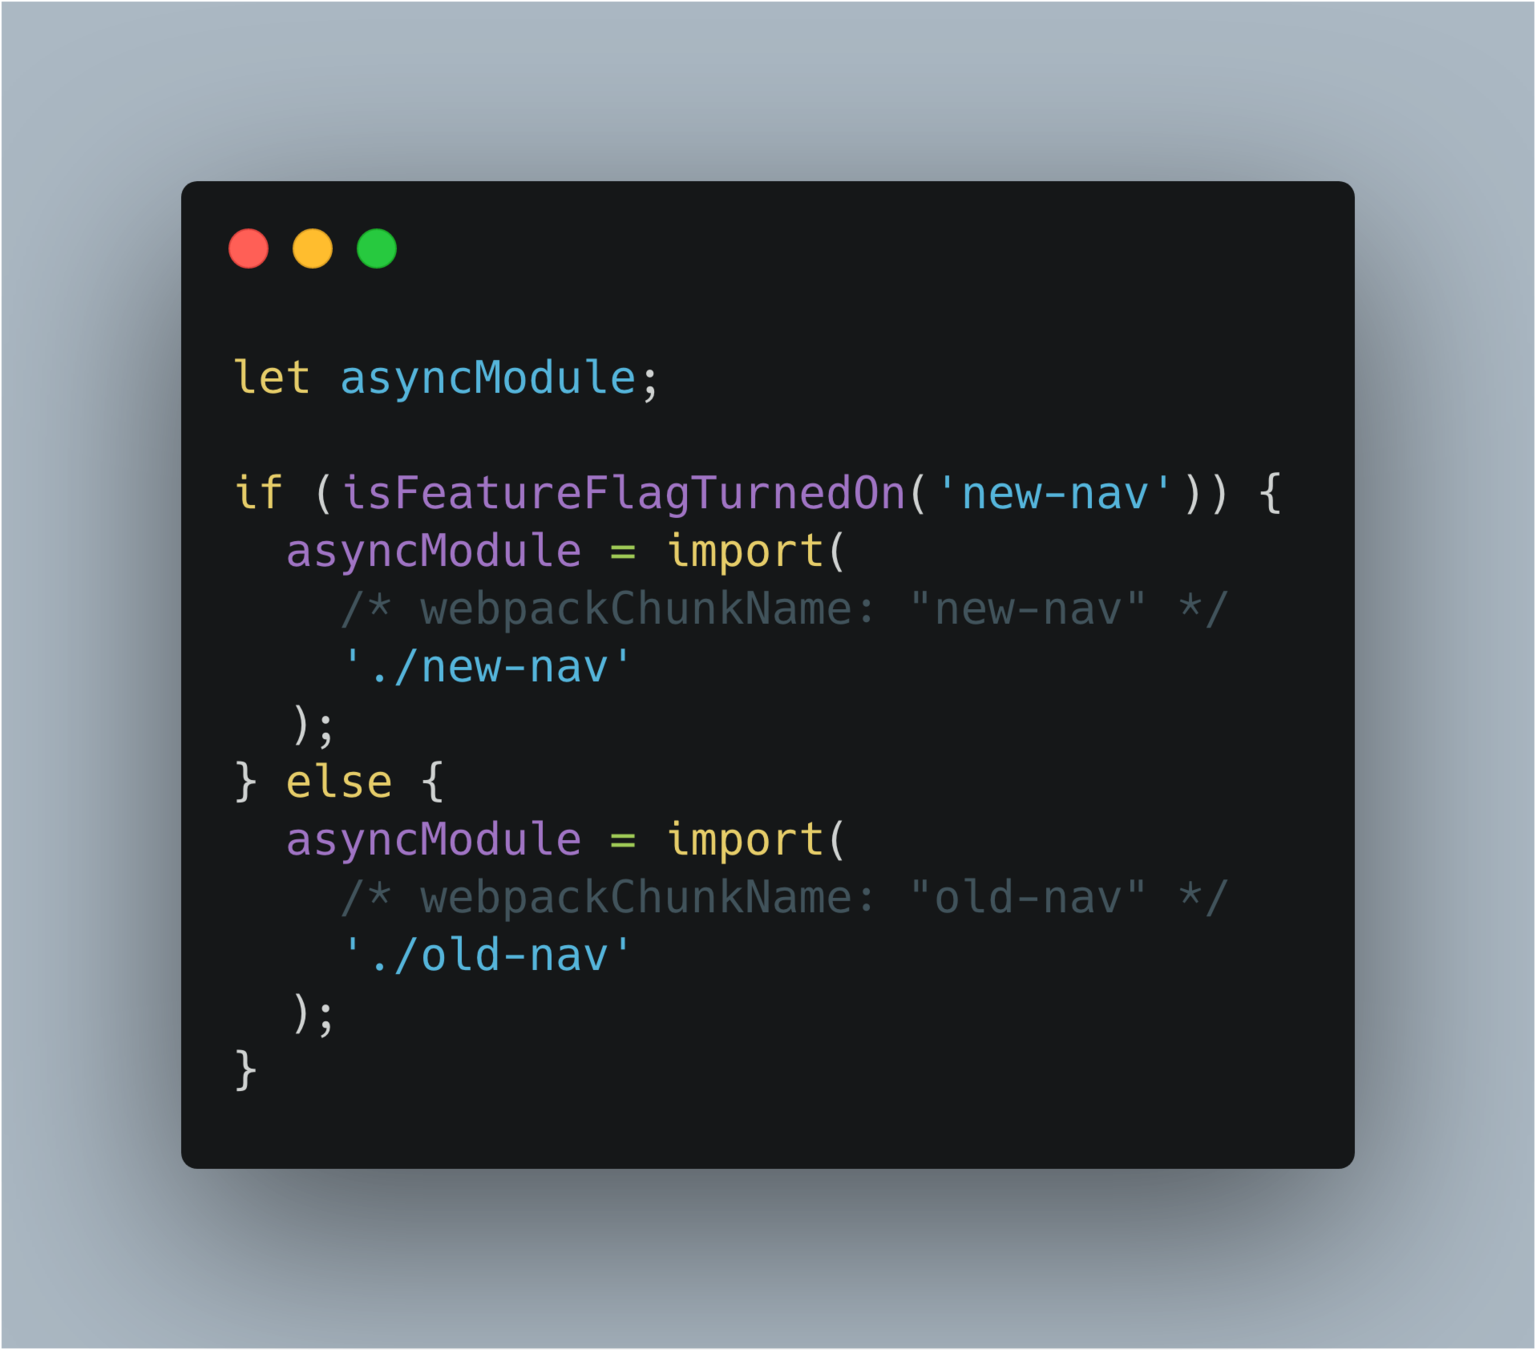
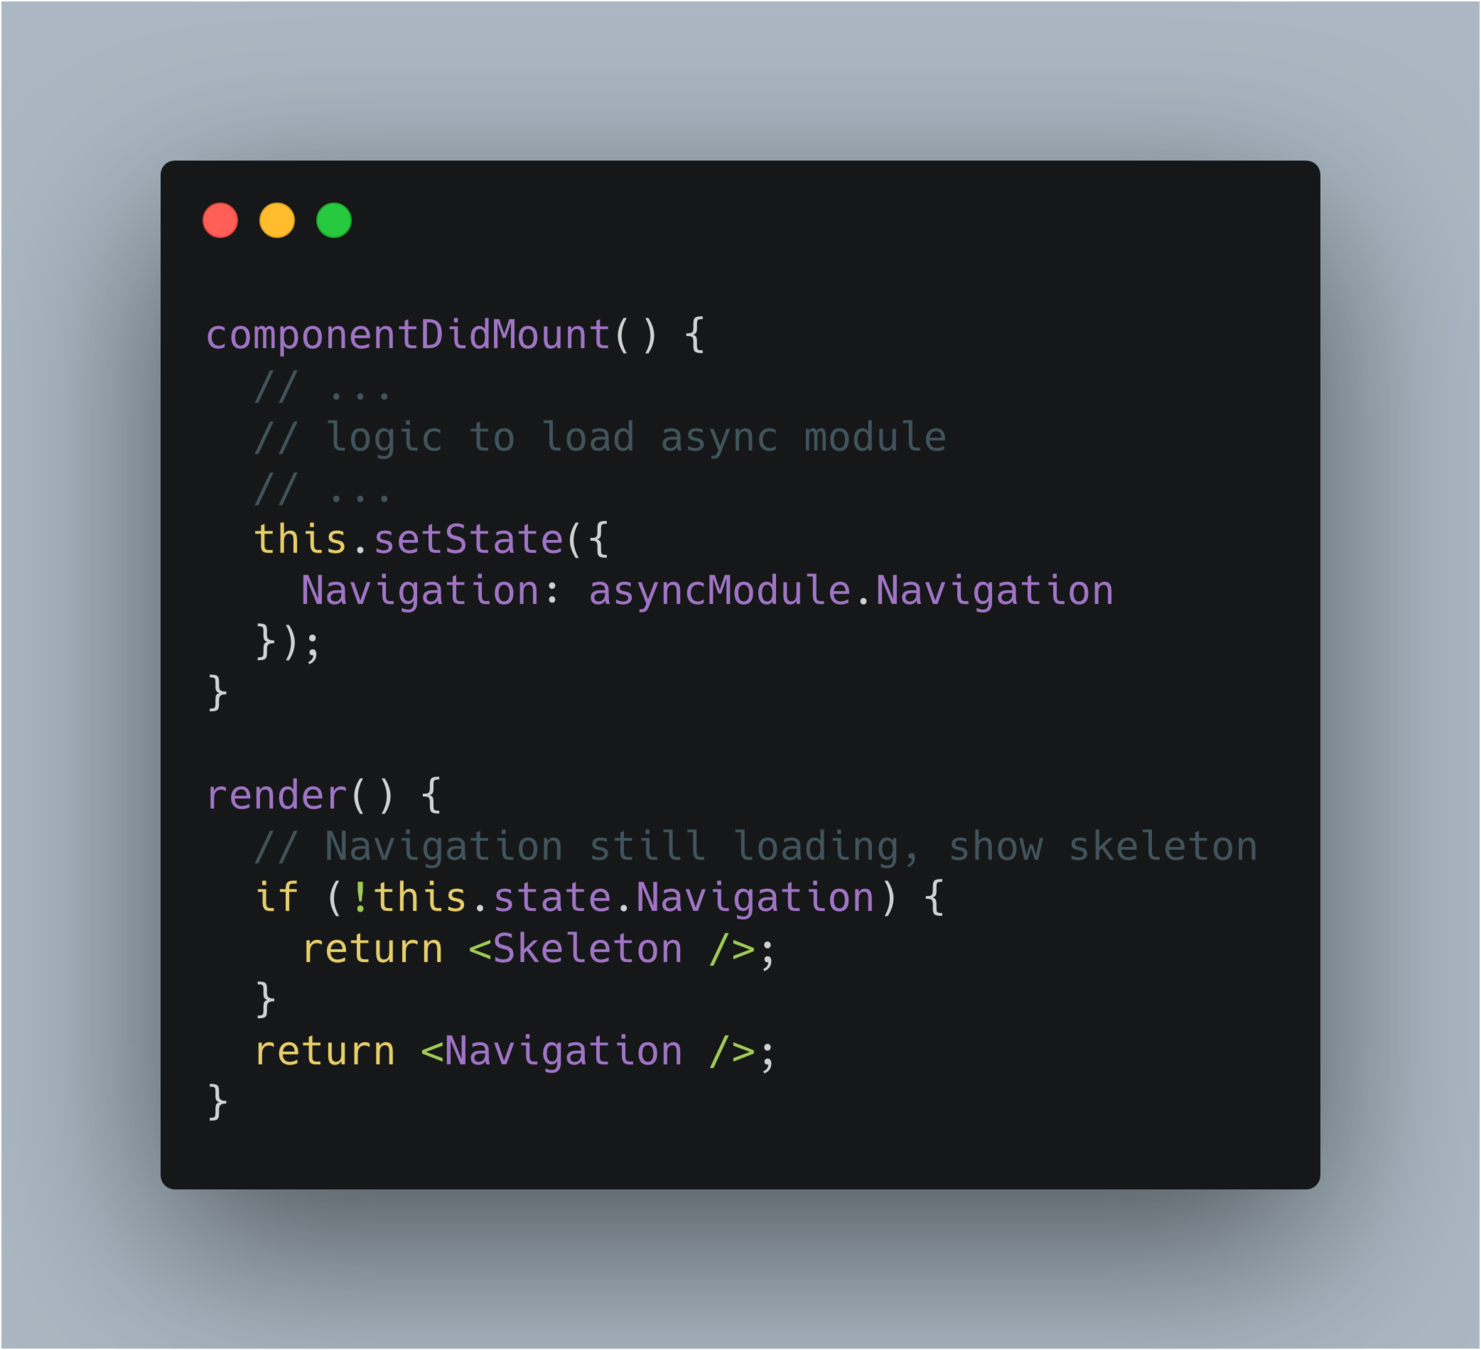
async load components
critical path management
optimistic preloading
What else?
What if we missed
something?
Which metric is the
best for my app ?
Not sure ?
Just don't measure technology
🙂
👑 King 👑
User experience
is the
Title Text
User Timing API
...can be a good solution
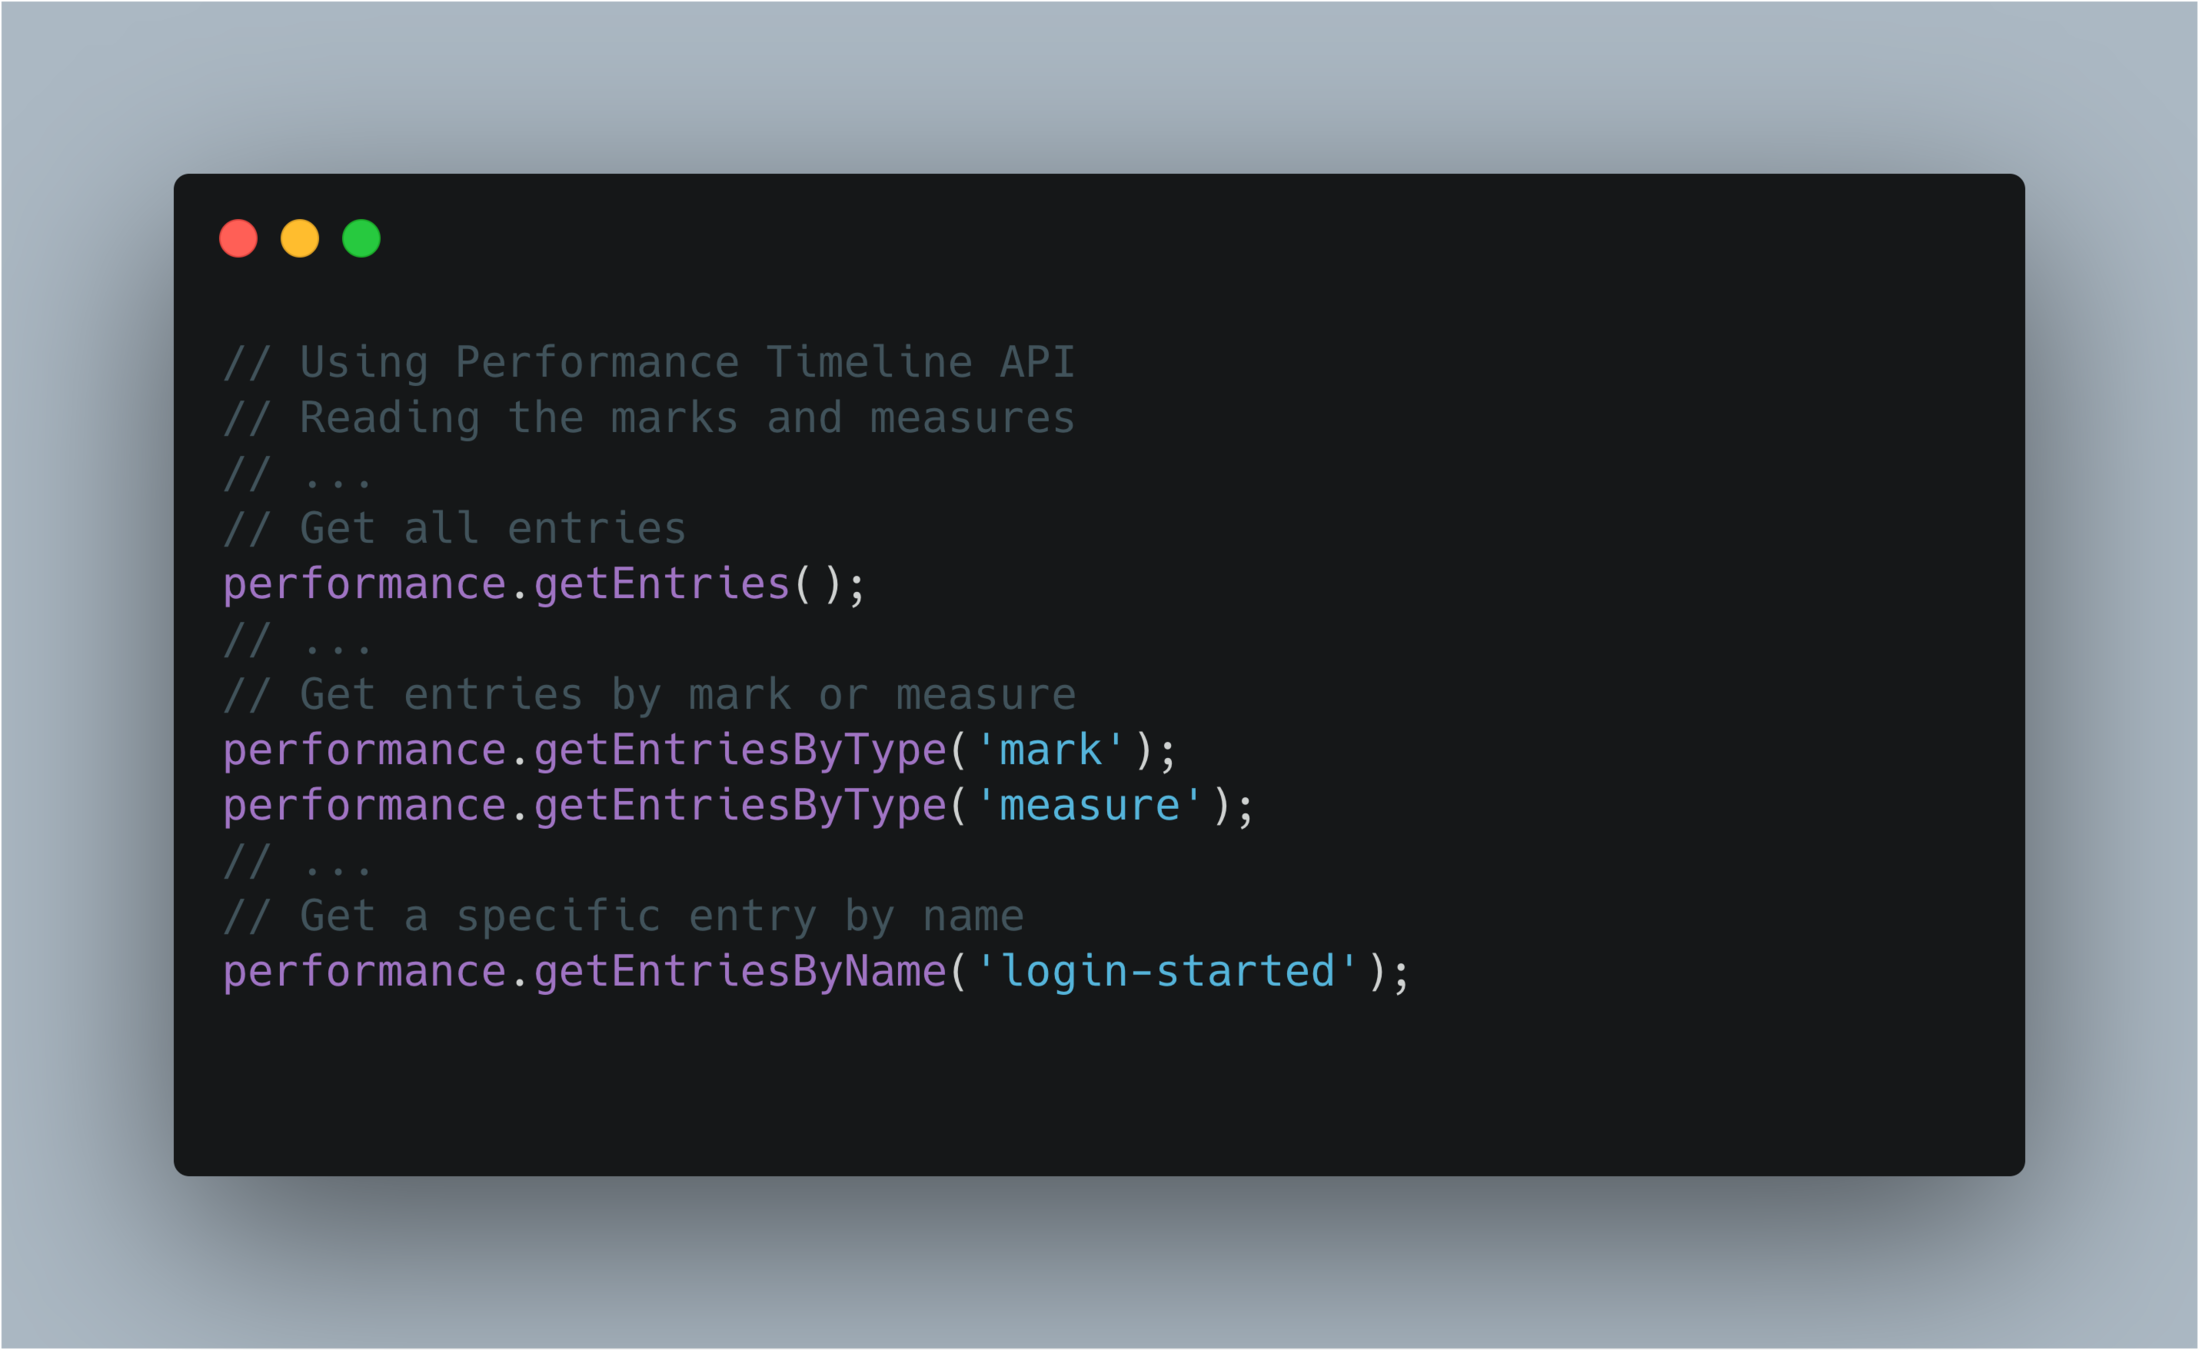
Marks and measures
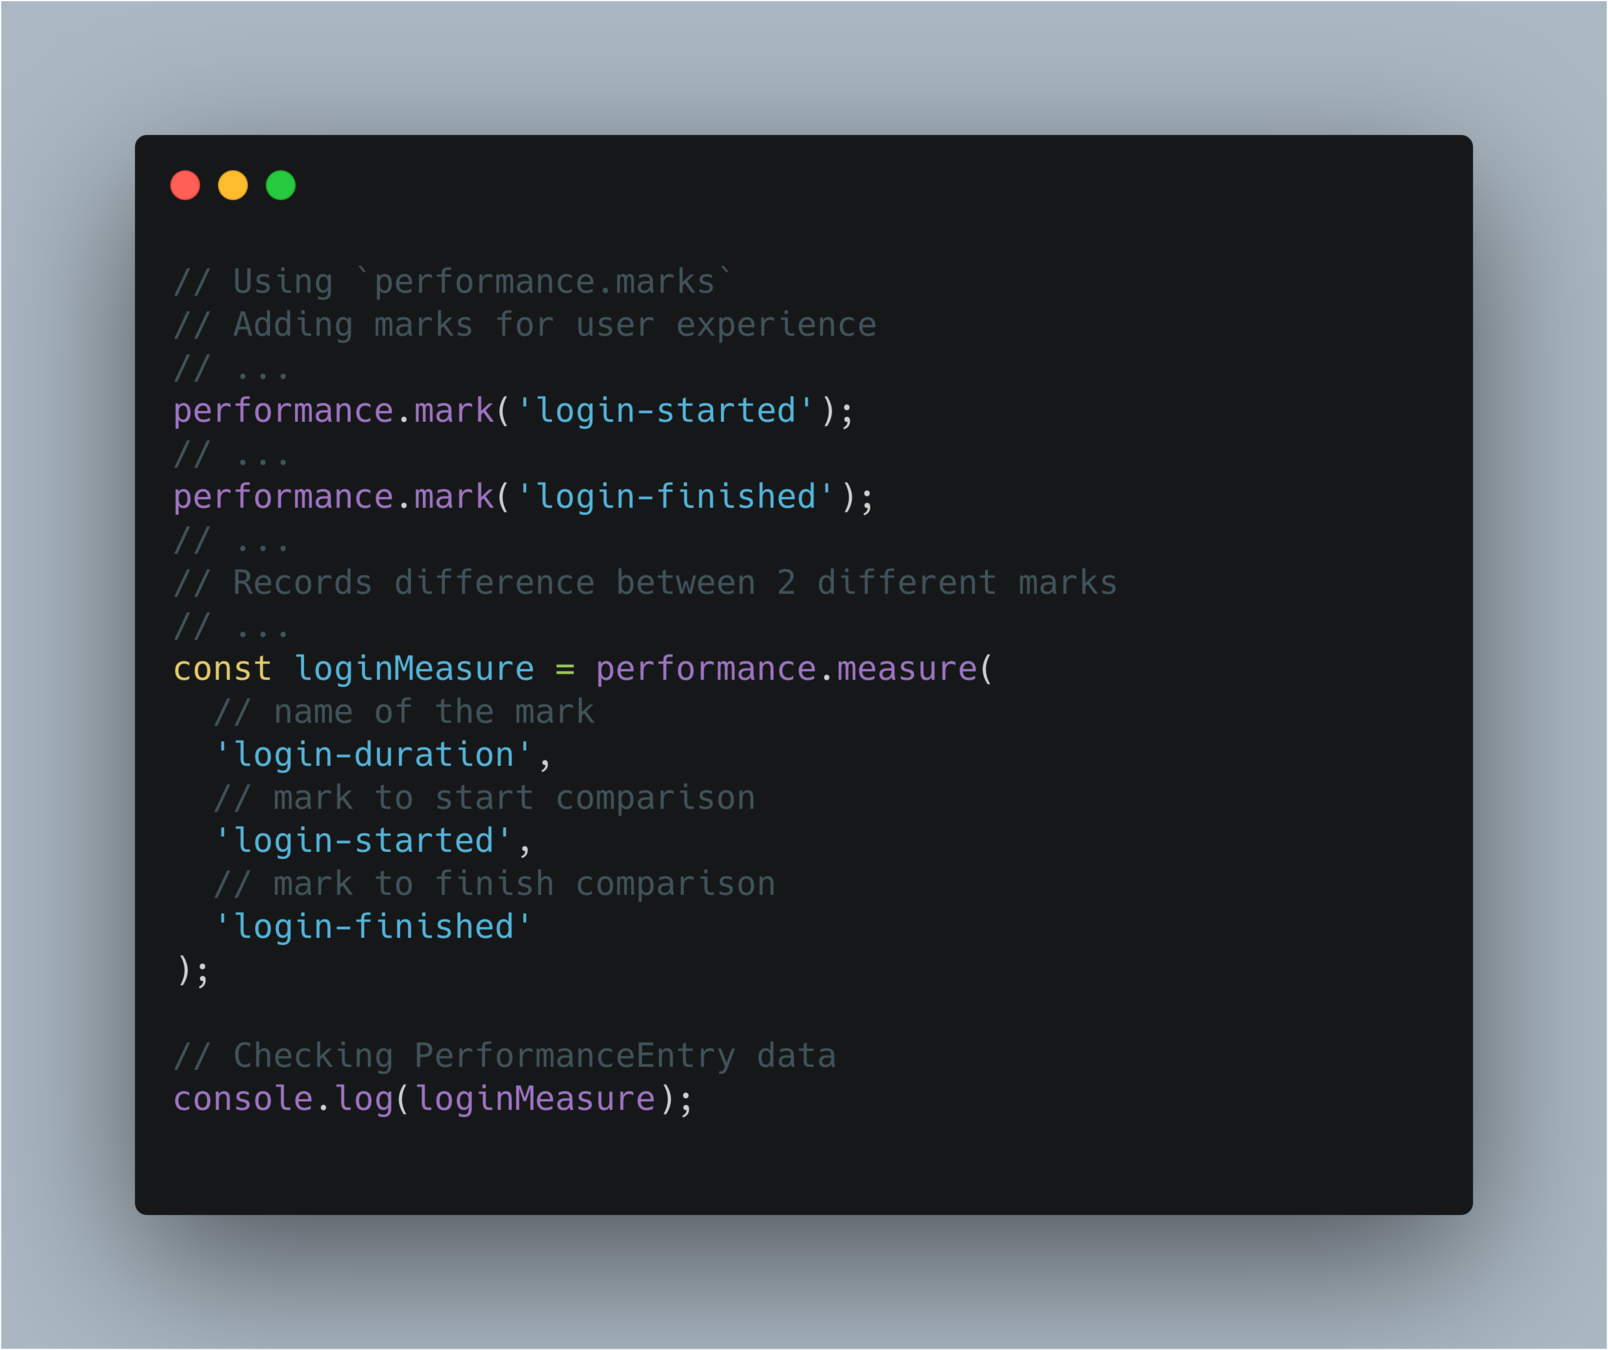
Performance timeline API
measure javascript execution
simple instrumentation
UX Speed metrics
Concerns
Chaos scenario
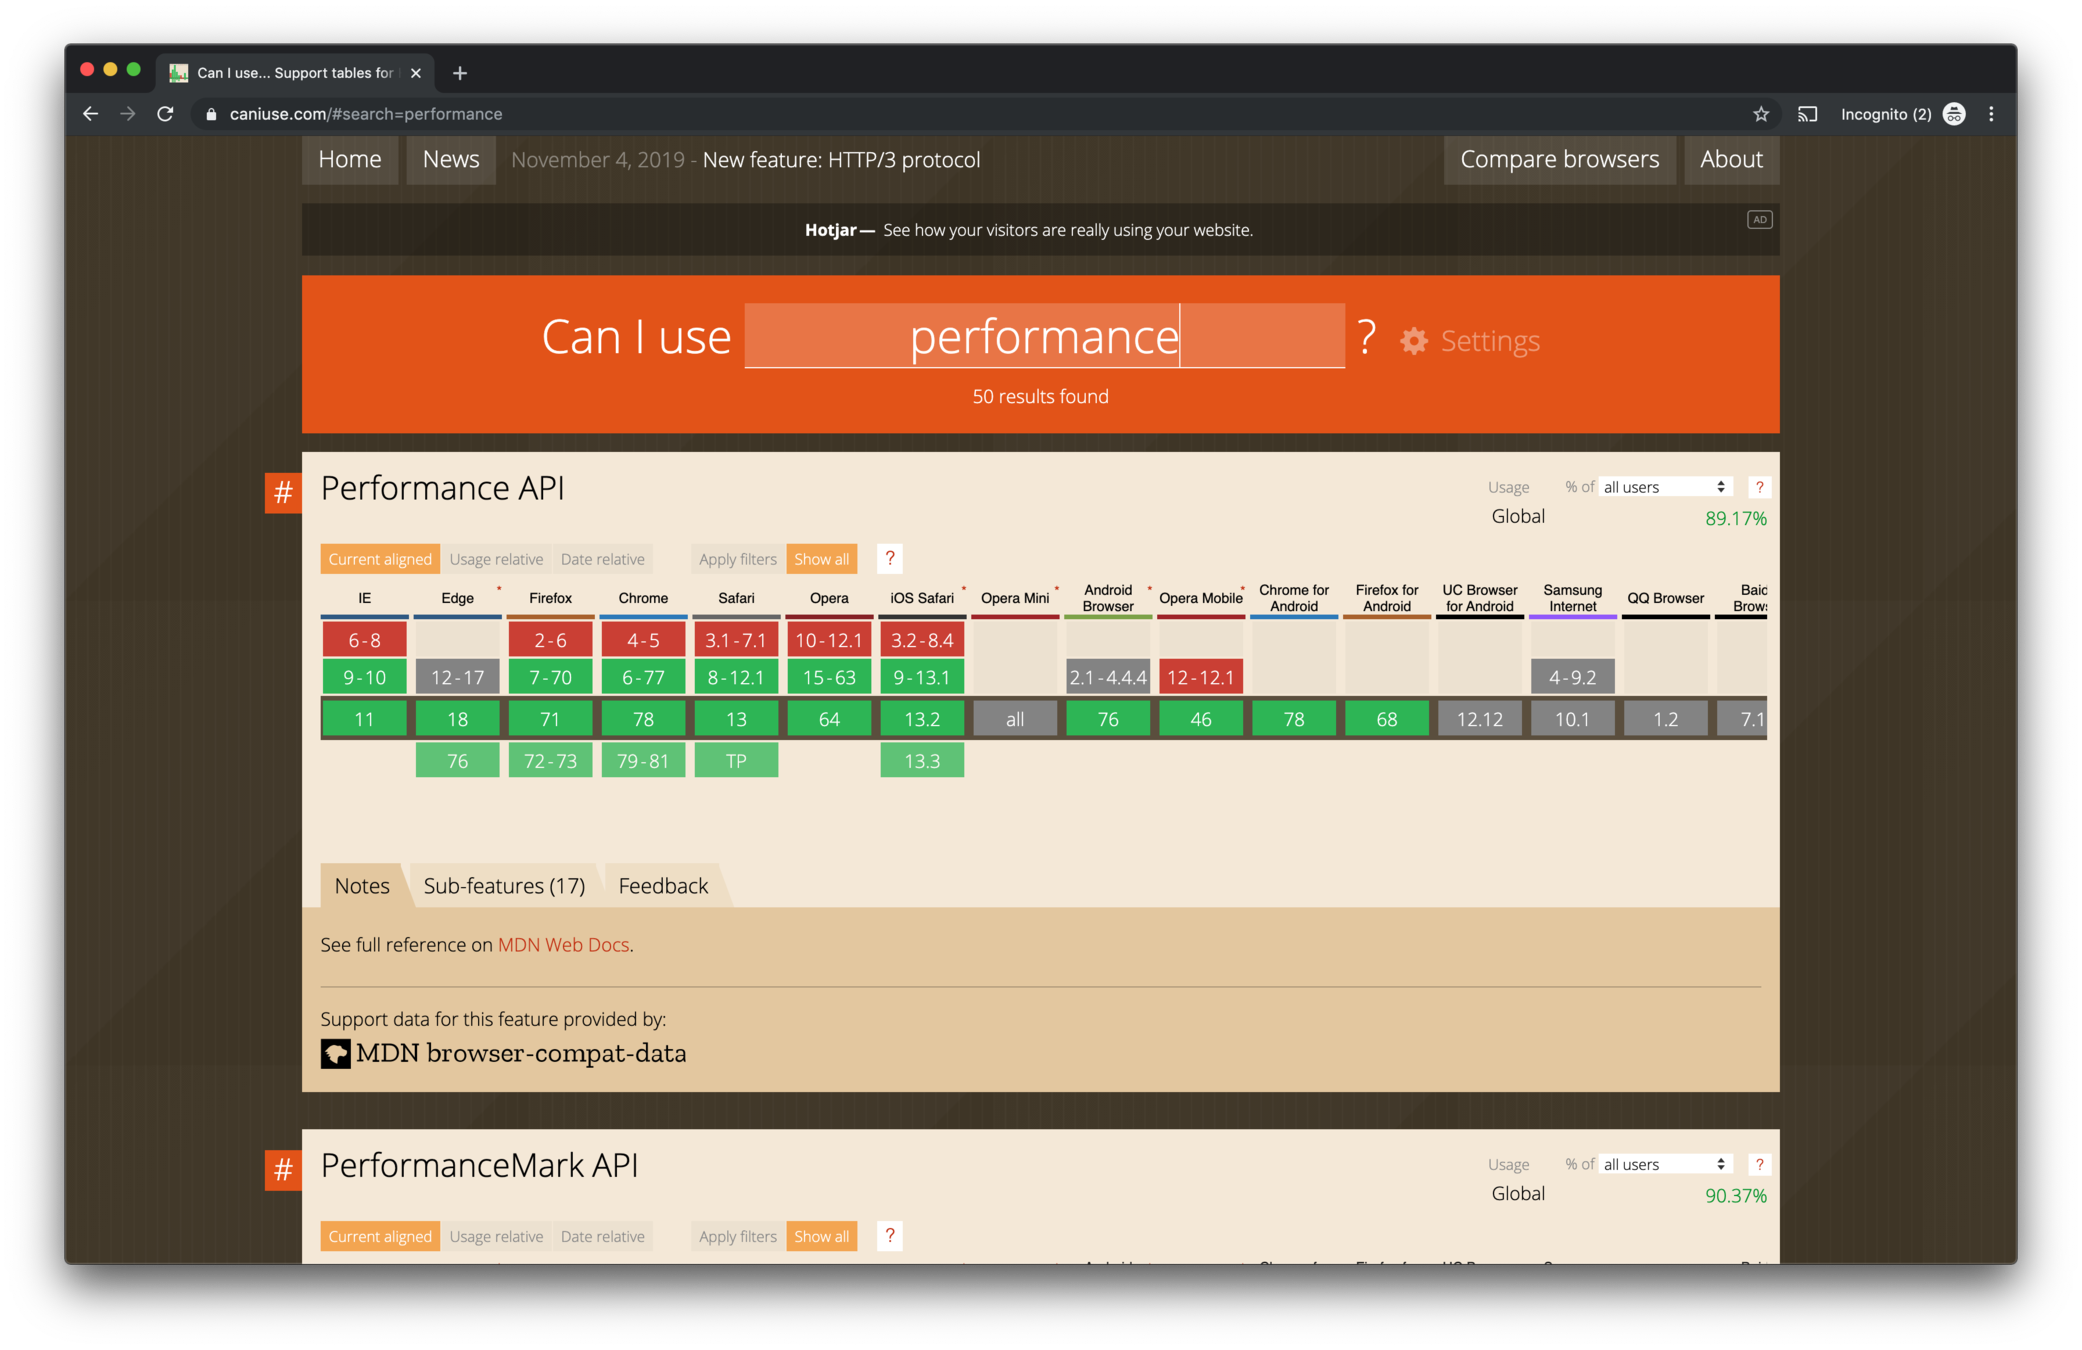
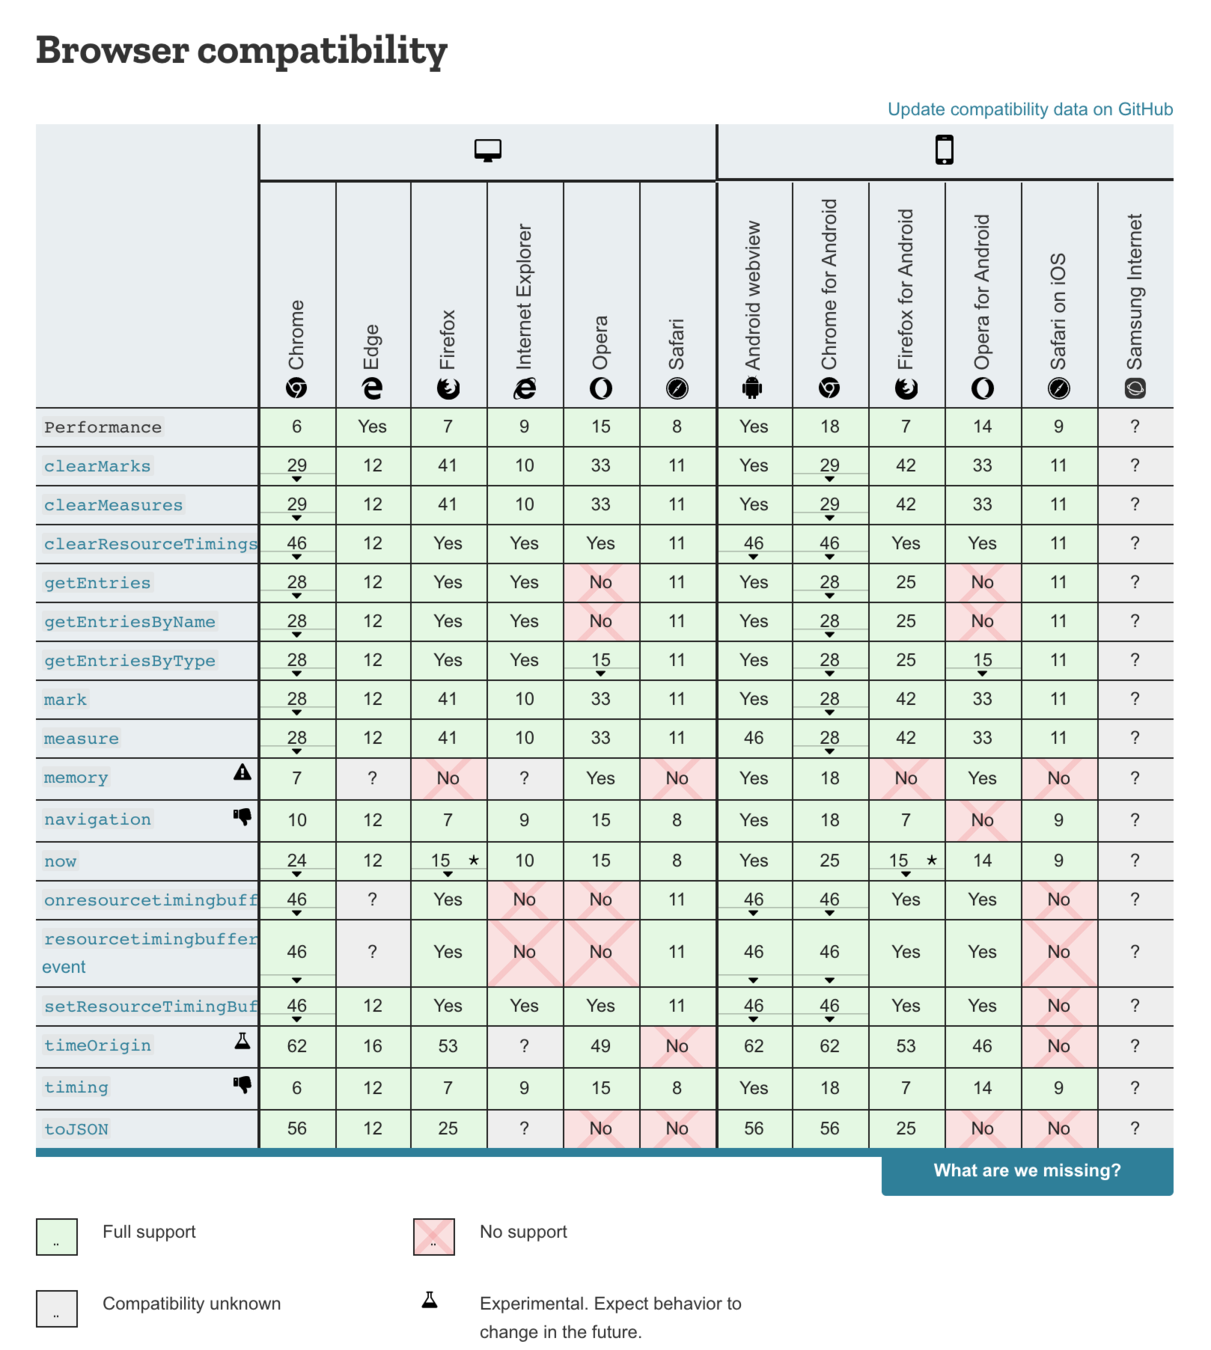
...will help you in this journey
standard
standard
standard
Works on Client/Server
Small bundle
Lightweight
Concerns

Perf-marks in action

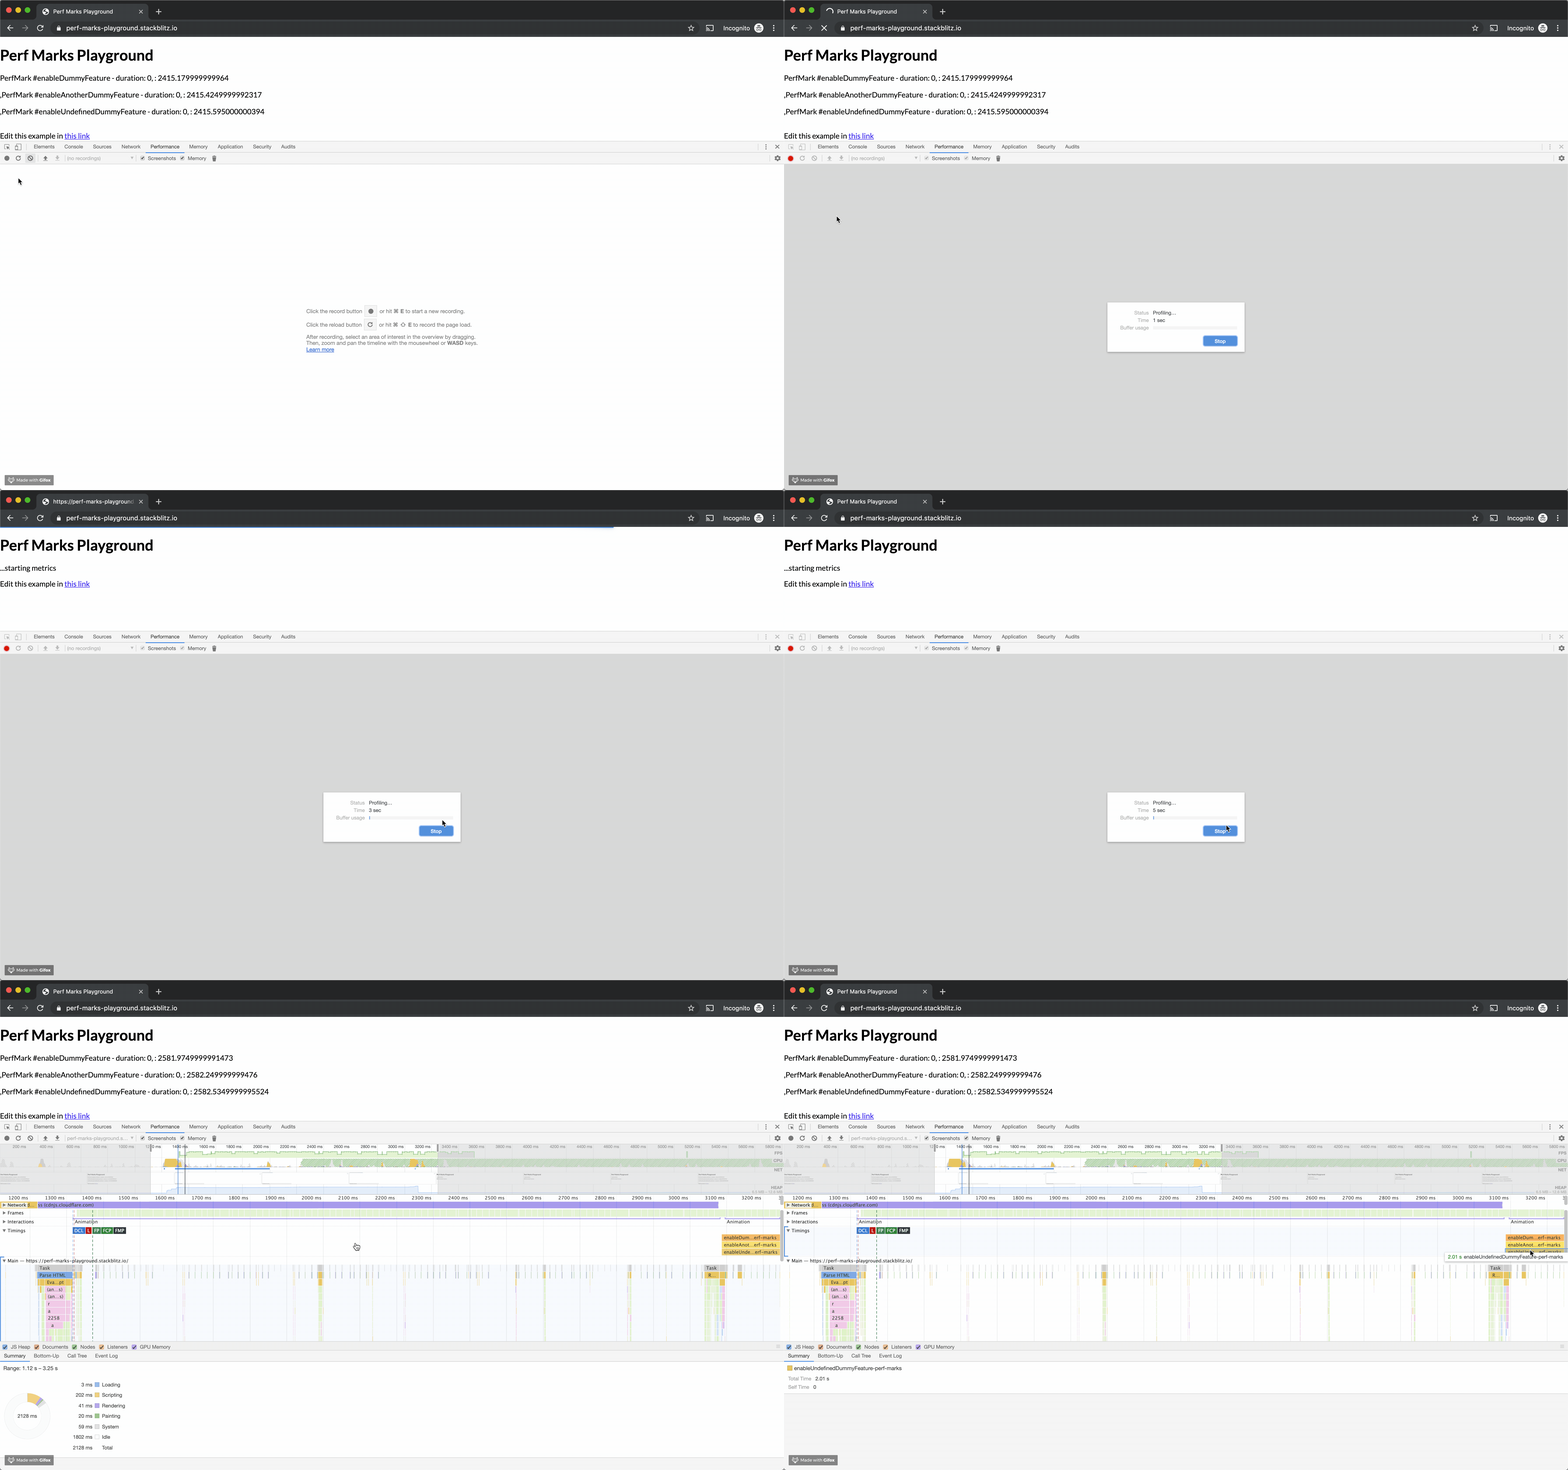
Demo Time
shut up and show me your code
<quick-recap/>
User perception matters
Always measure
Define baselines
Validate impact of techniques
Standards will always help you
Next steps
... or "Measurements will drive ... ?"

Performance priorization
Faster UX by ... design?
Perf-Marks NPM package
Web Perf - cases & experiments
Web.Dev - Performance
Thank you 👋
Wilson Mendes
@willmendesneto
Google Developer Expert Web technologies

Power Chart - A chart component for BI
By georgezou
Power Chart - A chart component for BI
- 1,215
