Understanding Air-Pollution in Indian Cities using Satellite Imagery
Gokulavasan Murali
gok03.com/air-pollution
Motivation
Gokul
gok03.com
- (Urban + Mobility) enthusiast
- Co-Founded Flytta, Exited July'19
- Community Person!

We will talk about
- Air pollution
- GIS
- Satellite Imagery
- EO-Learn
- Air pollution Monitor
- Pollution pre+post Diwali
Air Pollution
What is it?
Various gases into the atmosphere -
that cannot be absorbed in the environment.
It Consists of
- Sulfur dioxide -SO2
- Nitrogen dioxide - NO2
- Carbon monoxide - CO
- Ozone - O3
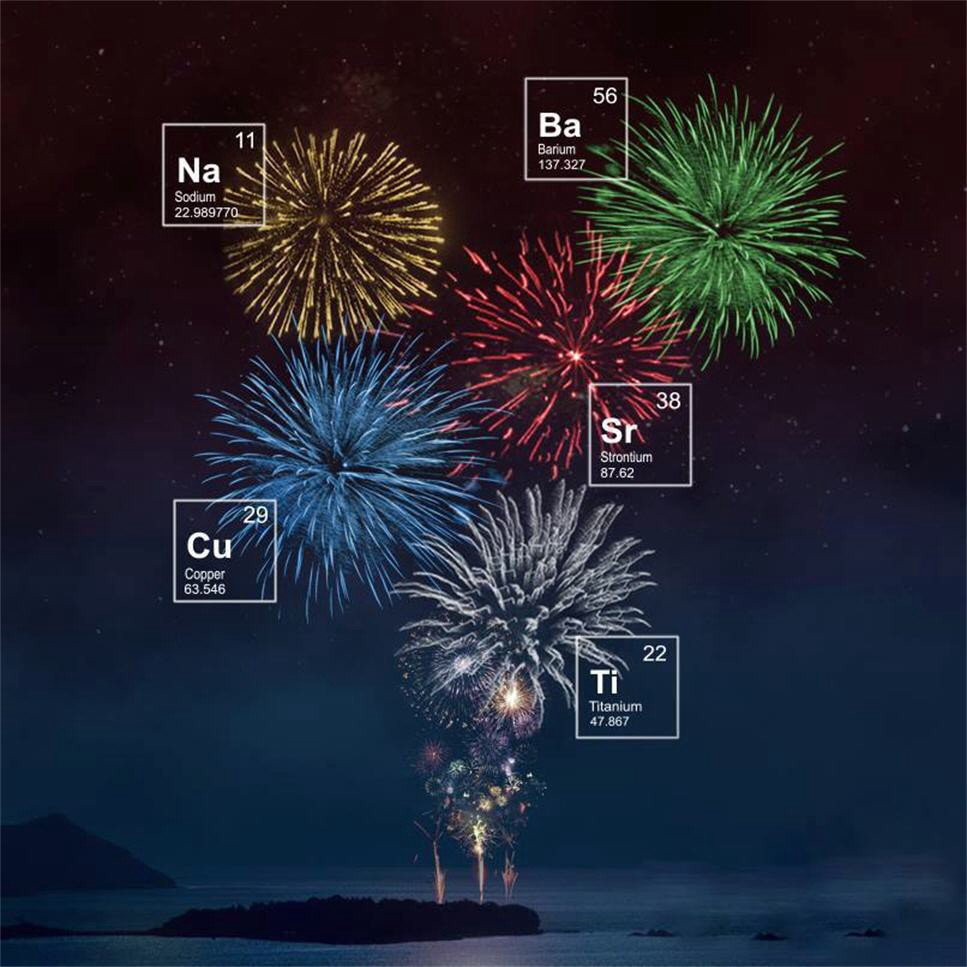
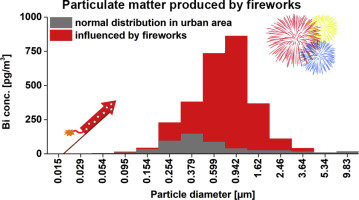
- Particulate matter - Aerosols
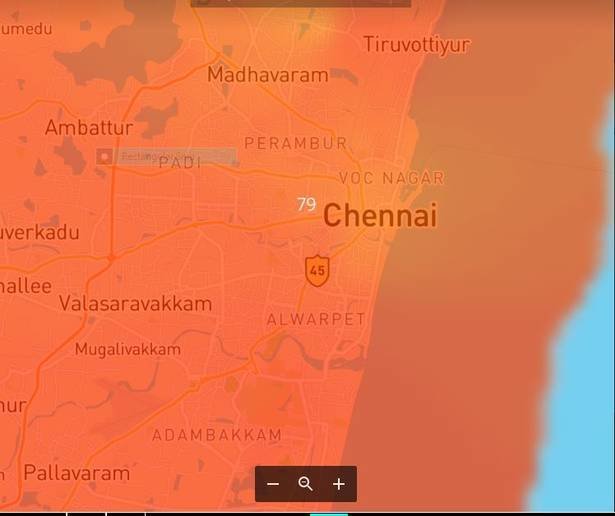
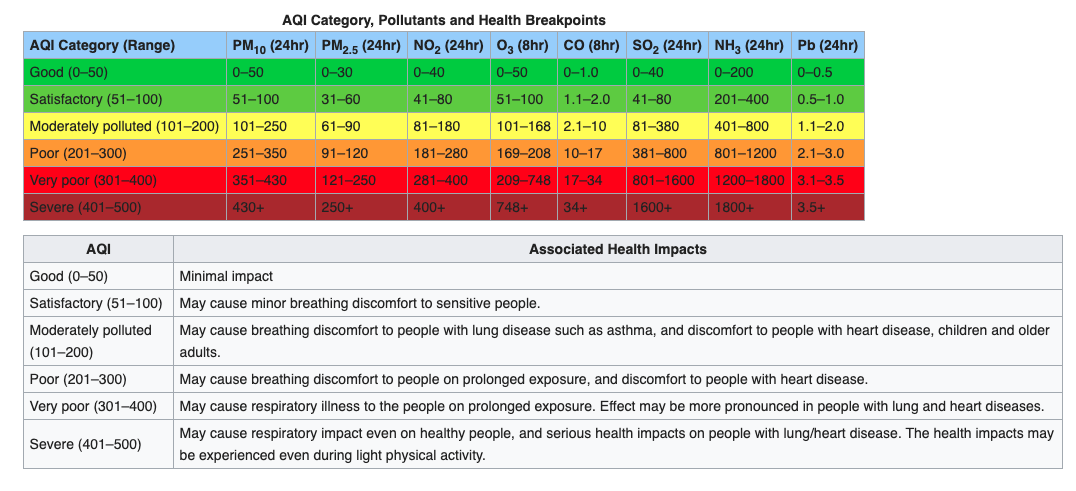
National Air Quality Index - Swachh Bharat Abhiyan (2014)
GIS
Geographic Information System
Used for
- Urban Planning
- New public system/ Traffic congestion / Mapping / Navigation
- Resource Management
-
Maintaining agricultural, water, forest and other resources
-
- Disaster Management
- Risk management and analysis / Plan rescue & relief operations


GIS python Tools
- Geopandas
- Shapely
- GDAL
- PyProj
- Sentinelsat
- EO-Learn
Notebook
1.GIS-Intro.ipynb
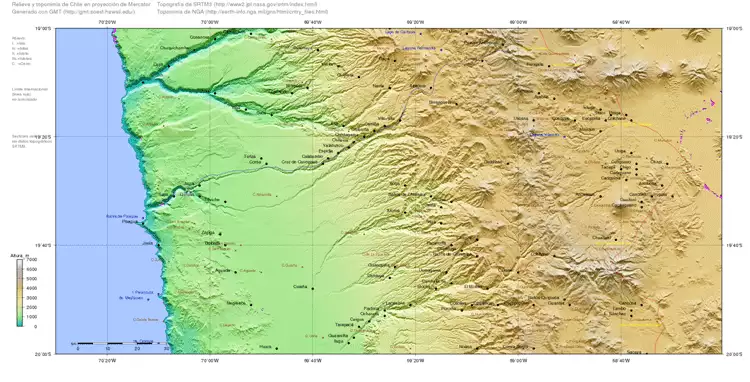
Satellite Imagery
What is it?
Records the wavelengths emitted from their point of focus.
This includes R/G/B, SWIR , NIR
Each Satellite has different levels of Processing
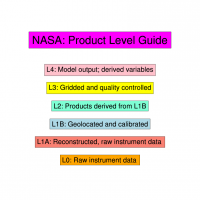
We can get RGB, NDVI, NDWI, Elevation, Gases Concentration
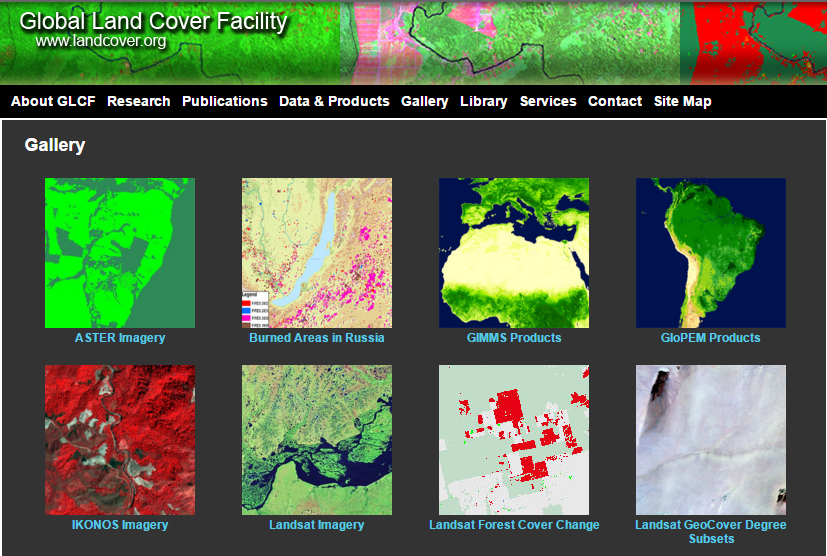
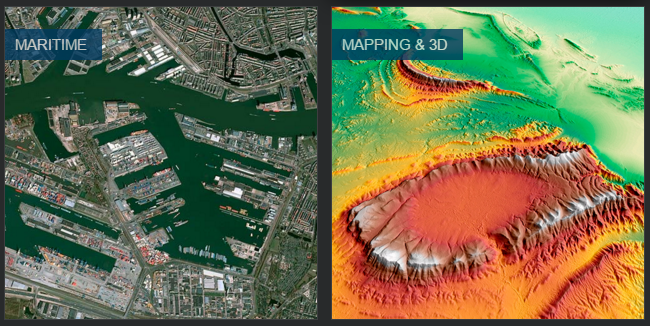
Some Examples
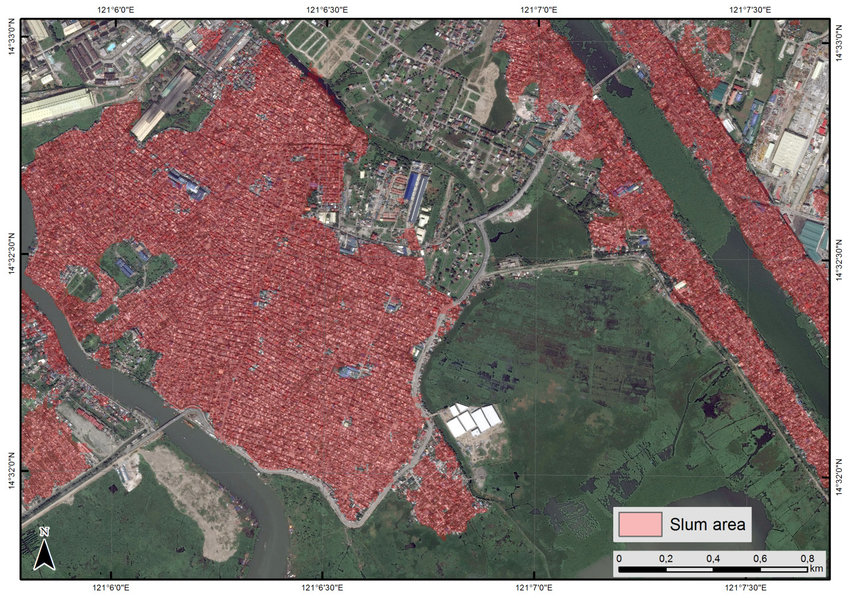
Some Examples
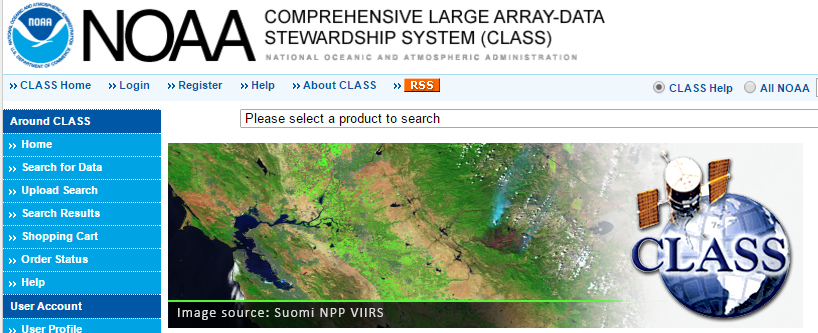
How to access them?
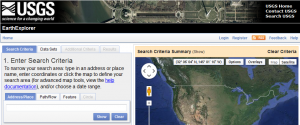
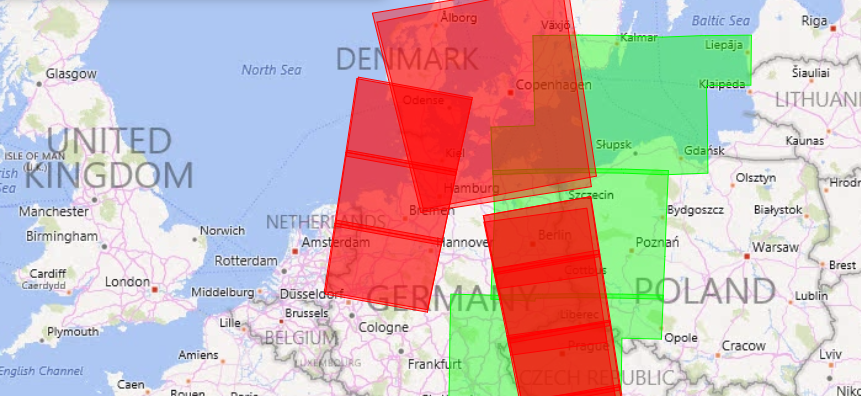
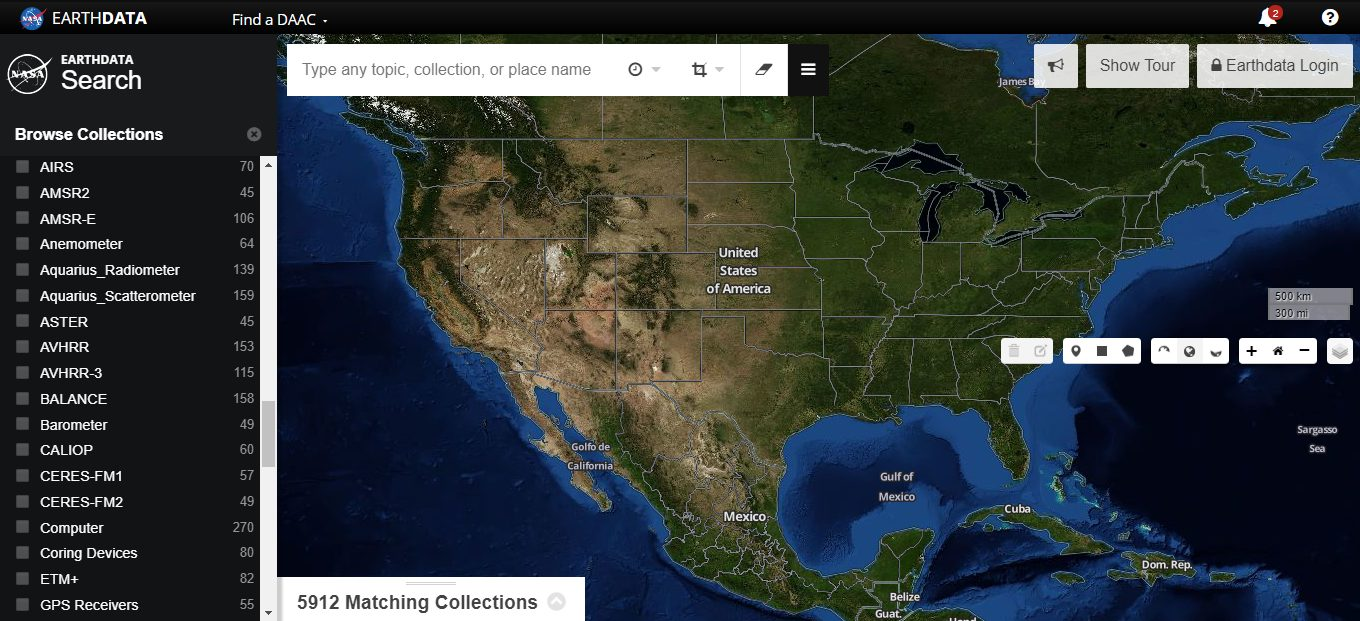
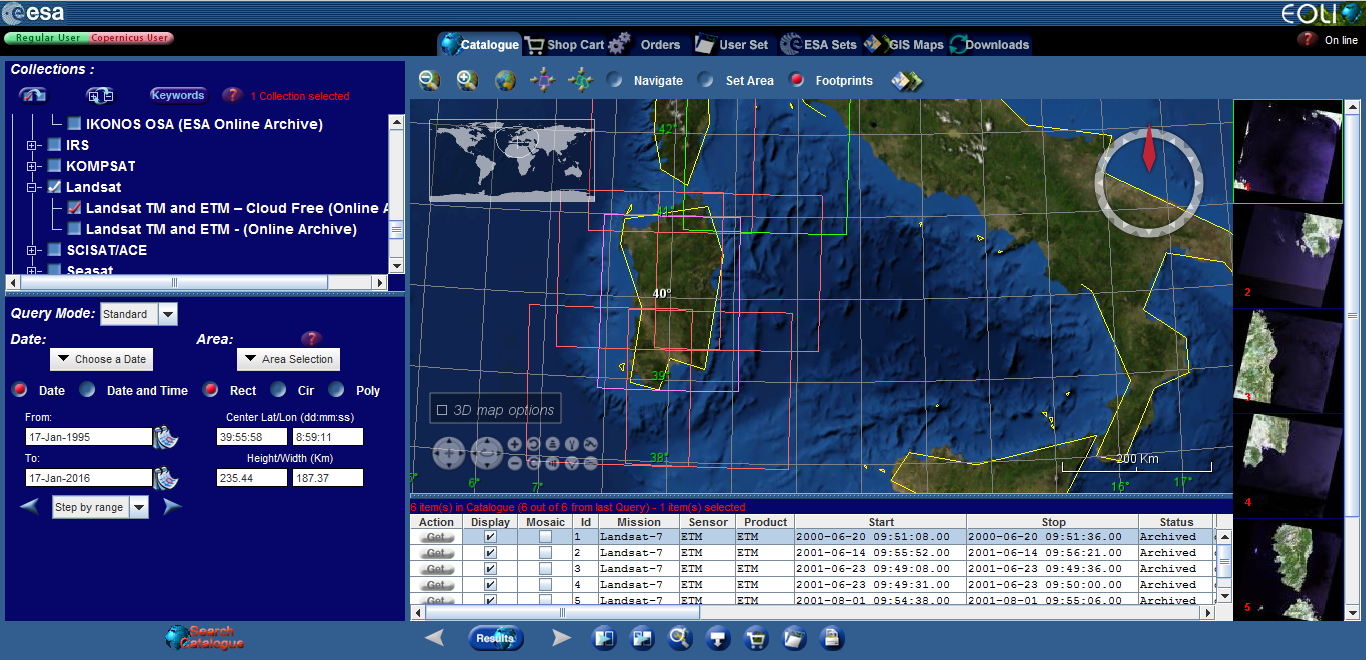
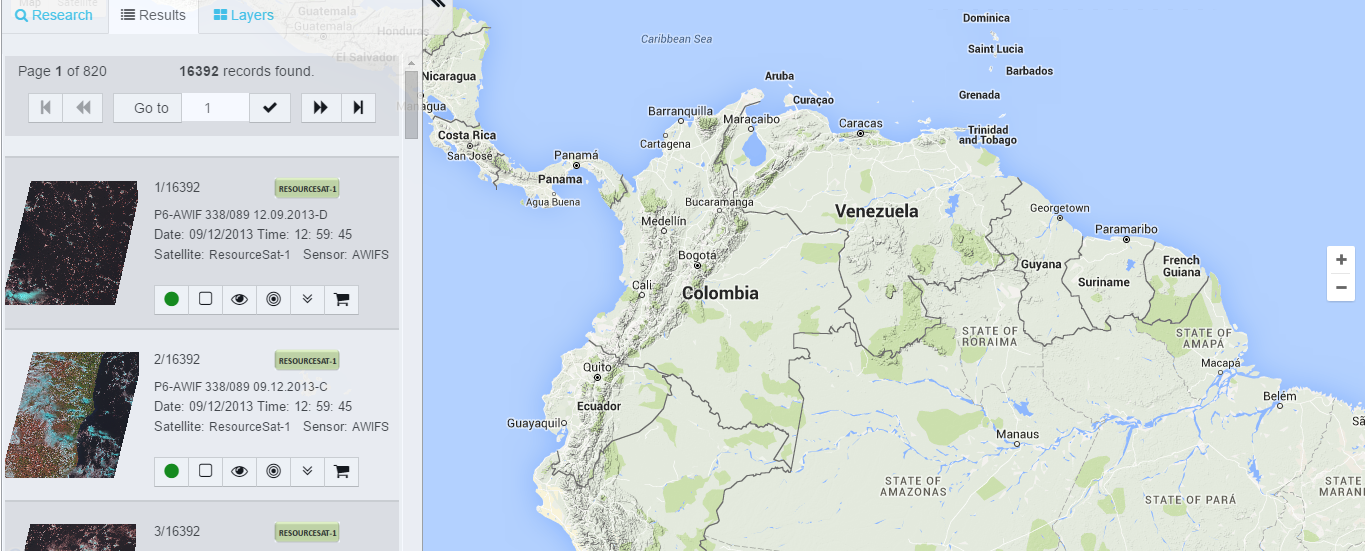
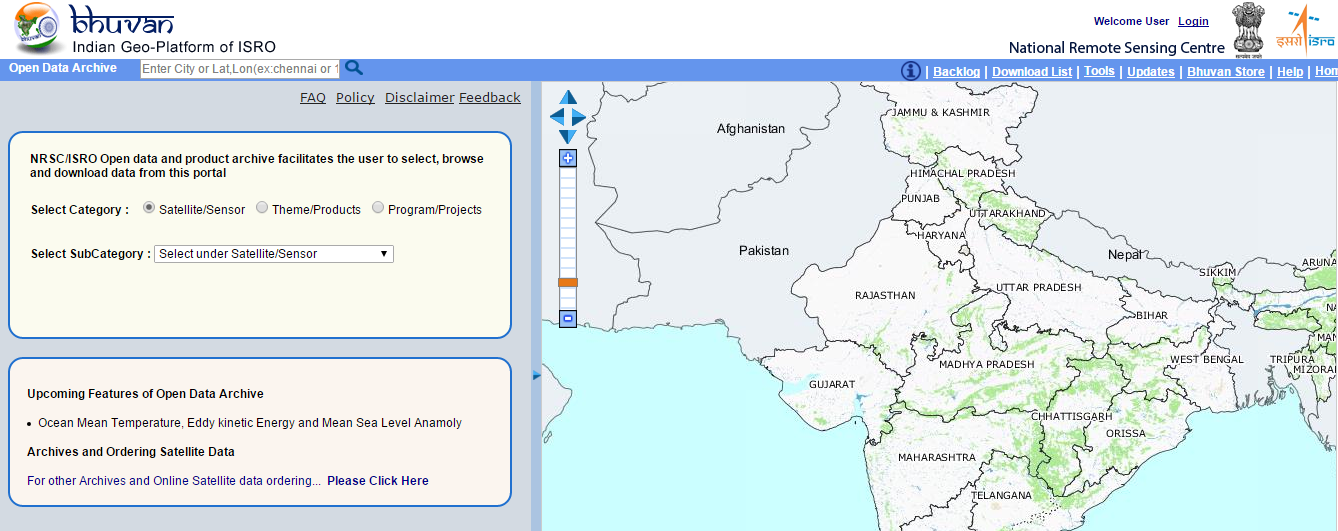
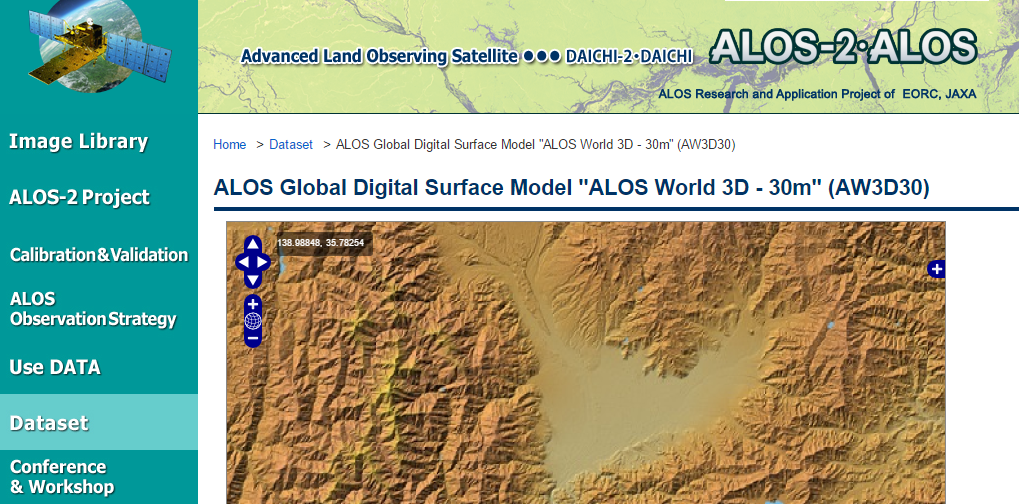
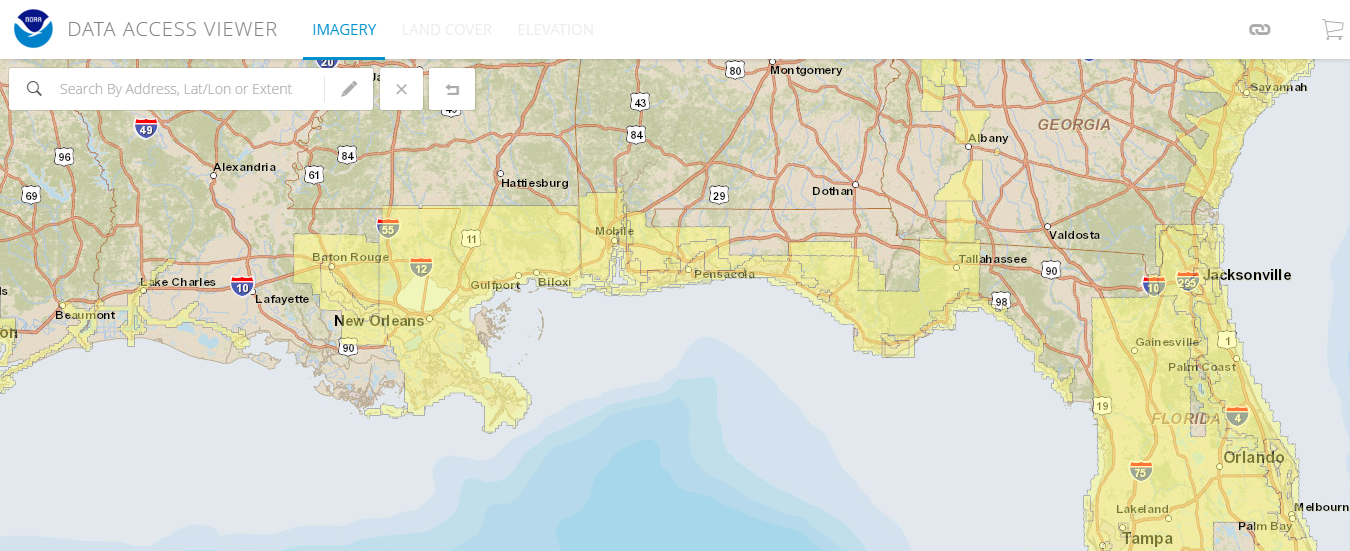
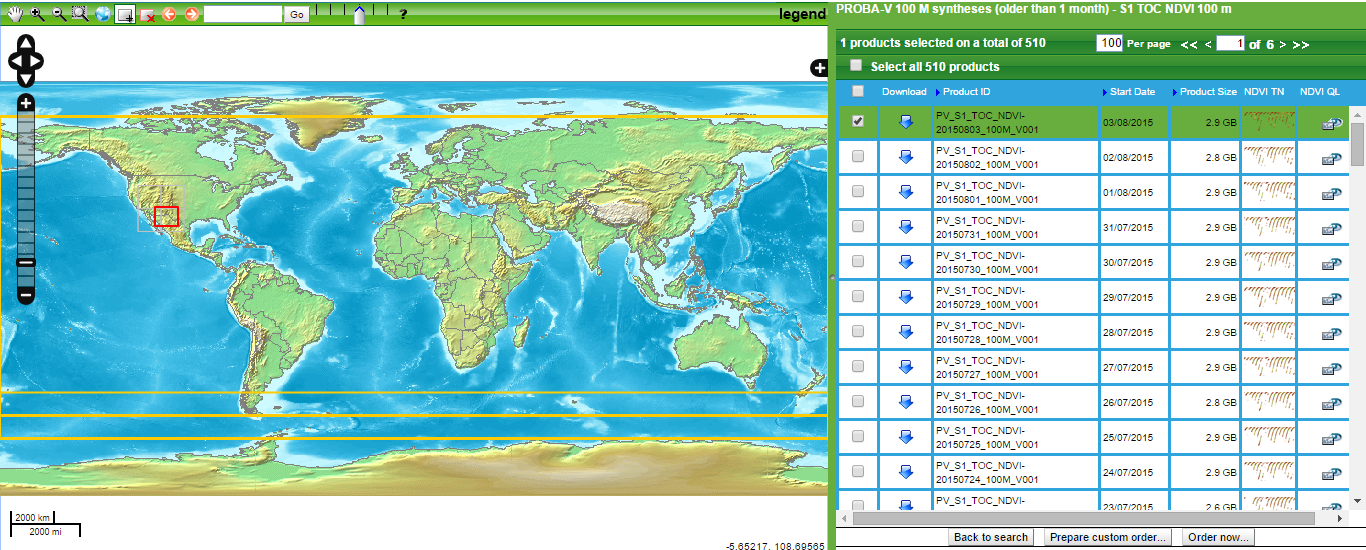
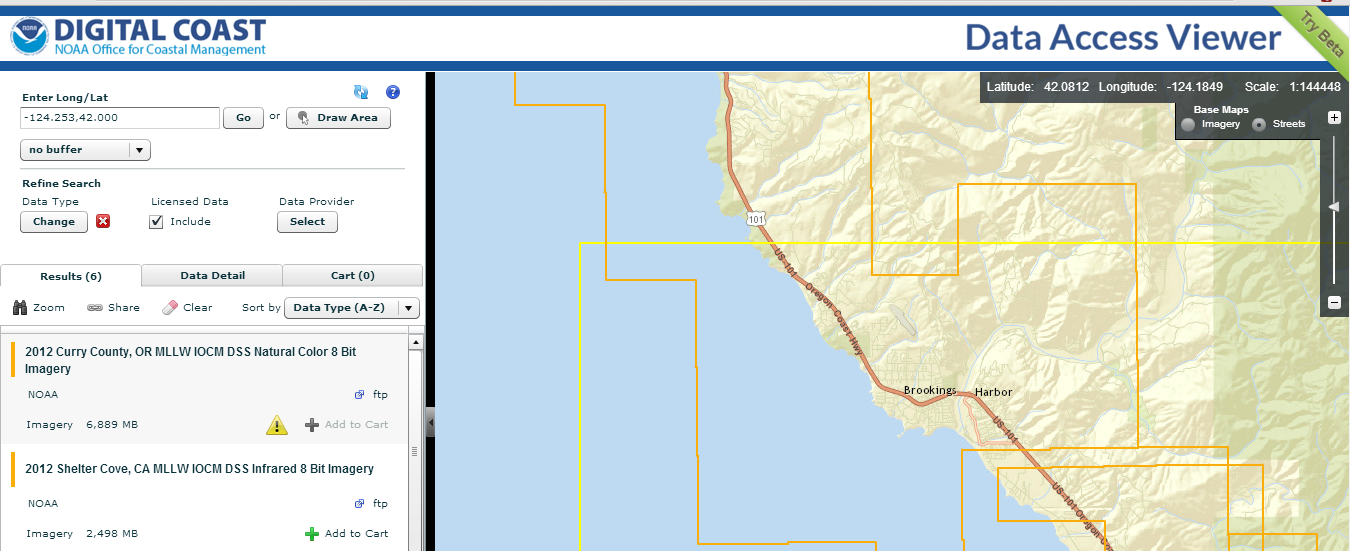
You look out for
- Spatial Resolution
- Satellite and Product availability
- And free credits sometime!
Sentinel Hub
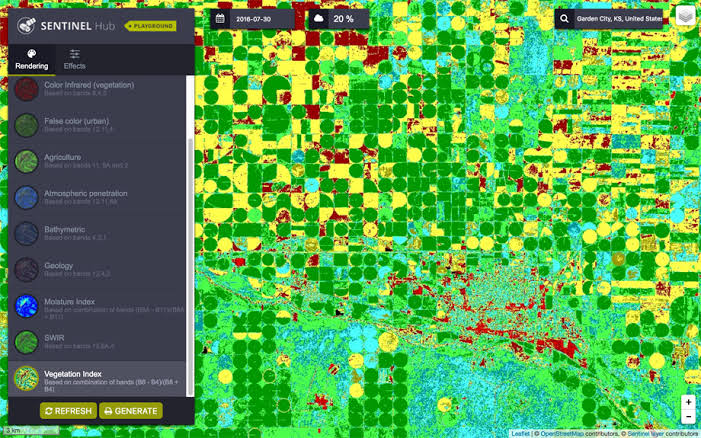
CLOUD API FOR SATELLITE IMAGERY
EO-Learn
Earth observation processing framework

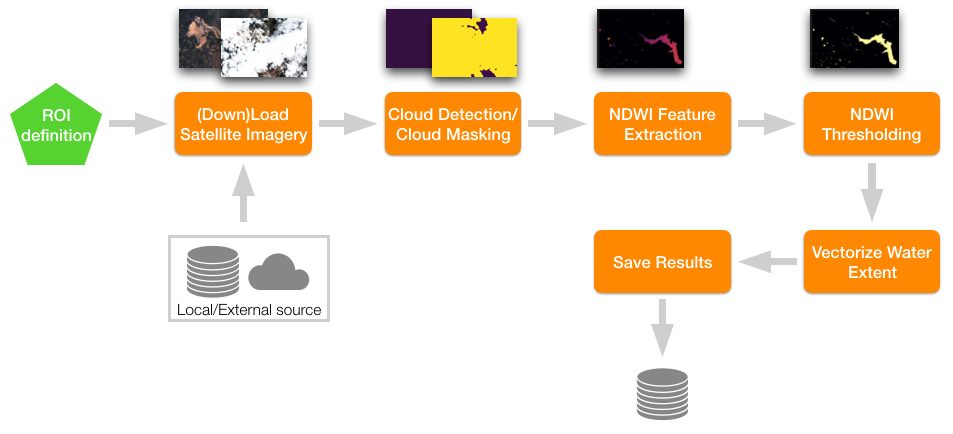
Notebook
2.EO-Learn-Intro.ipynb
Air pollution using satellite Images
Satellite missions devoted to monitoring our atmosphere
- European Space Agency (ESA)’s Envisat
- NASA’s Aura missions
- Sensors: MODIS, MISR, OMI, and VIIRS
- Sentinel 5P
Sentinel 5p
- Contains TROPOspheric Monitoring Instrument (TROPOMI)
- Uses ultraviolet (UV), visible (VIS), near (NIR) and short-wavelength infrared (SWIR) - monitors ozone, methane, formaldehyde, aerosol, carbon monoxide, NO2 and SO2 in the atmosphere
Notebook
3.AP-AQI.ipynb
4.AP-Visualize.ipynb
Diwali
26,27 October
Diwali <=> Pollution
Notebook
5.AP-Compare_Diwali.ipynb
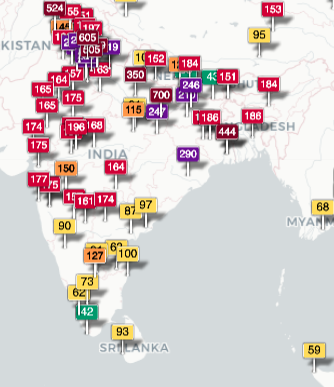
Satellite Imagery > Ground based Senors
for Air Pollution Monitoring
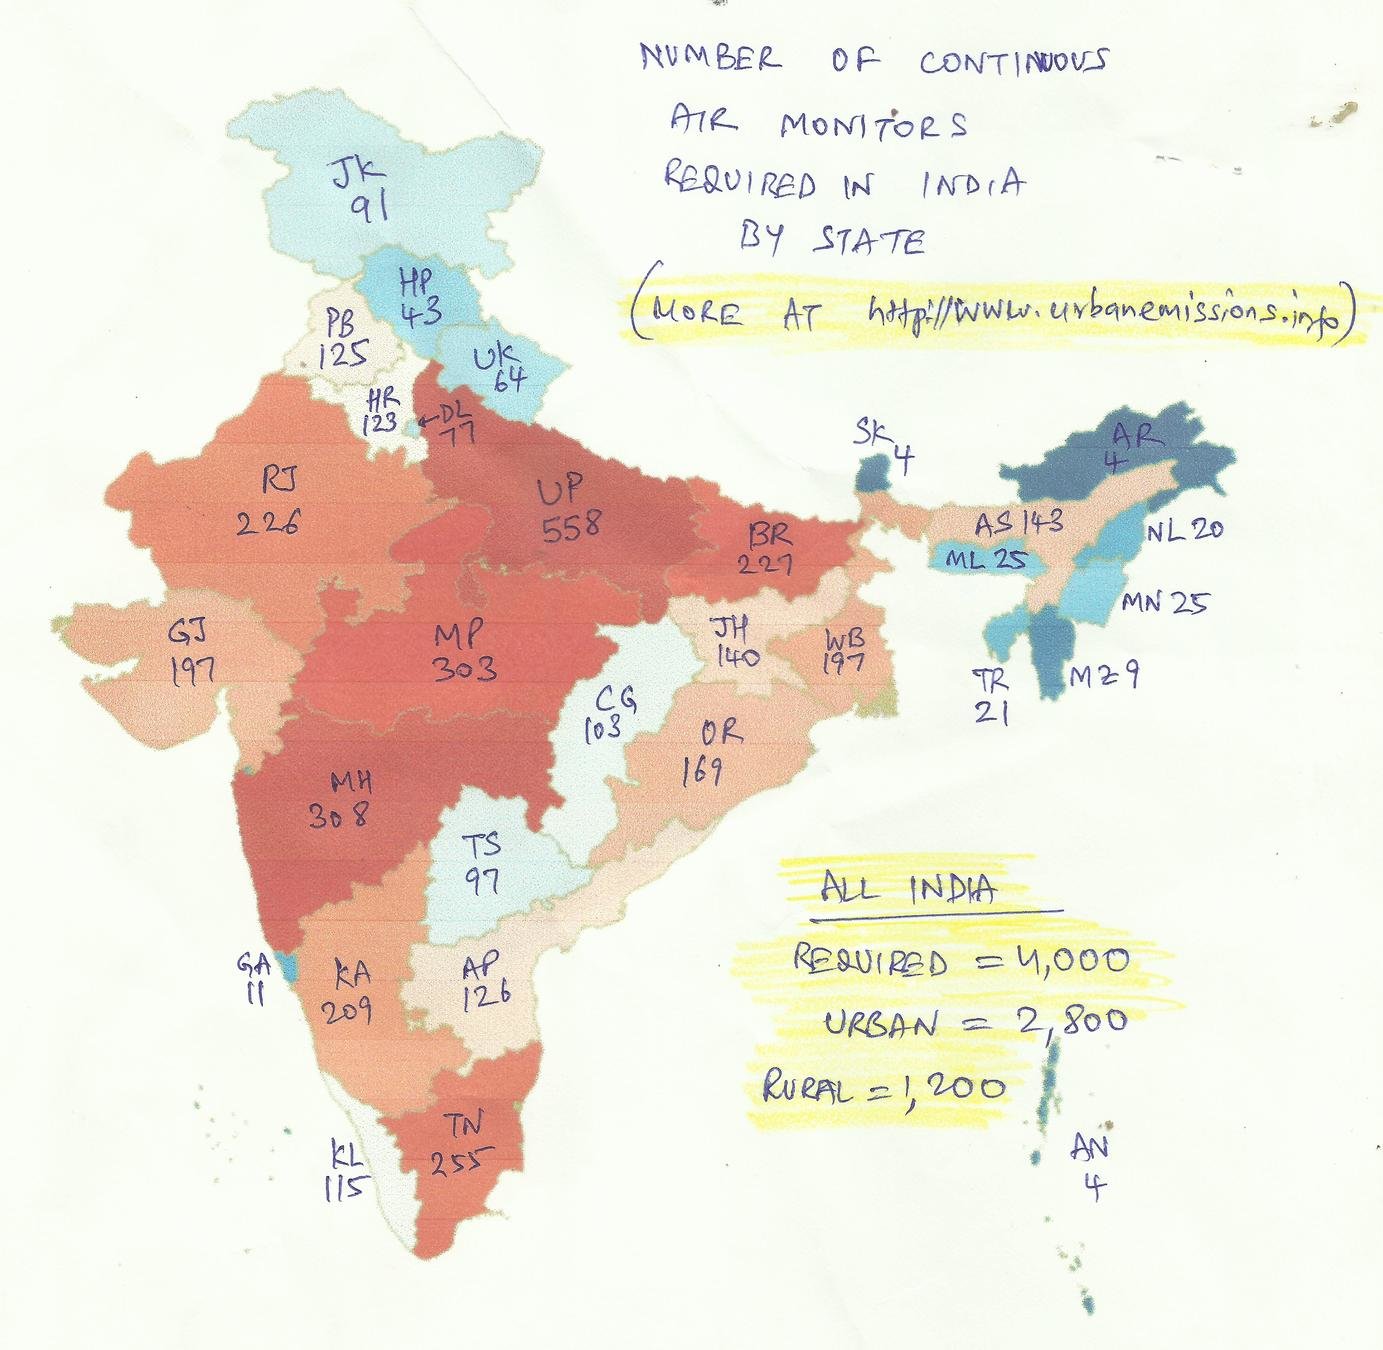
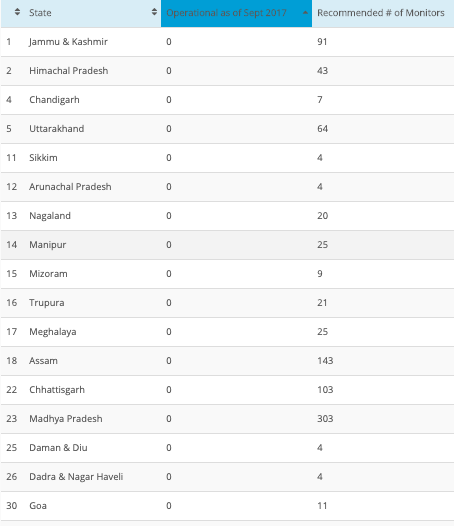
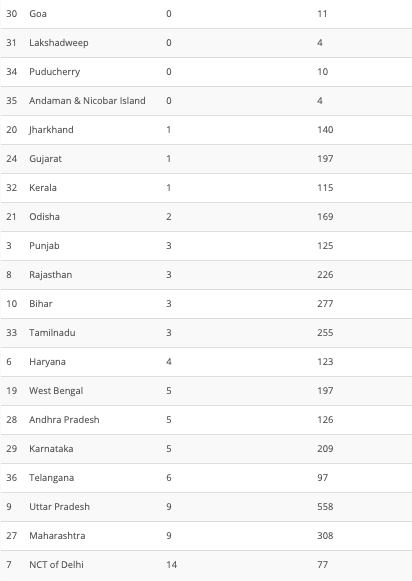
Operational monitor (as of 2017)
Notebook
6.Random-Area-AQI.ipynb
Questions!
gok03.com/air-pollution
Understanding Air-Pollution in Indian Cities using Satellite Imagery
By gokul vasan
