Devtools Obscura
@hacknightly

Let's Find Jank
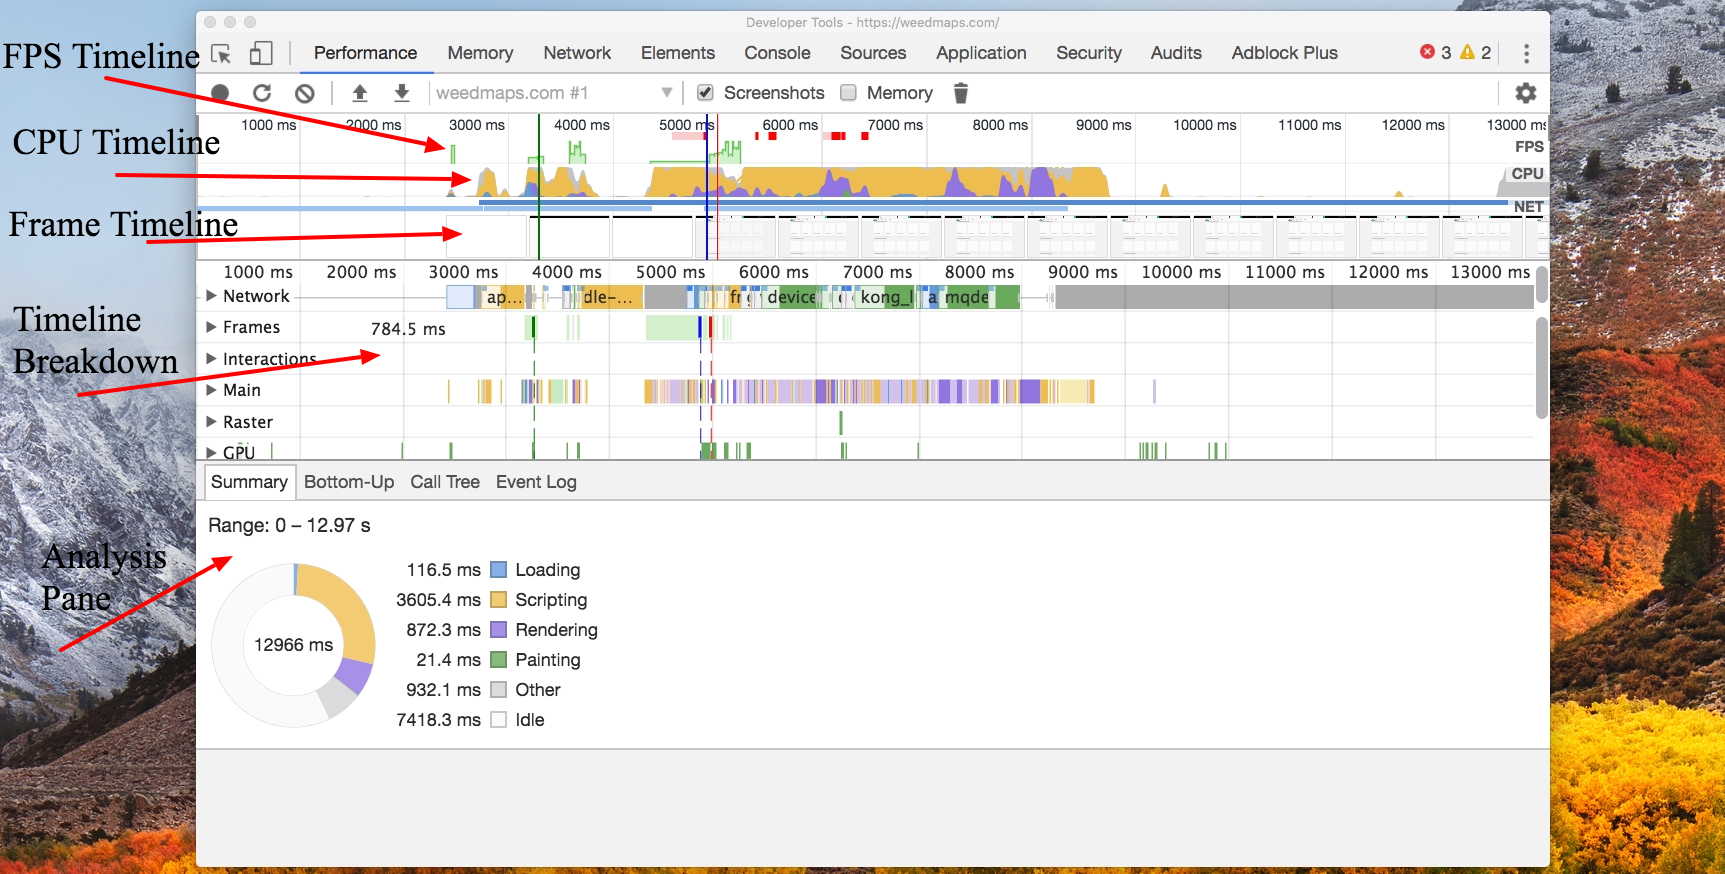
The Legend
This applies to every graph in the performance tab!
The Summary
Everything you analyze will have some type of summary that shows up in this panel
The Utility Belt

Network Panel
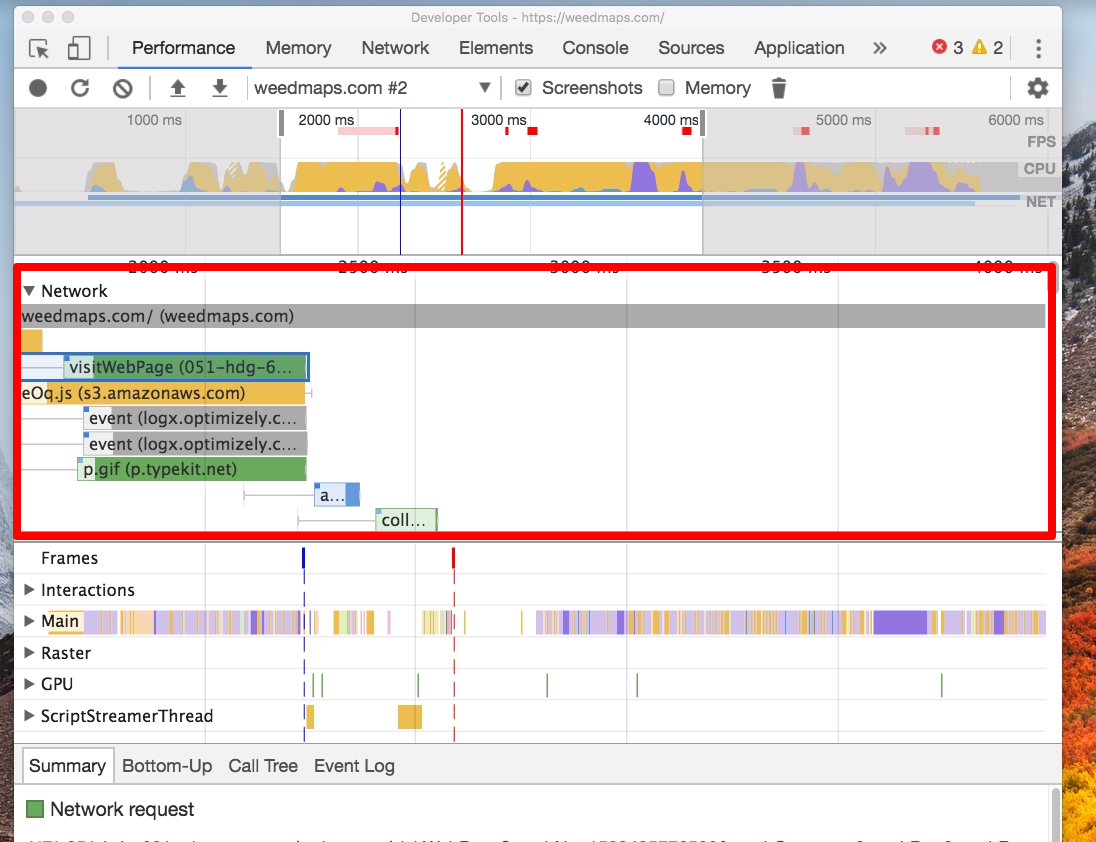
Network Panel Is Cool Because...
- Lets you analyze the full call tree / event log
- Lets you see the analyze request priority
Frames Panel
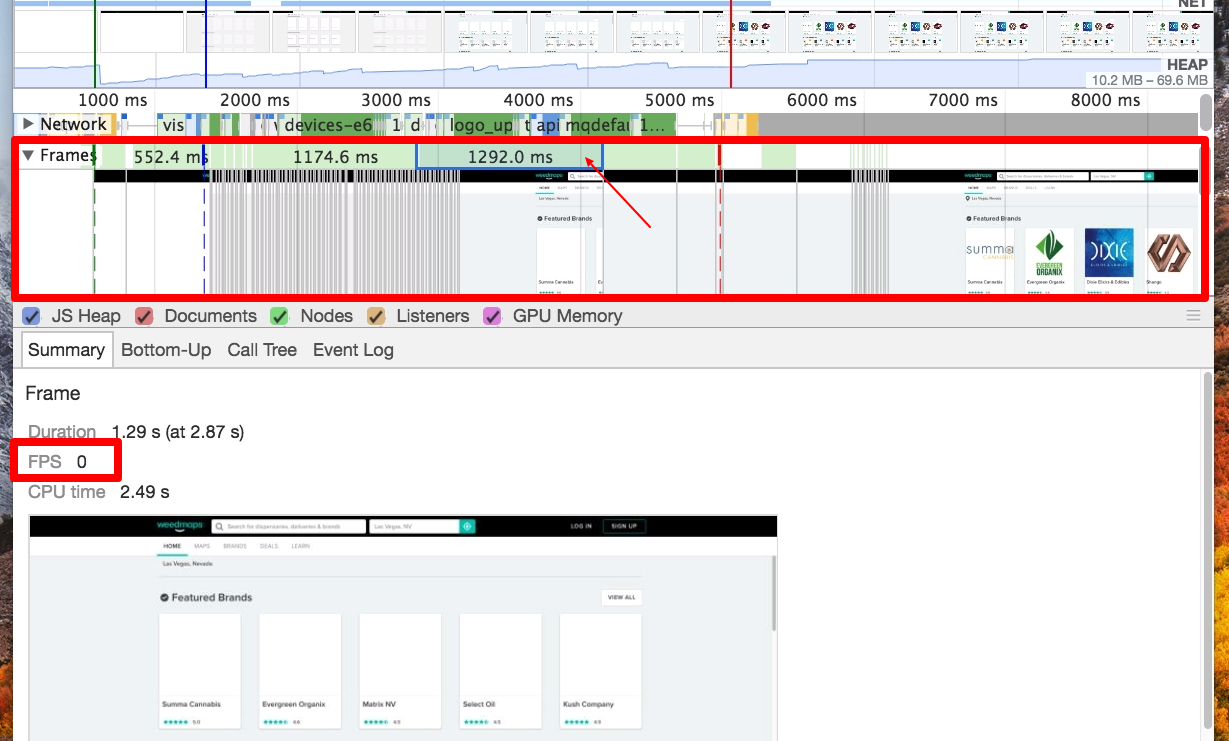
Frames Panel is Dope Because
- Screenshots, yo
- Lets you see the FPS for each frame
- Lets you see CPU time for each frame
- Lets you see the layer information for each frame*
*need to enable special options
Interactions Panel
Main Panel
- View a flame graph of the main thread
- Target specific problem functions
Bottom Up Analysis
When you want to view the activities where the most time was directly spent
Call Tree Analysis
When you want to view the root activities that cause the most work
Event Log
When you want to view the activities in the order in which they occurred during the recording
Fin
deck
By hacknightly


