


Daniel Haehn PRO
Hi, I am a biomedical imaging and visualization researcher who investigates how computational methods can accelerate biological and medical research.
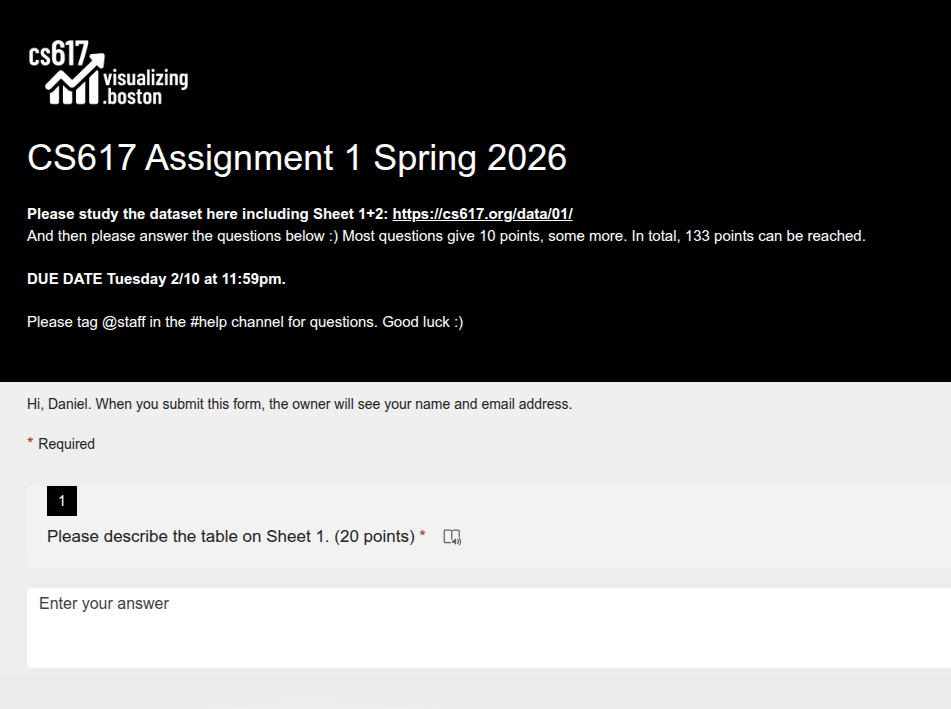
Assignment 2
Due Monday 2/16!
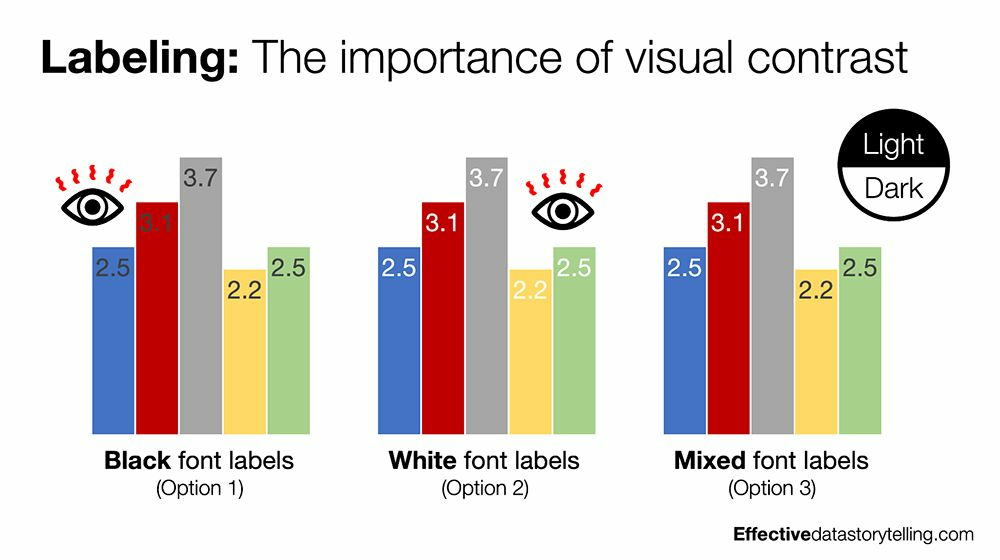
colorbrewer2.org is good for any design stuff
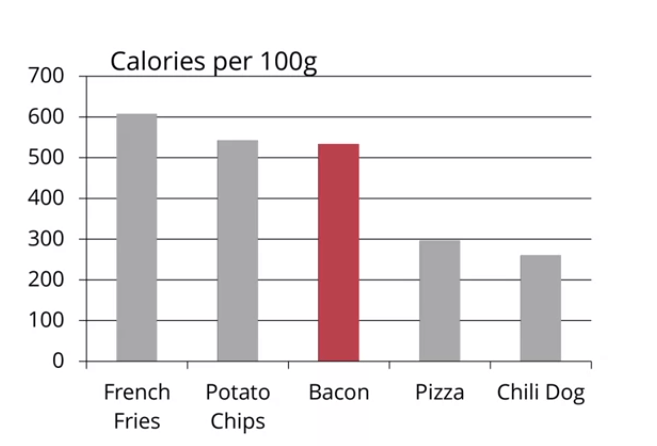
Data-Ink Ratio
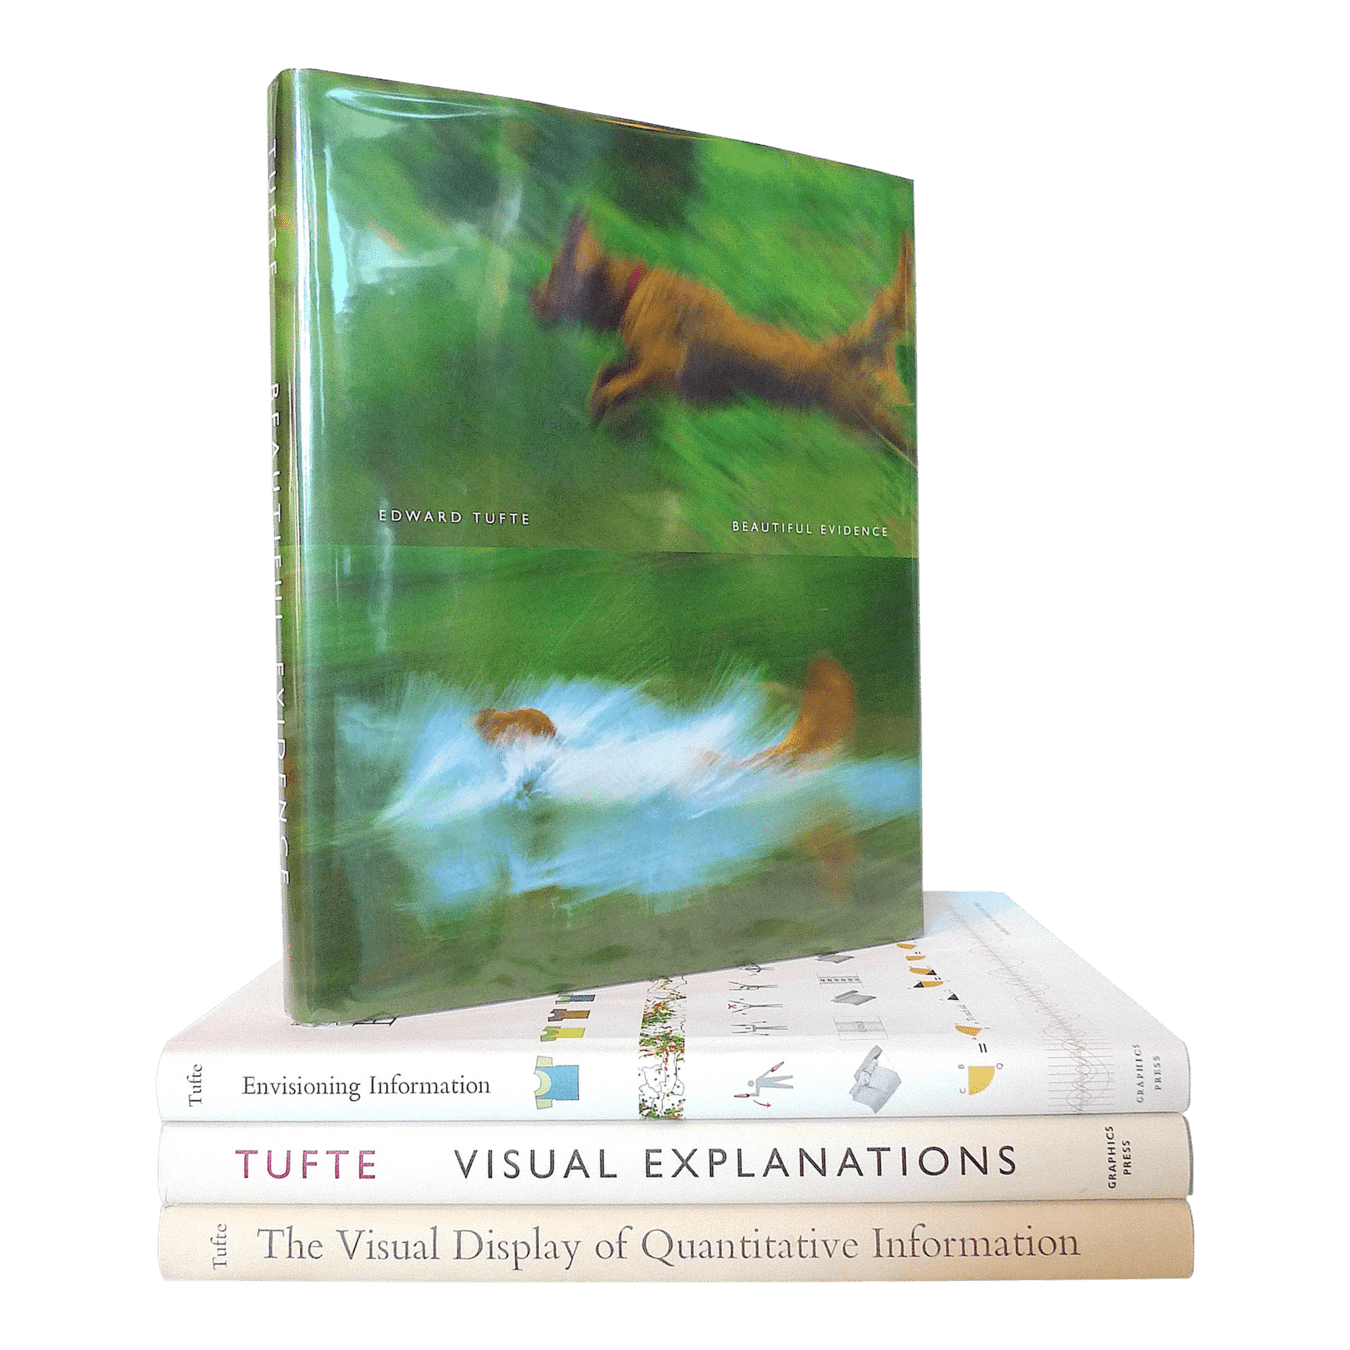
Edward Tufte
Data Visualization Pioneer
Sparklines
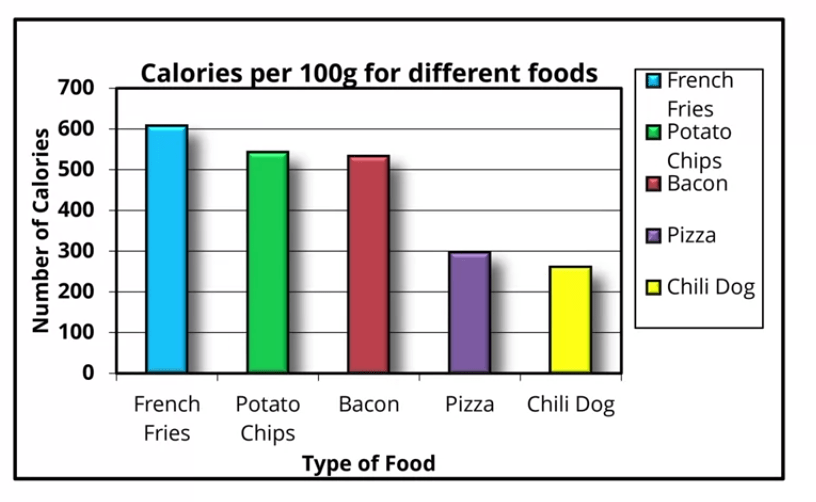
Data-Ink Ratio
Background
Data-Ink Ratio
Redundancy: Legend, Axis labels, Title
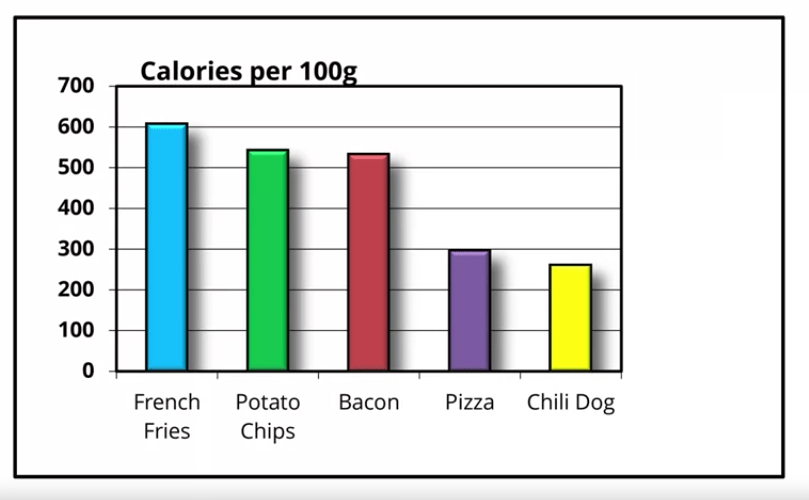
Data-Ink Ratio
Remove borders
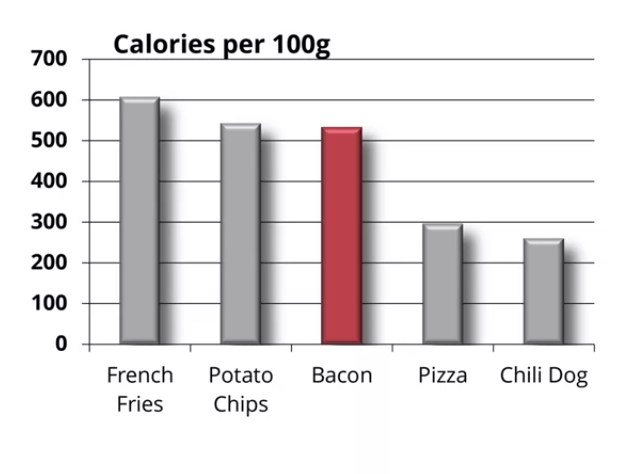
Data-Ink Ratio
Reduce colors
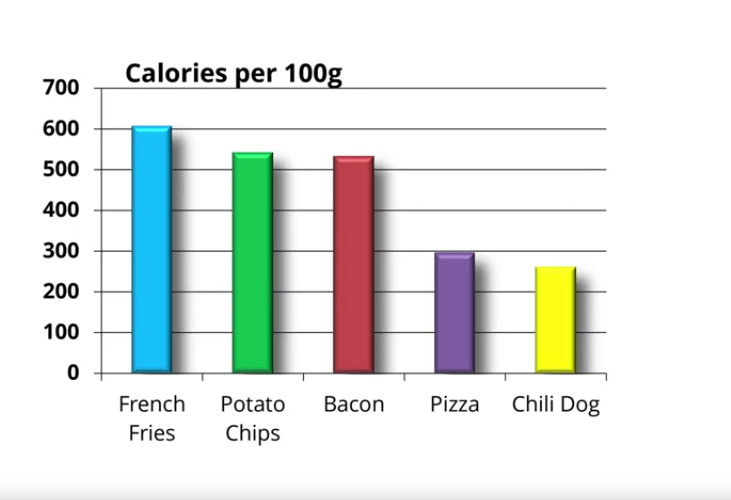
Data-Ink Ratio
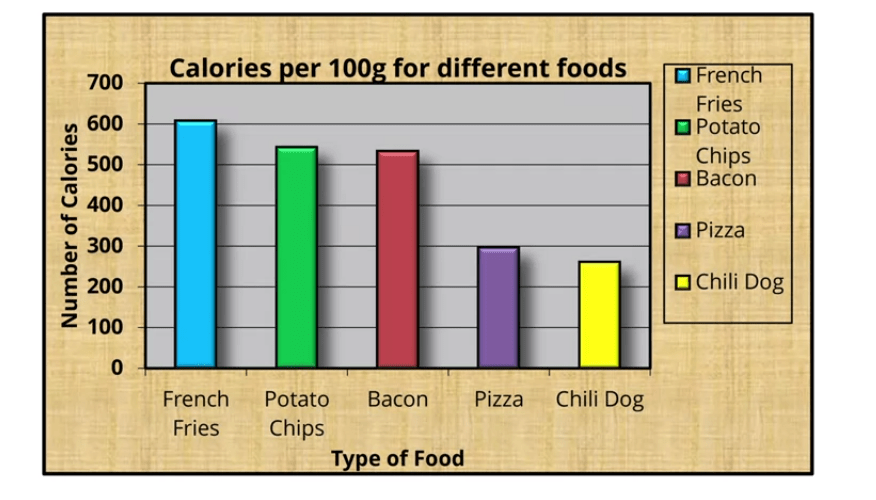
Remove 3D and shadows
Data-Ink Ratio
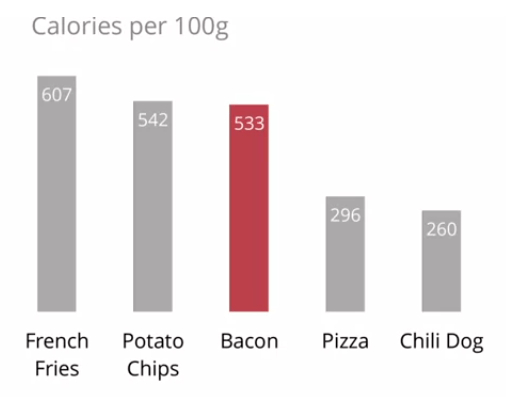
Remove grid and axis
Data-Ink Ratio
Tufte's final version
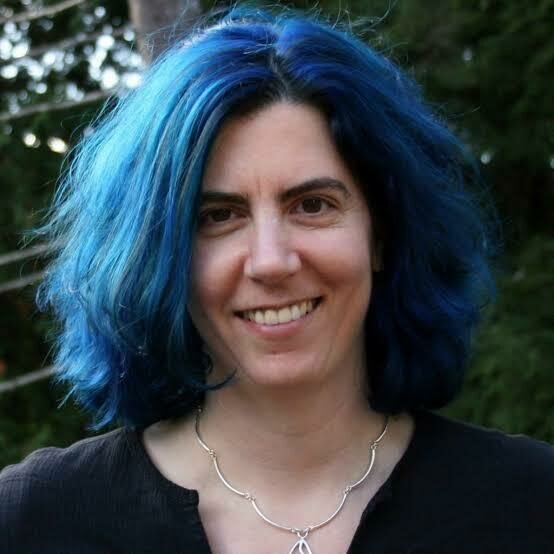
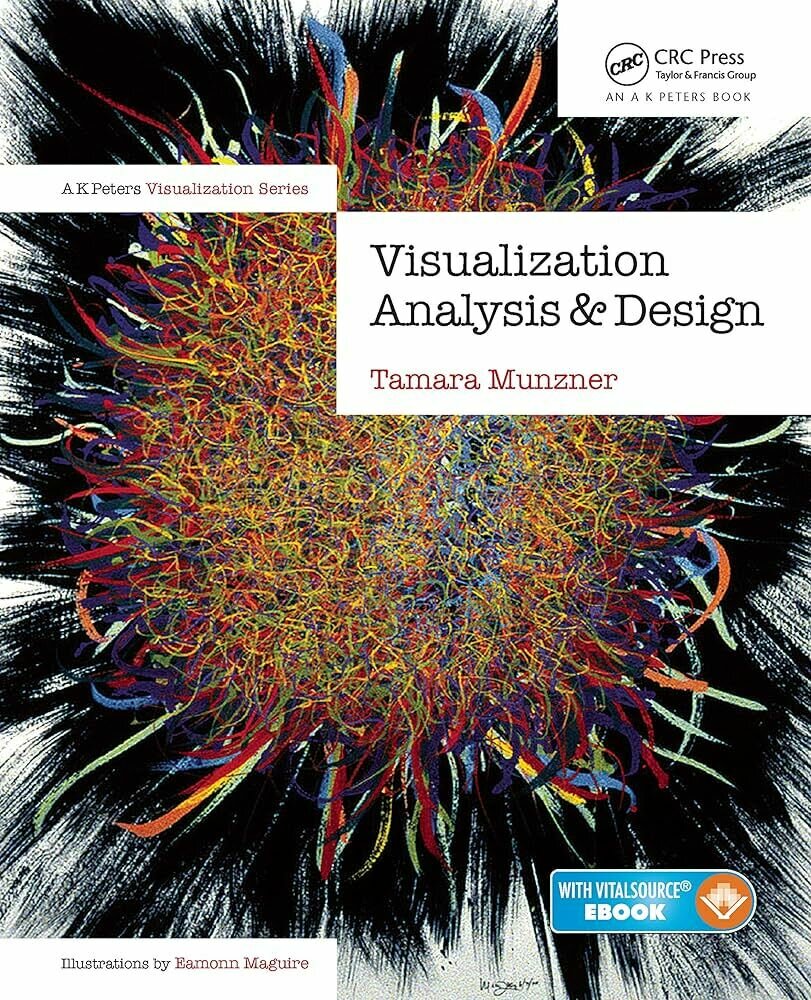
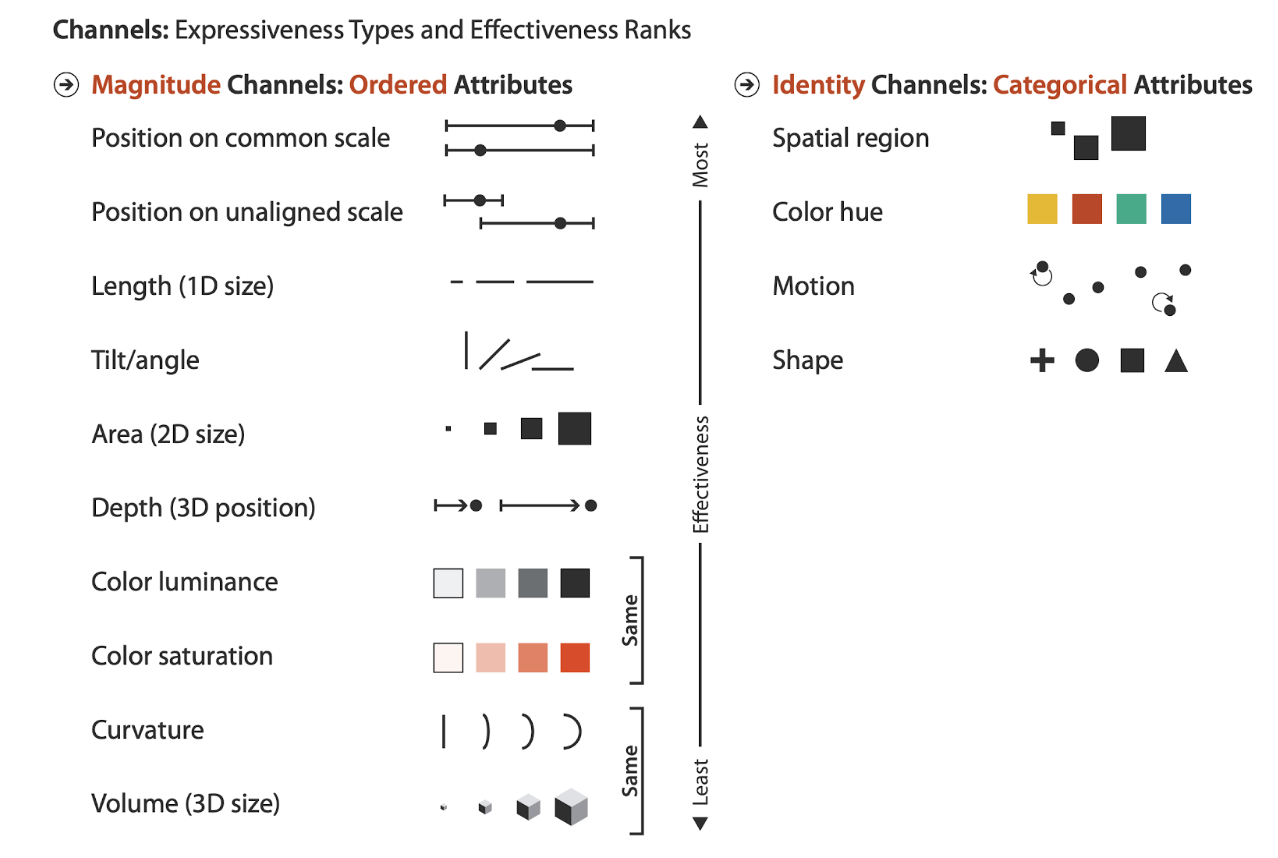
Tamara Munzner
IEEE VGTC Visualization Technical Achievement Award
IEEE InfoVis 10-Year Test of Time Award
IEEE Fellow
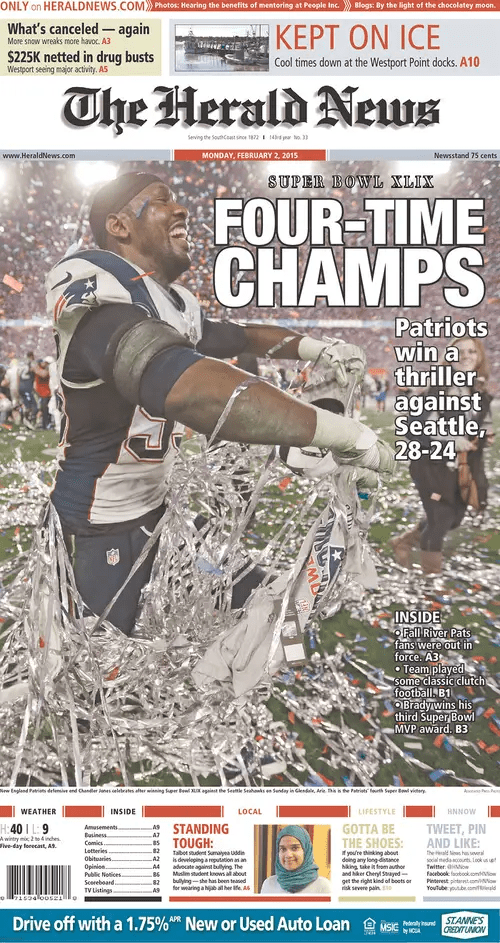
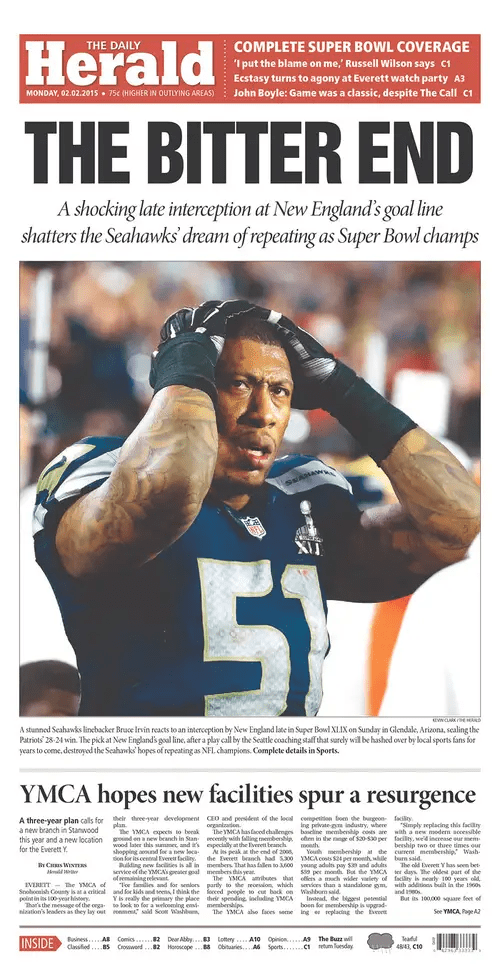
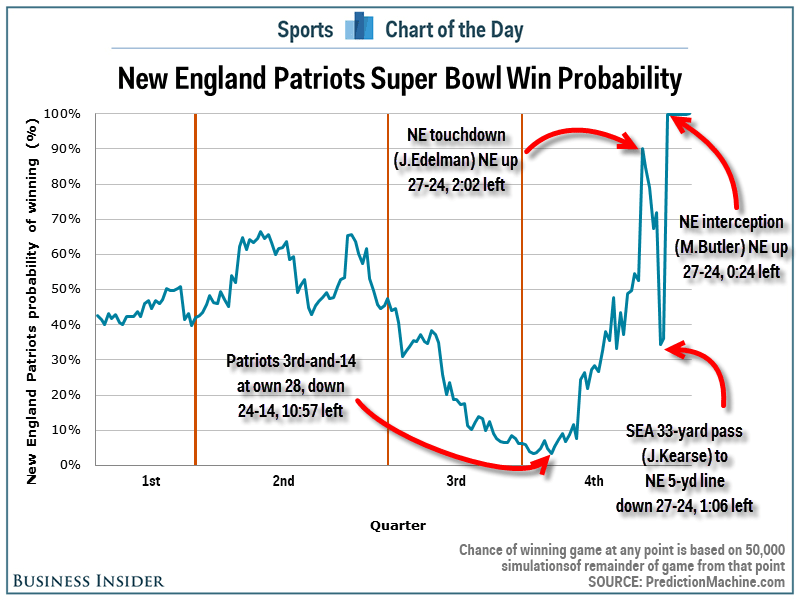
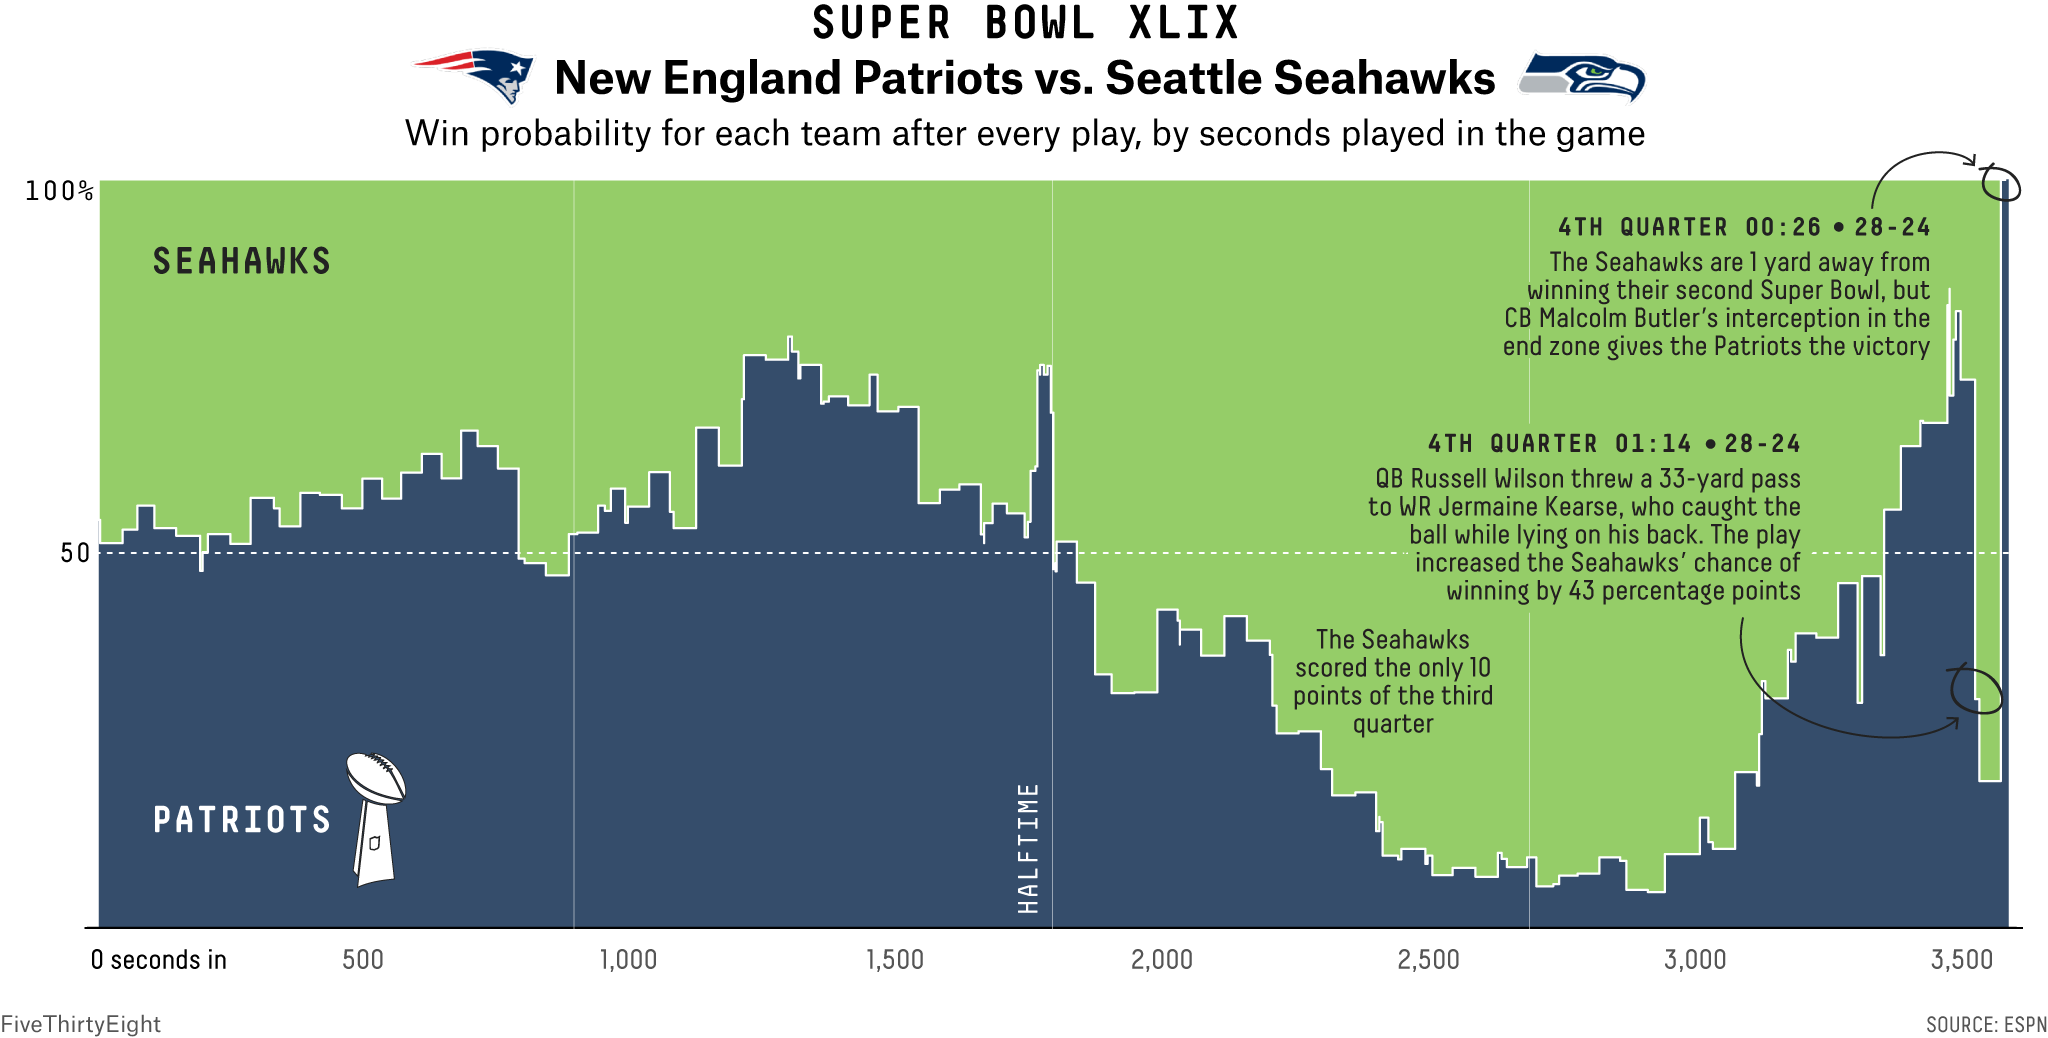
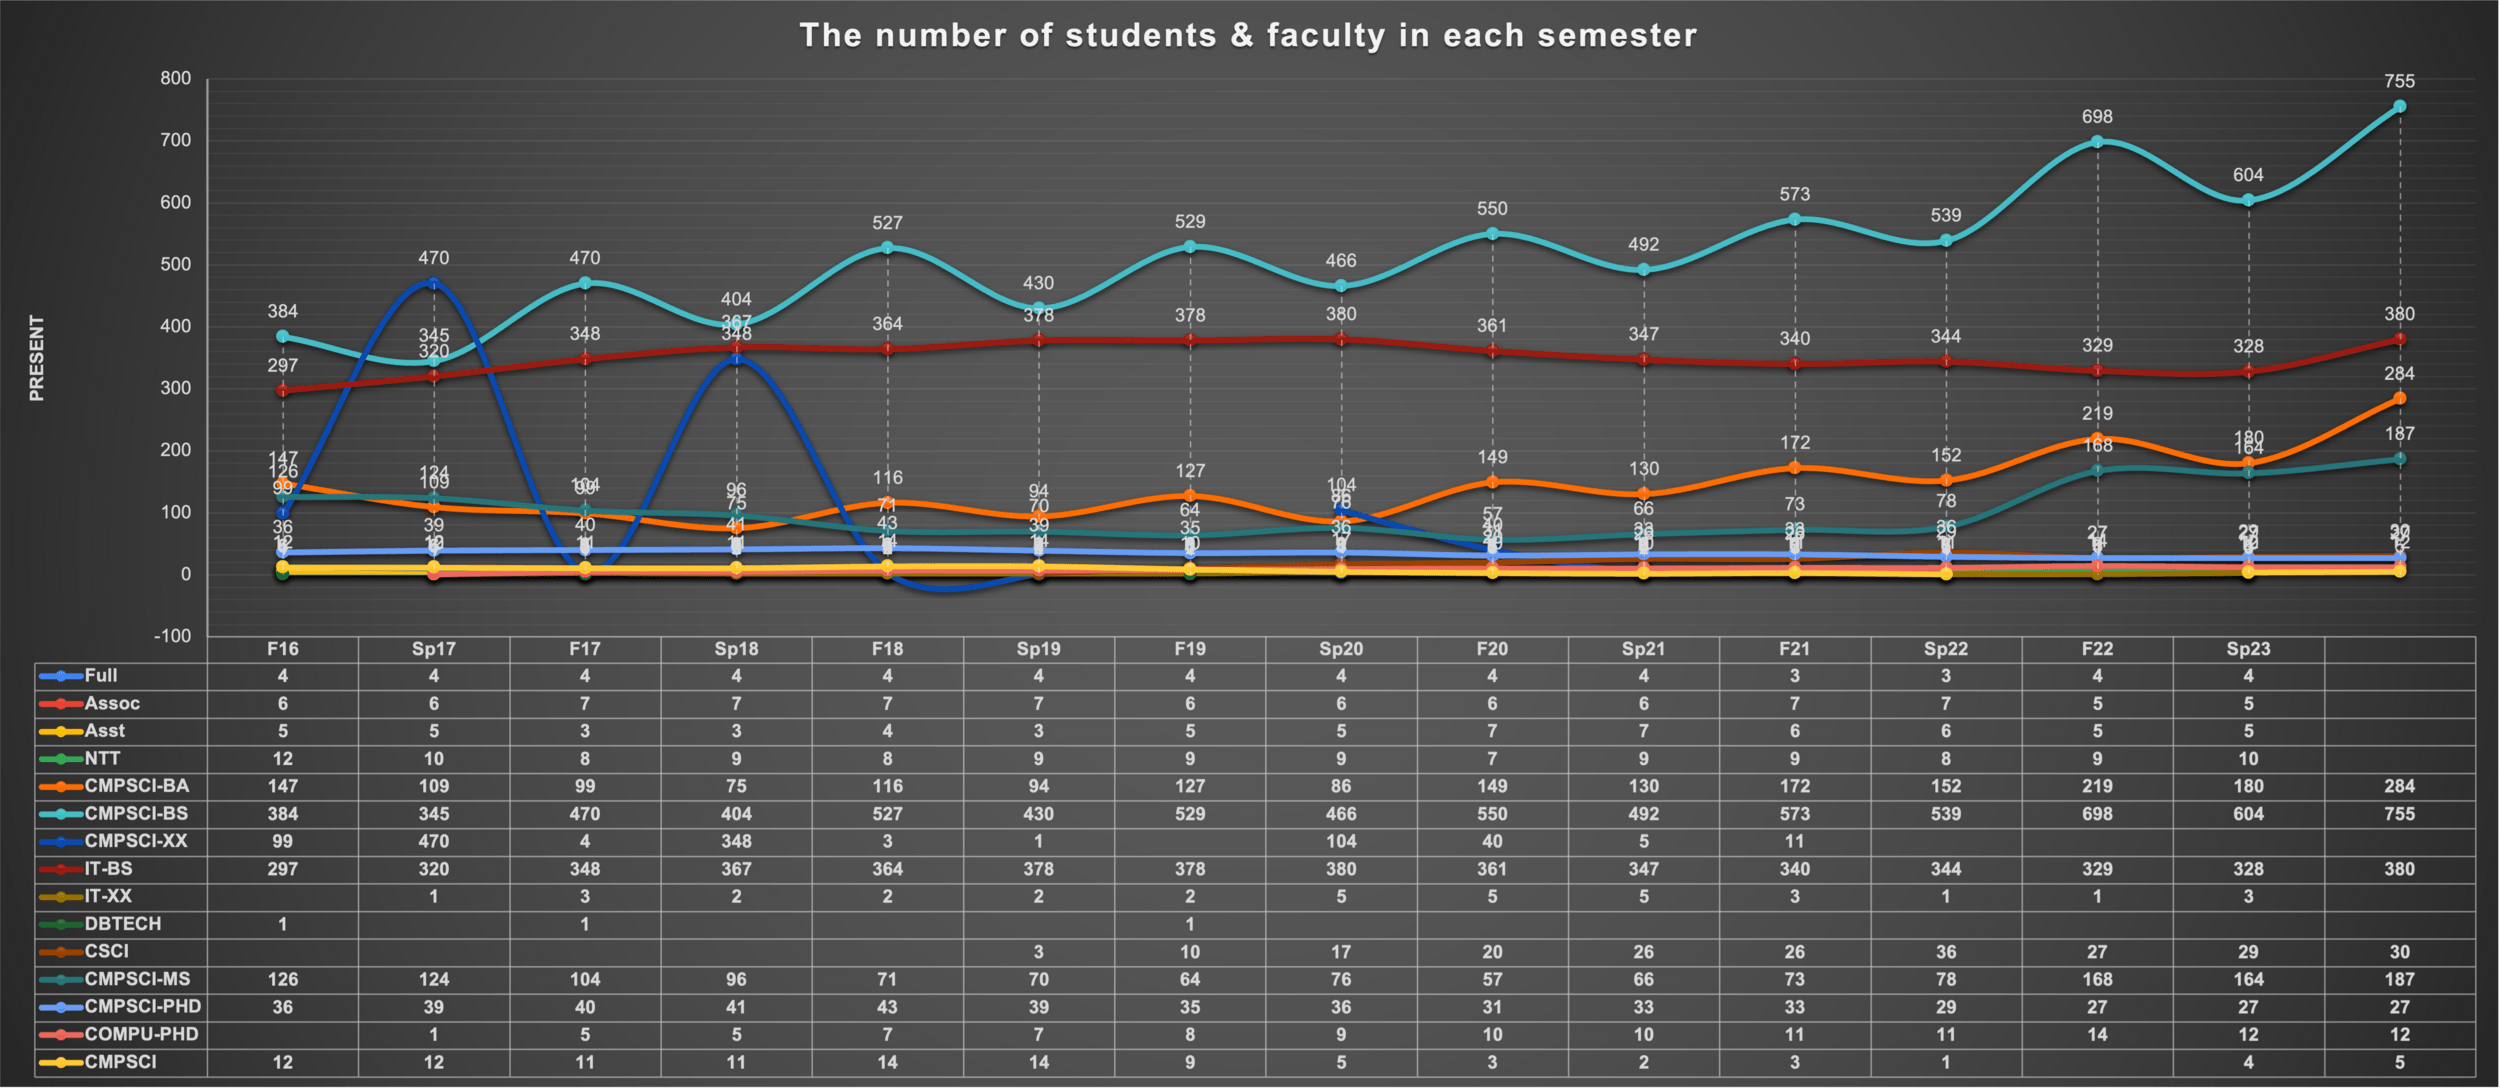
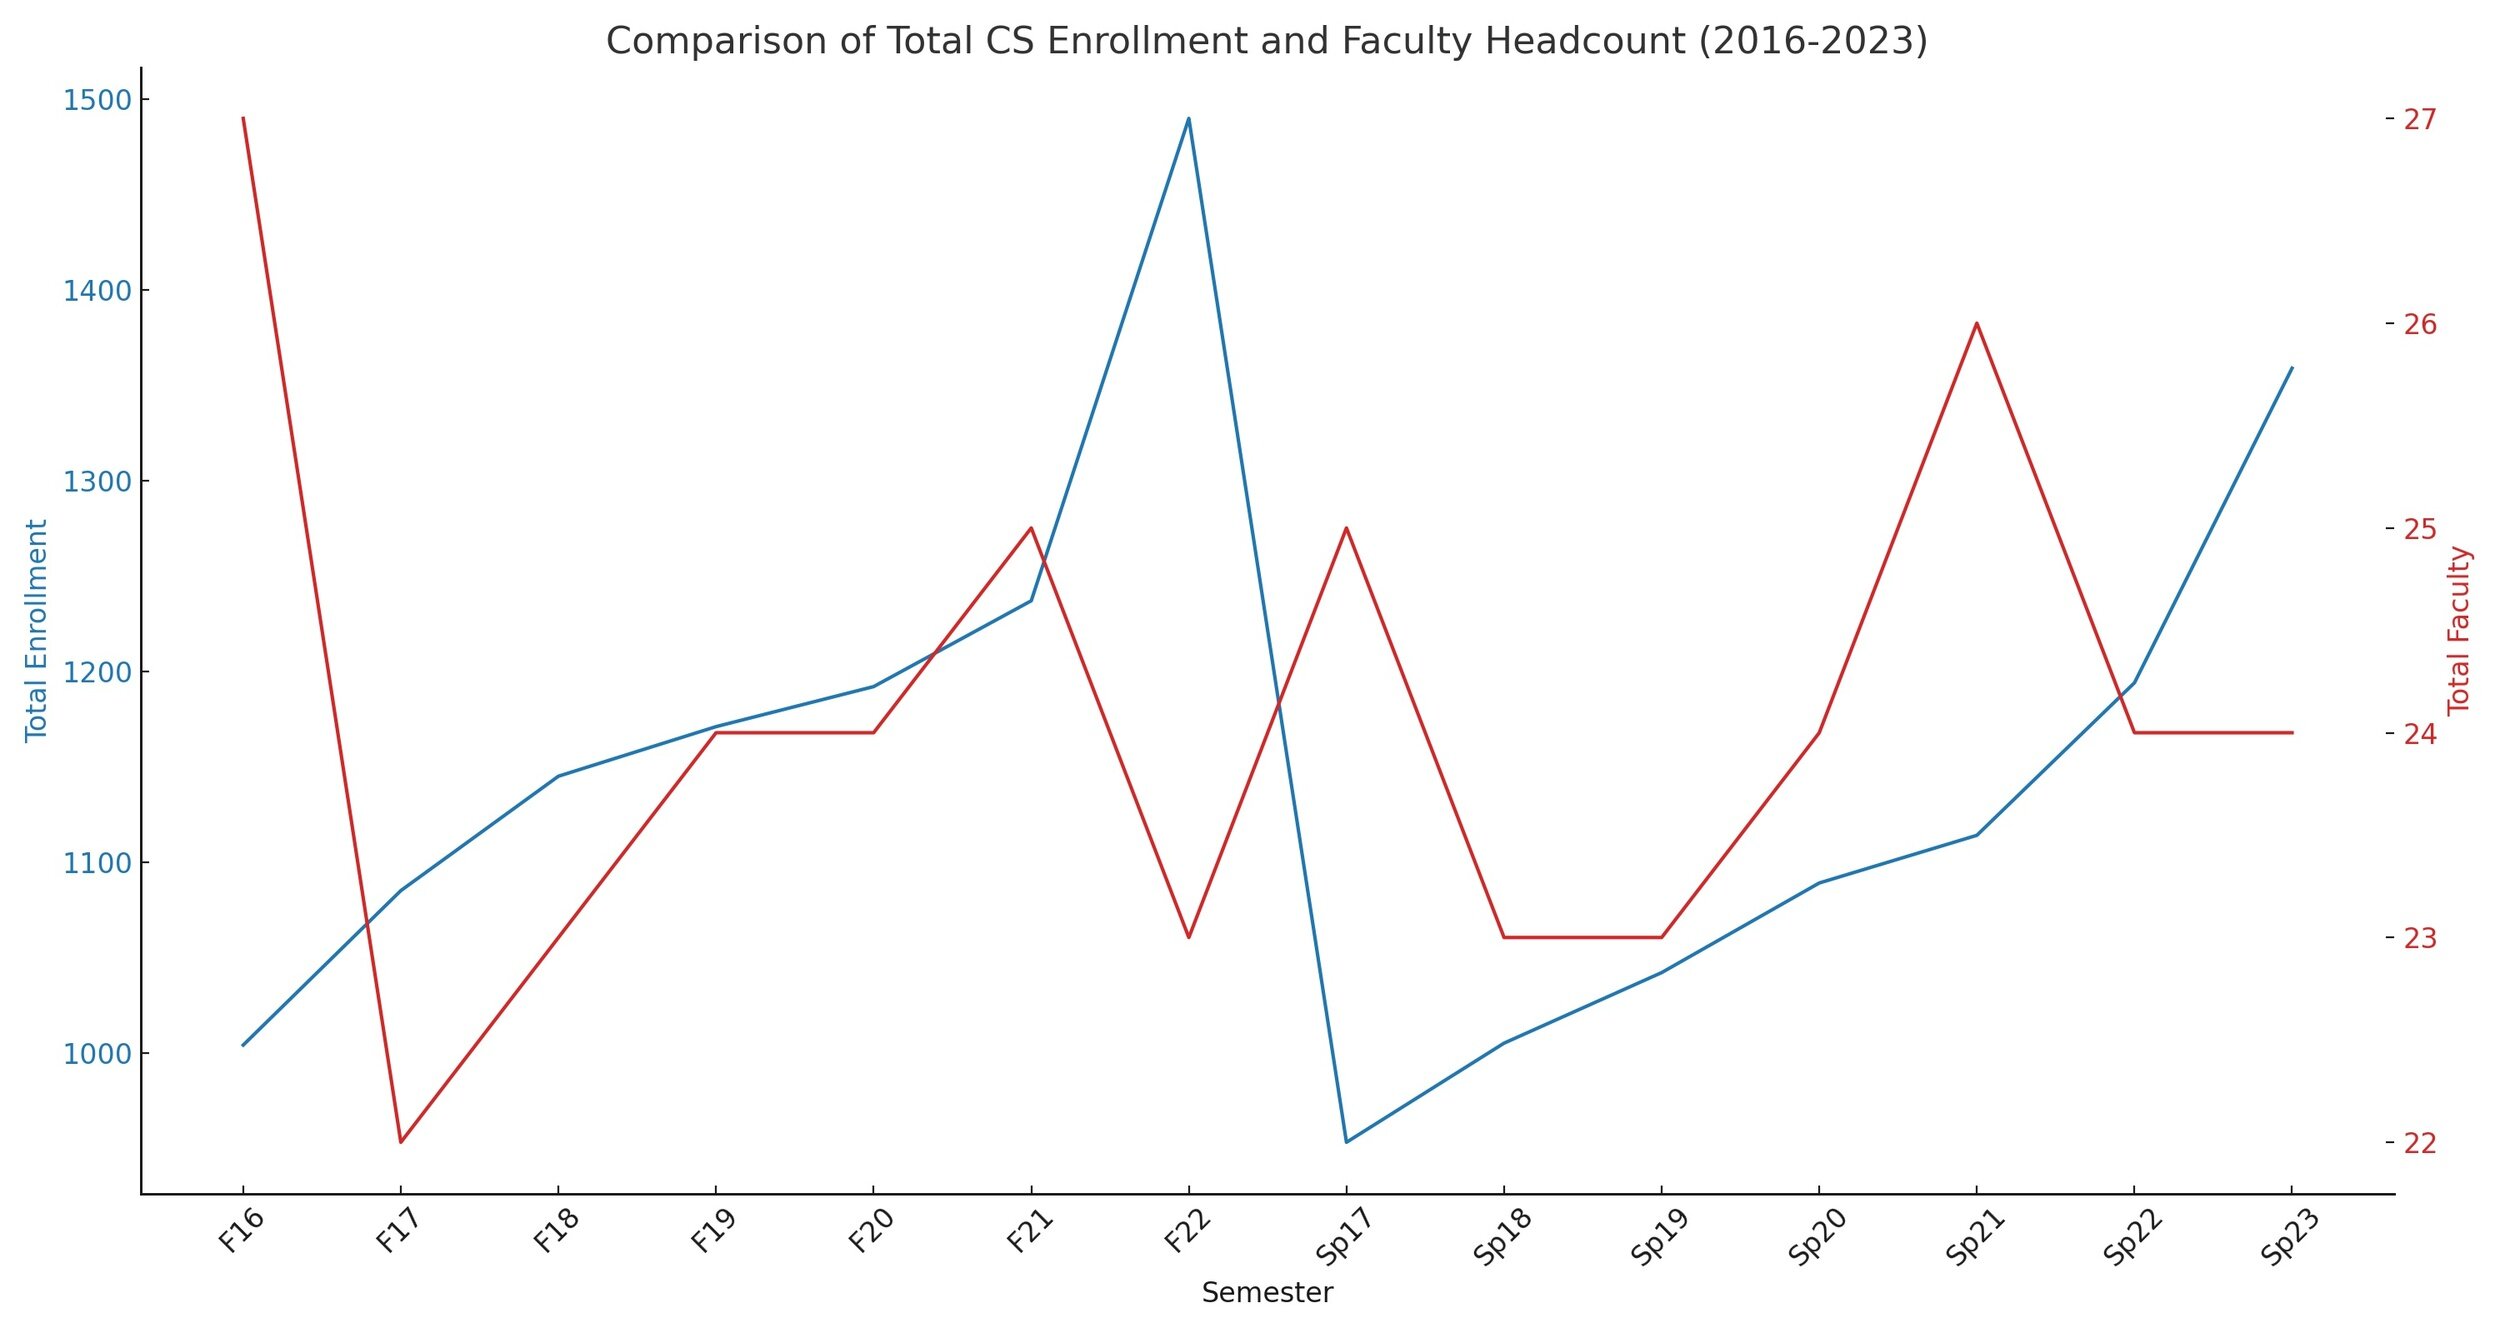
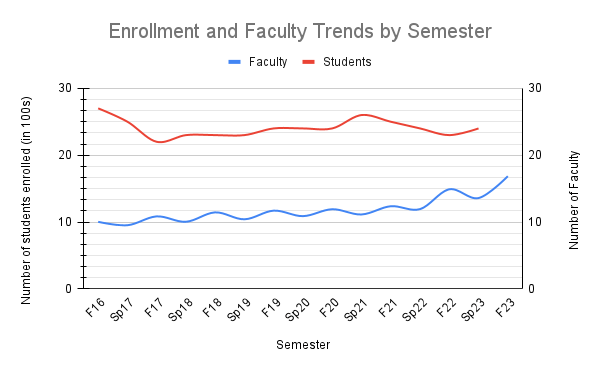
Design Critique
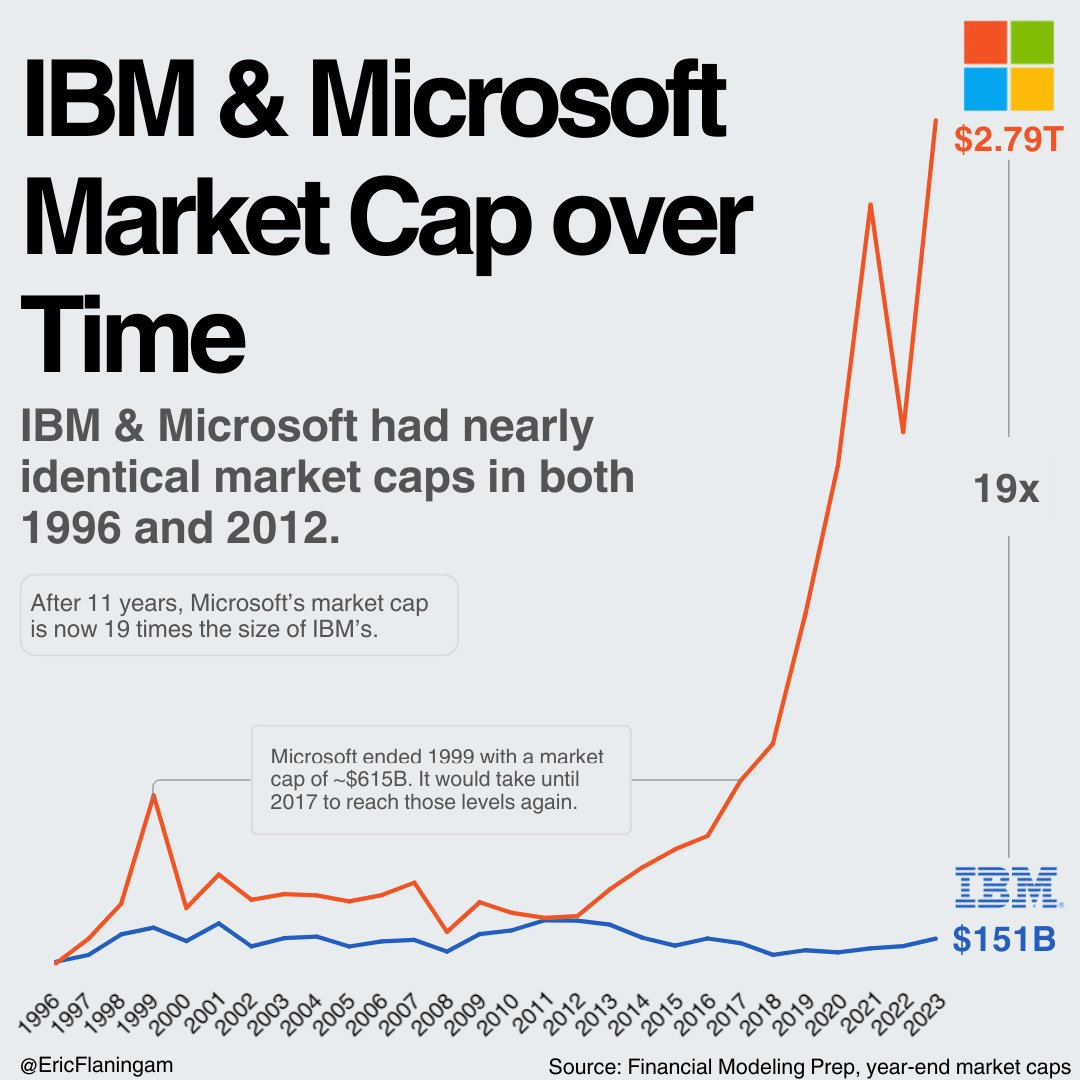
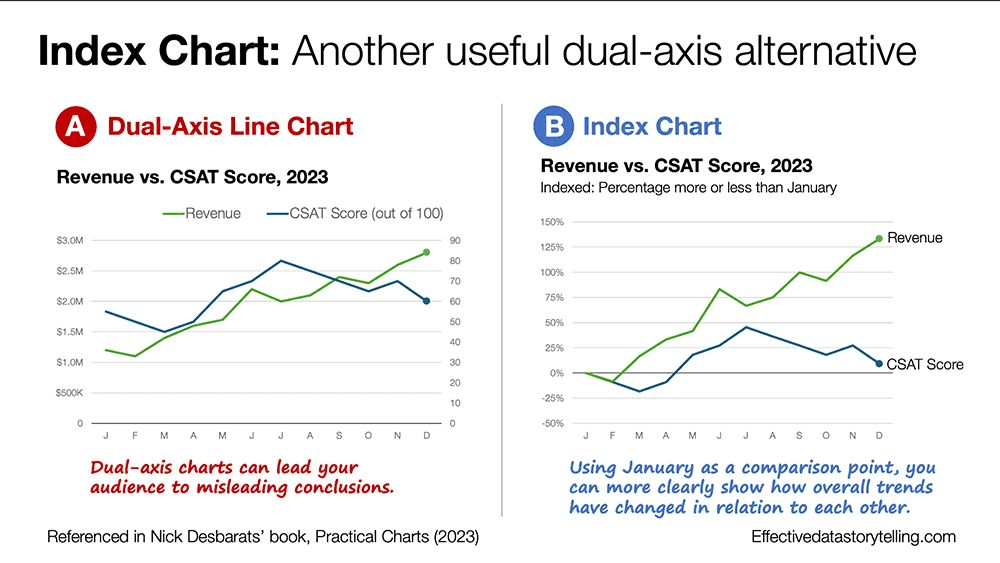
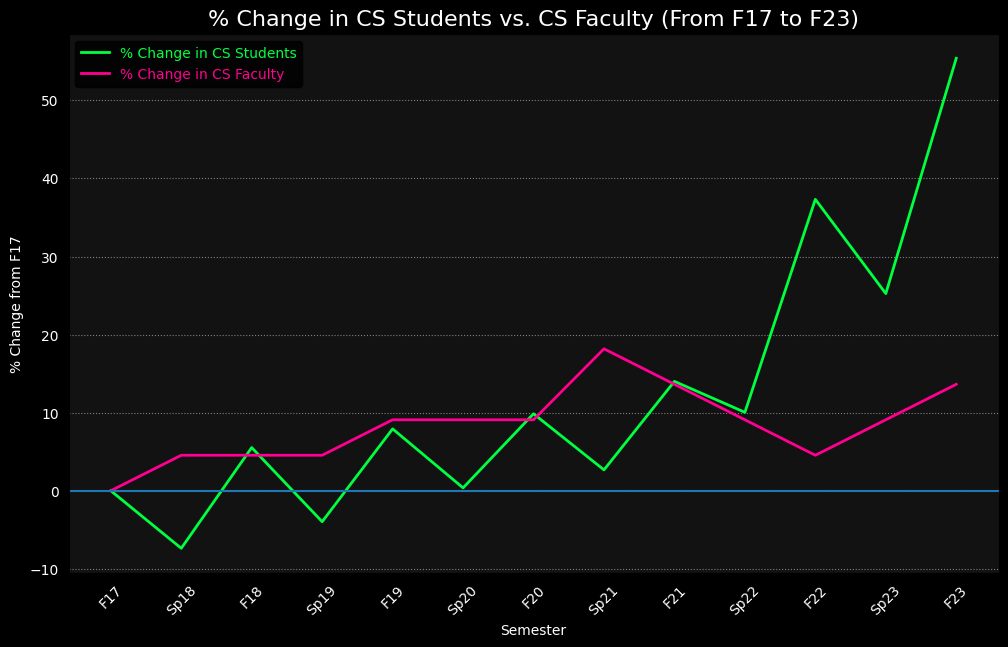
From Dual-Axis to Indexed Chart
pandas
['F16', 'Sp17', 'F17', 'Sp18', 'F18', 'Sp19', 'F19', 'Sp20', 'F20', 'Sp21', 'F21', 'Sp22', 'F22', 'Sp23', 'F23']
[1004.0, 953.0, 1085.0, 1005.0, 1145.0, 1042.0, 1171, 1089.0, 1192.0, 1114.0, 1237.0, 1194.0, 1490.0, 1359.0, 1686.0]
[27, 25, 22, 23, 23, 23, 24, 24, 24, 26, 25, 24, 23, 24, 25]
[(value / BASELINE - 1) * 100 for value in data]
Homework
Create a minimal plotly.js example of a line plot!
license for all of you
download for win / mac
or in the cloud
Avanith Kanamarlapudi
Homework
By Daniel Haehn
Slides for CS617 VISUALIZING.BOSTON - See https://cs617.orghttps://cs617.org


