


Daniel Haehn PRO
Hi, I am a biomedical imaging and visualization researcher who investigates how computational methods can accelerate biological and medical research.
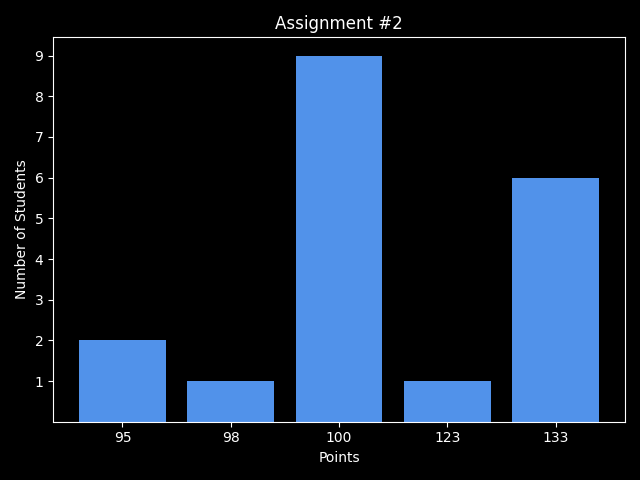
Assignment 2
Due Monday 2/16!
We will talk about github pages today!!
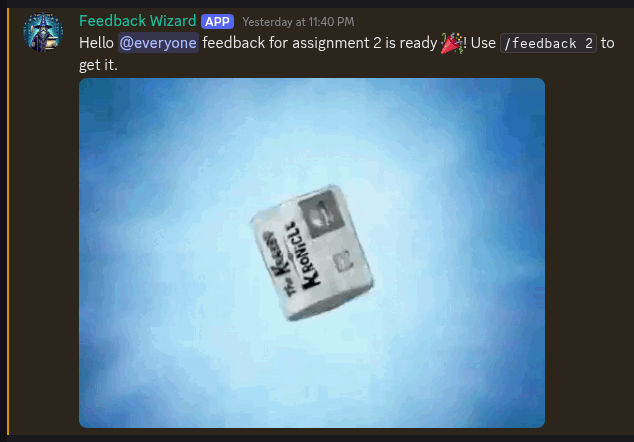
#feedback
/feedback 2
Edward Gaibor
Homework
1. Favorite projects?
2. Inspiration for the Next Generation?
3. Favorite technologies?
Avanith Kanamarlapudi
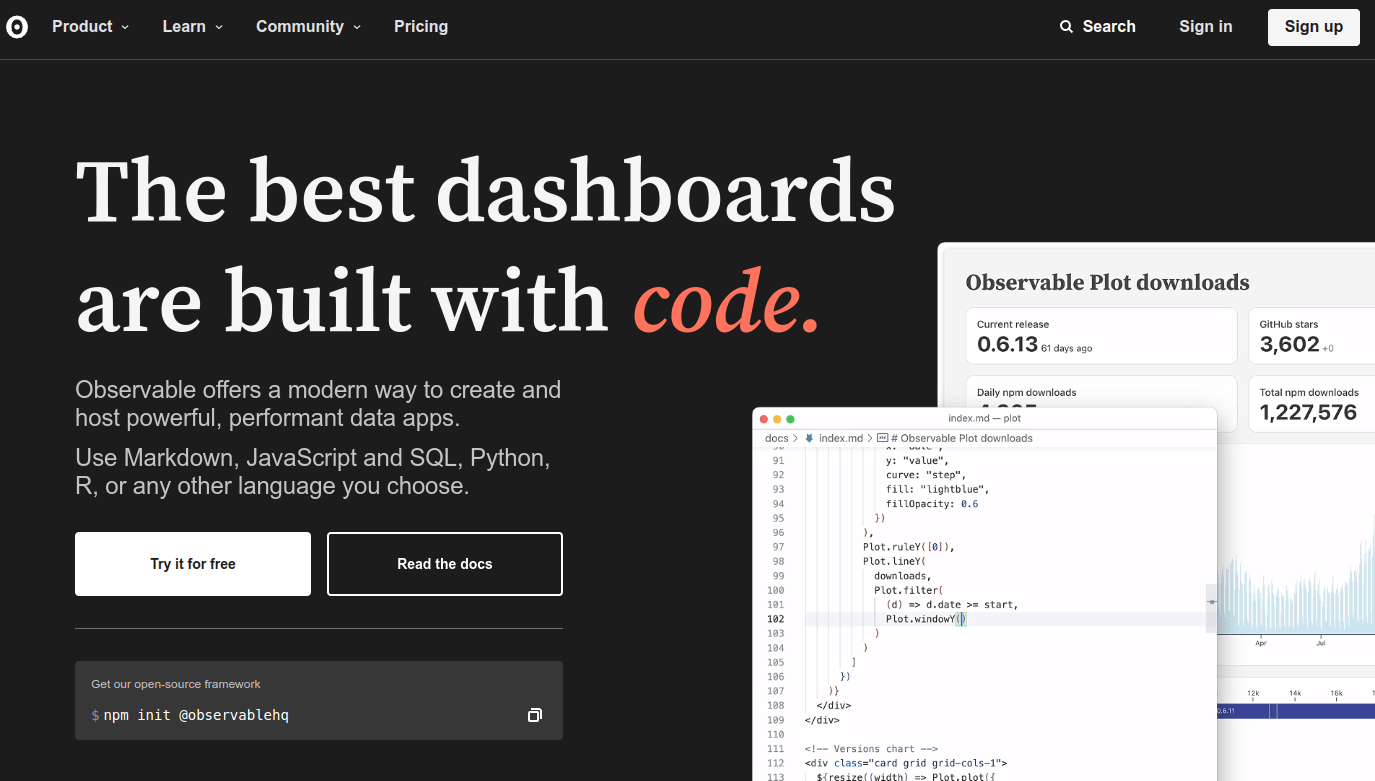
point-and-click
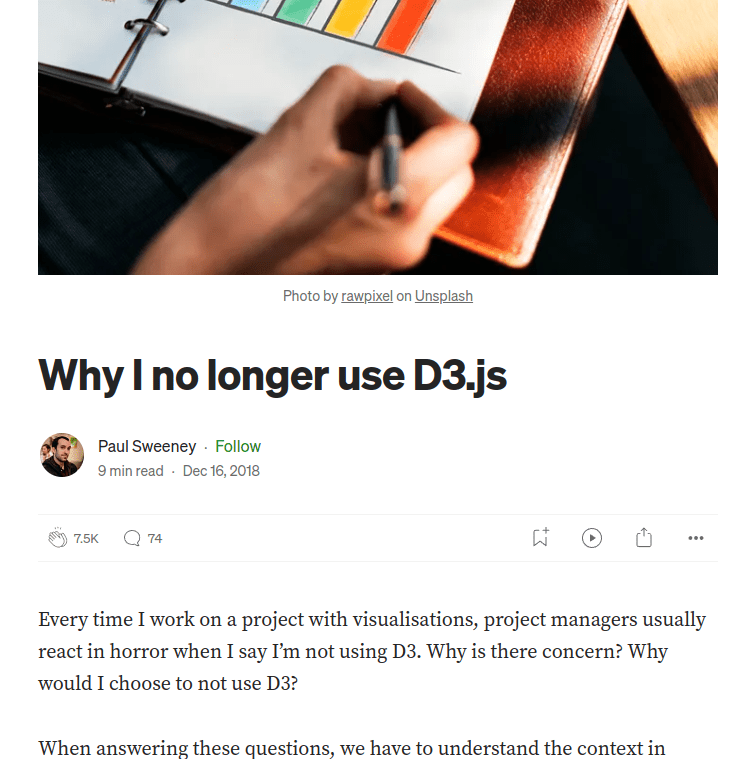
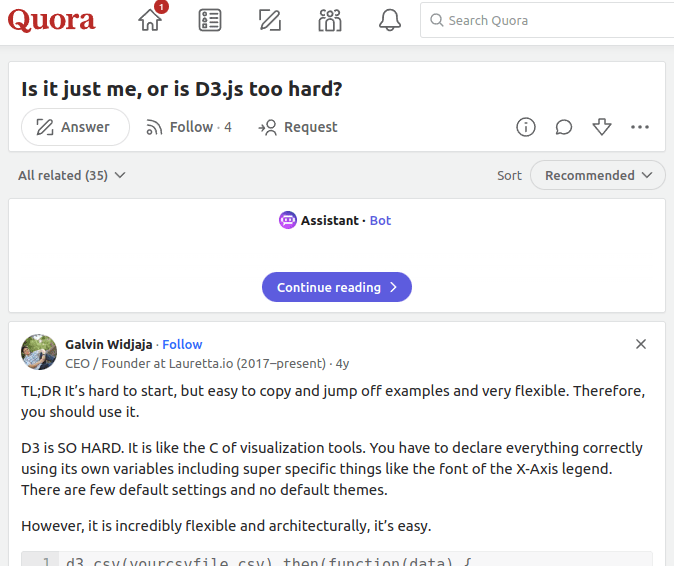
code-driven
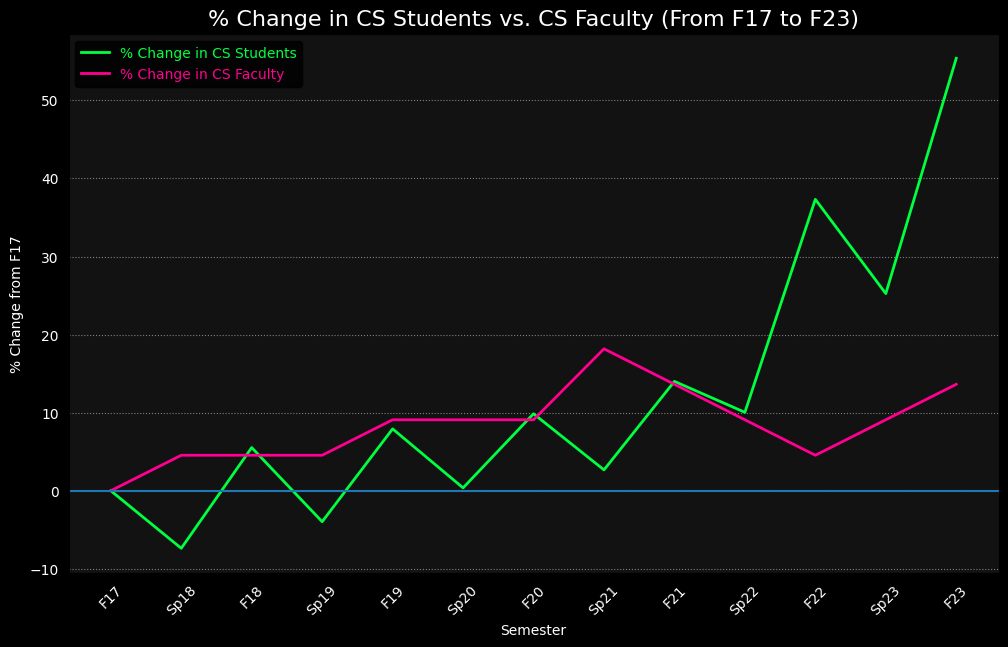
From Dual-Axis to Indexed Chart
pandas
['F16', 'Sp17', 'F17', 'Sp18', 'F18', 'Sp19', 'F19', 'Sp20', 'F20', 'Sp21', 'F21', 'Sp22', 'F22', 'Sp23', 'F23']
[1004.0, 953.0, 1085.0, 1005.0, 1145.0, 1042.0, 1171, 1089.0, 1192.0, 1114.0, 1237.0, 1194.0, 1490.0, 1359.0, 1686.0]
[27, 25, 22, 23, 23, 23, 24, 24, 24, 26, 25, 24, 23, 24, 25]
[(value / BASELINE - 1) * 100 for value in data]
Homework
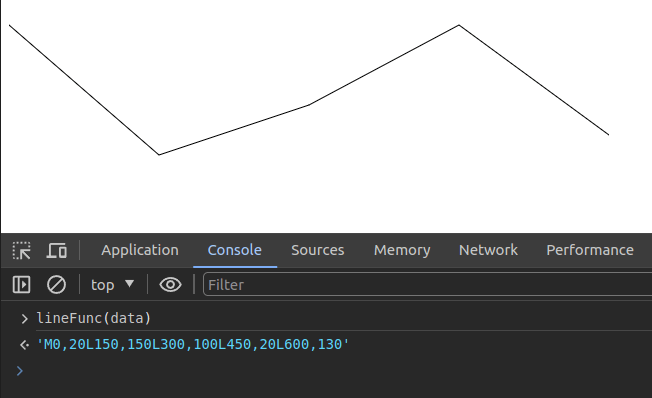
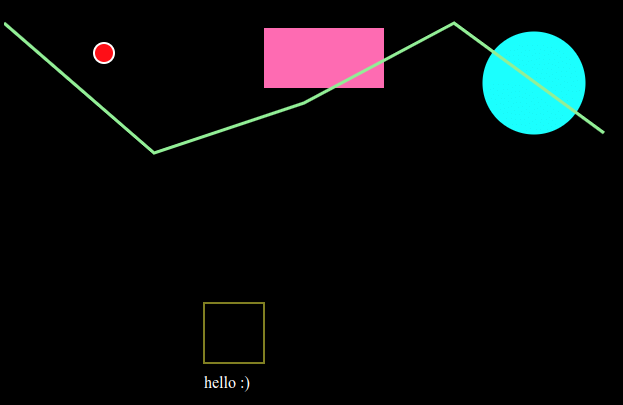
Create a minimal D3.js linechart!
<html>
<head>
    <script src="https://d3js.org/d3.v7.min.js"></script>
</head>
<body>
    <svg id='s' width="600" height="400"></svg>
    <script>

        // create data
        var data = [{x: 0, y: 20},
                    {x: 150, y: 150},
                    {x: 300, y: 100},
                    {x: 450, y: 20},
                    {x: 600, y: 130}]

        // grab svg
        var svg = d3.select("svg");

        // prepare a helper function
        var lineFunc = d3.line()
        .x( function(d) { return d.x } )
        .y( function(d) { return d.y } )

        // Add the path using this helper function
        svg.append('path')
        .attr('d', lineFunc(data))
        .attr('stroke', 'black')
        .attr('fill', 'none');

    </script>
</body>
</html>
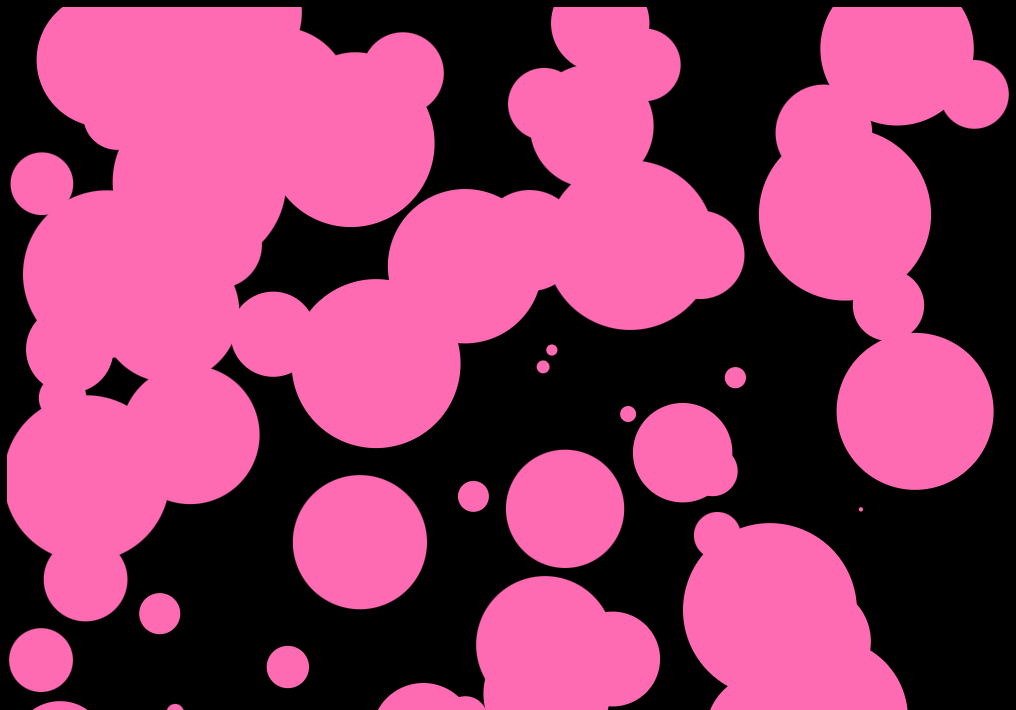
Homework
Create a new circle every second until 100 randomly positioned circles are on the screen.
By Daniel Haehn
Slides for CS617 VISUALIZING.BOSTON - See https://cs617.orghttps://cs617.org


