


Daniel Haehn PRO
Hi, I am a biomedical imaging and visualization researcher who investigates how computational methods can accelerate biological and medical research.
Homework
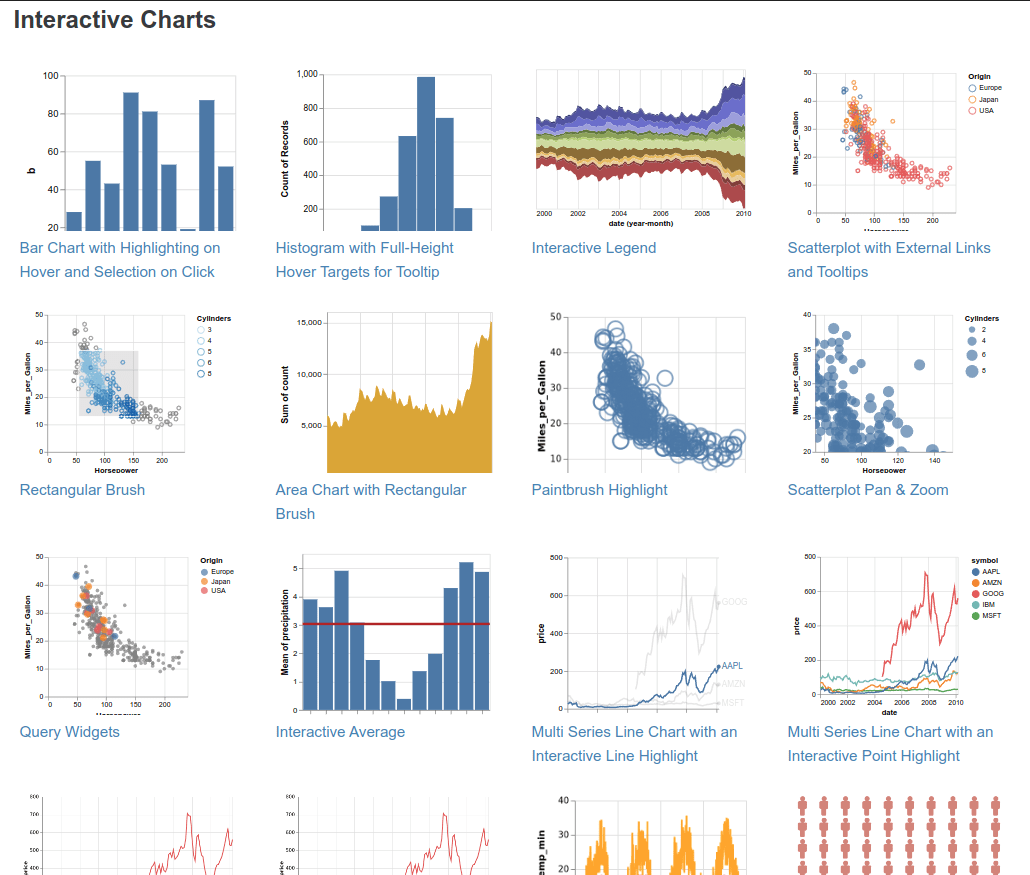
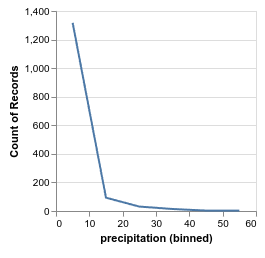
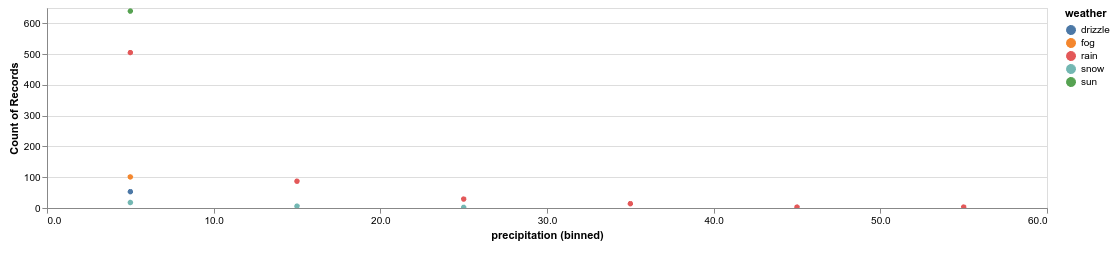
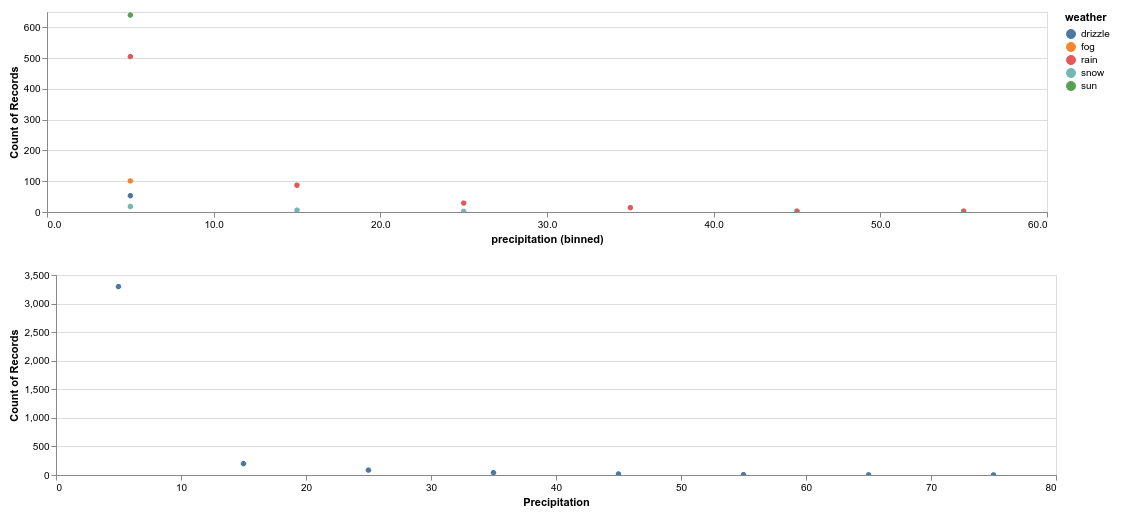
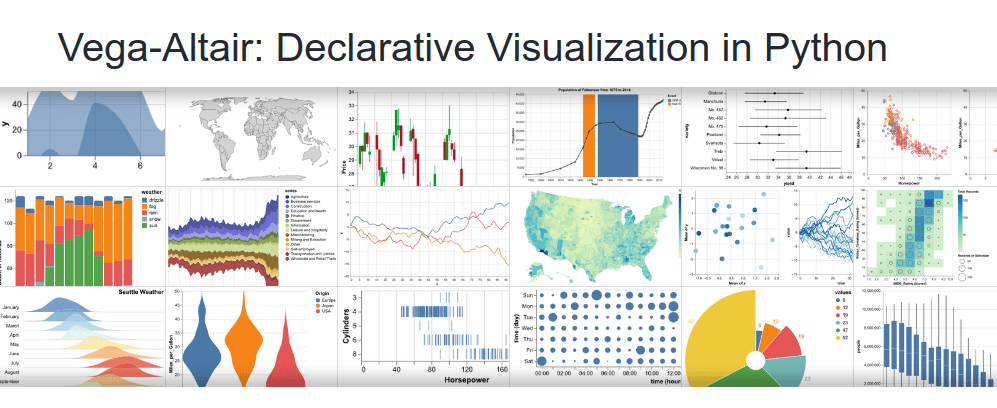
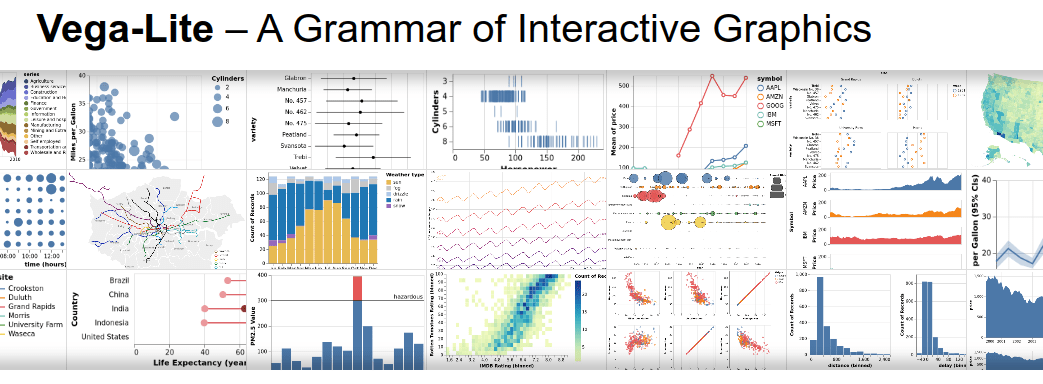
Study an interactive Vega-Lite chart!
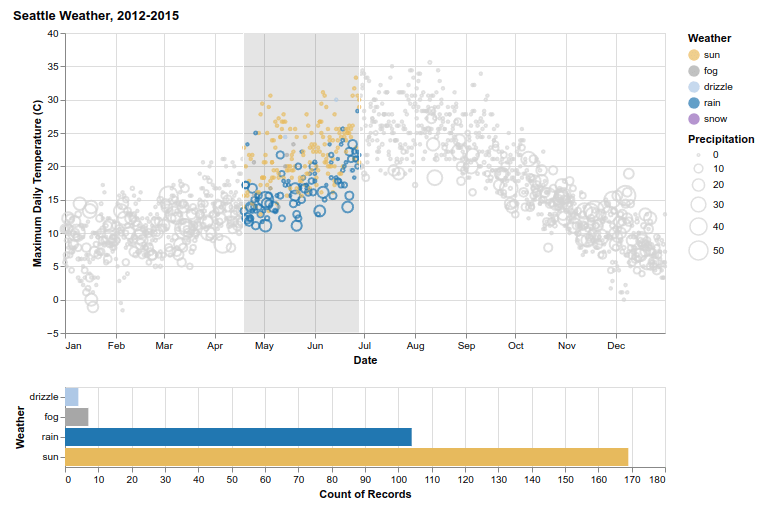
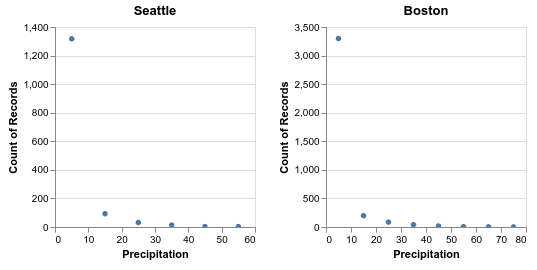
Brushing + Linking
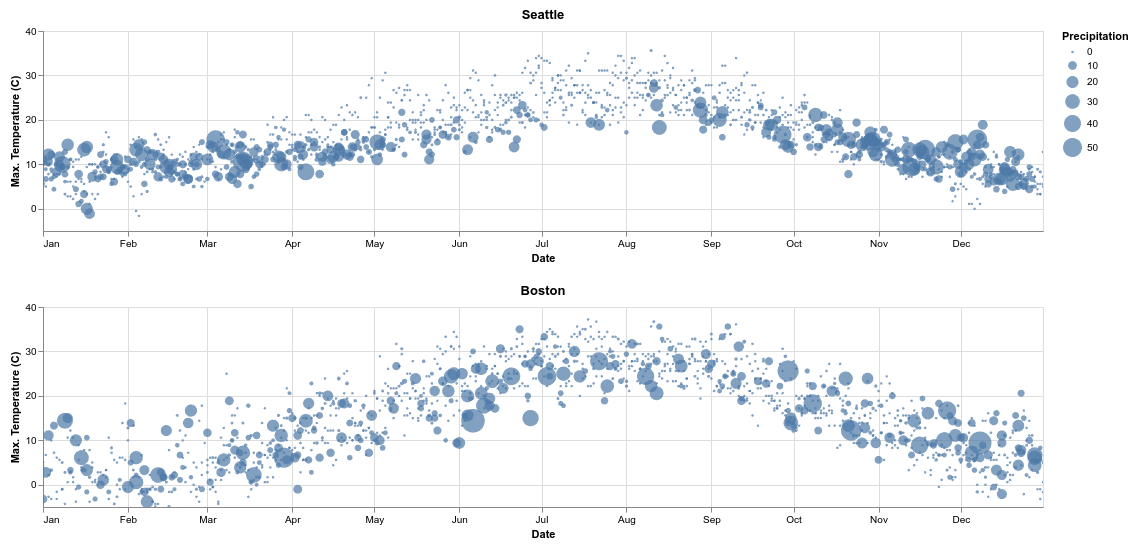
Zooming
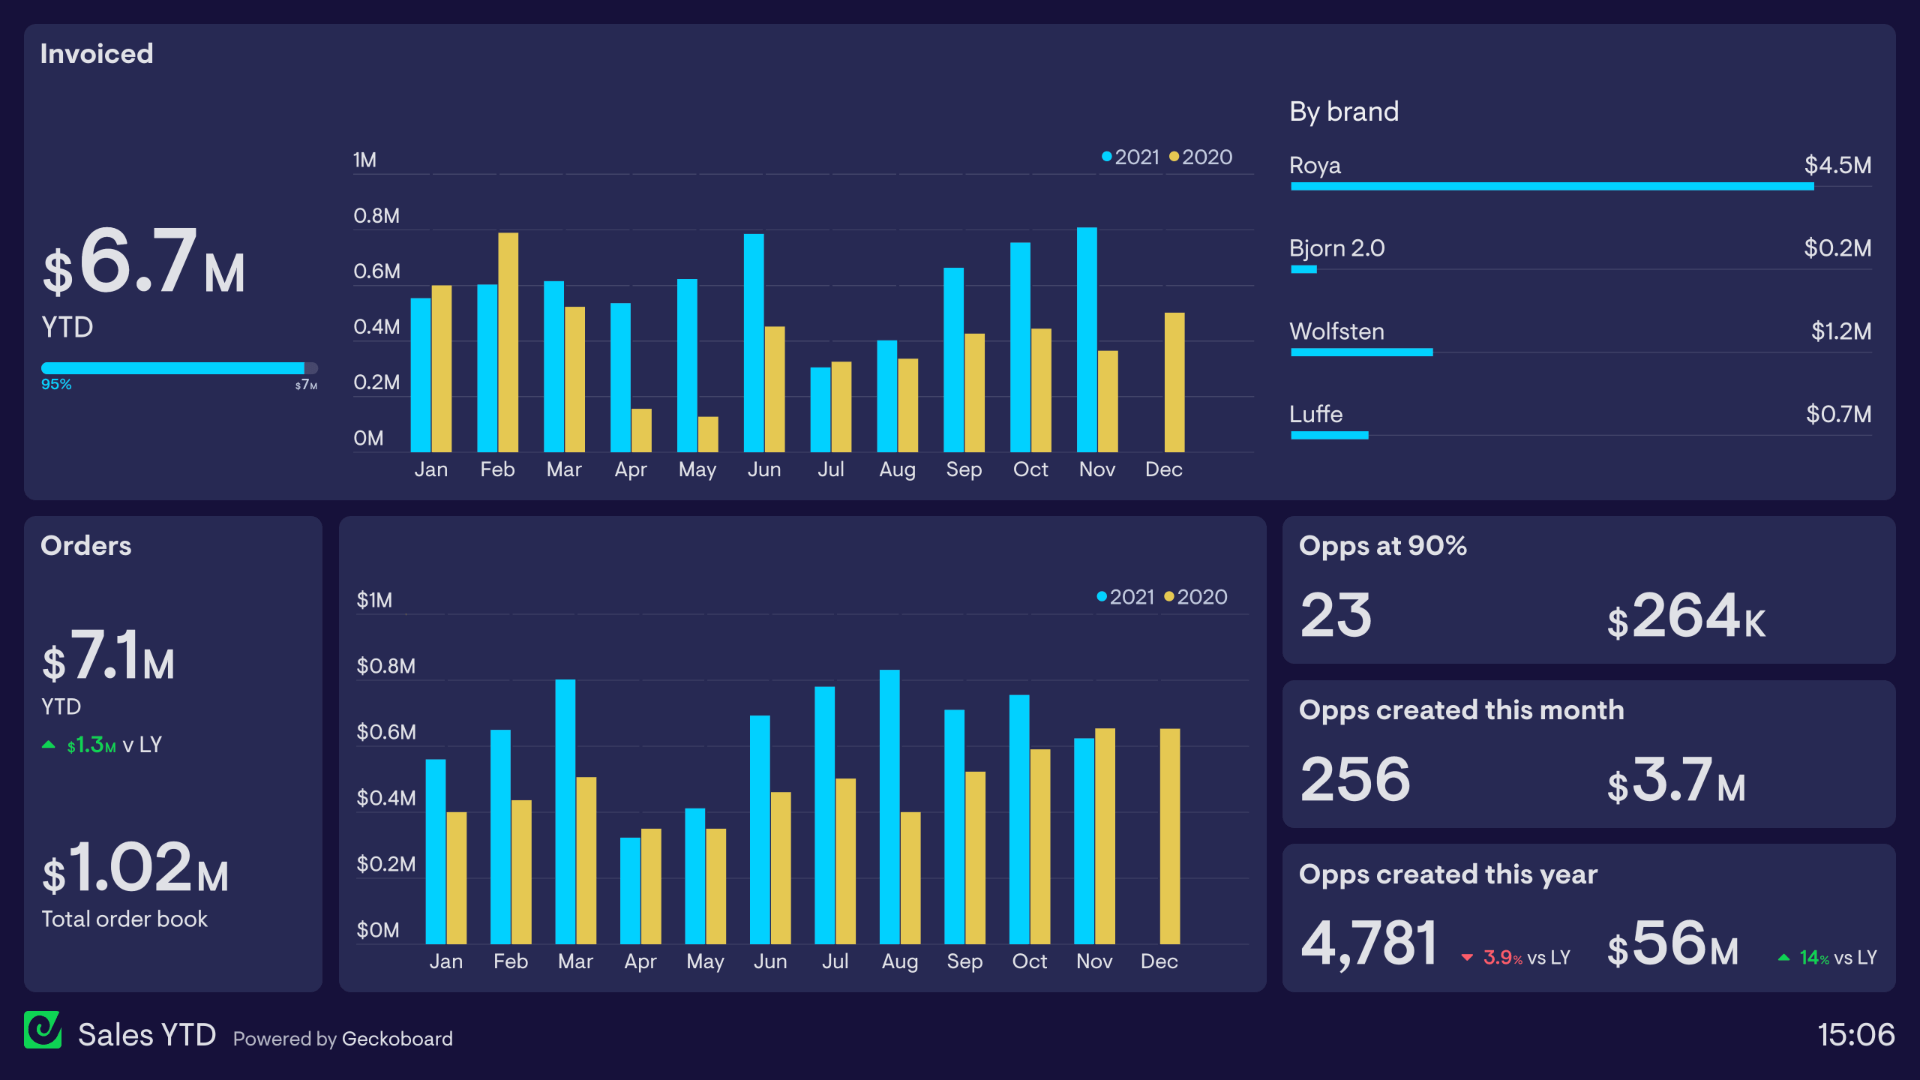
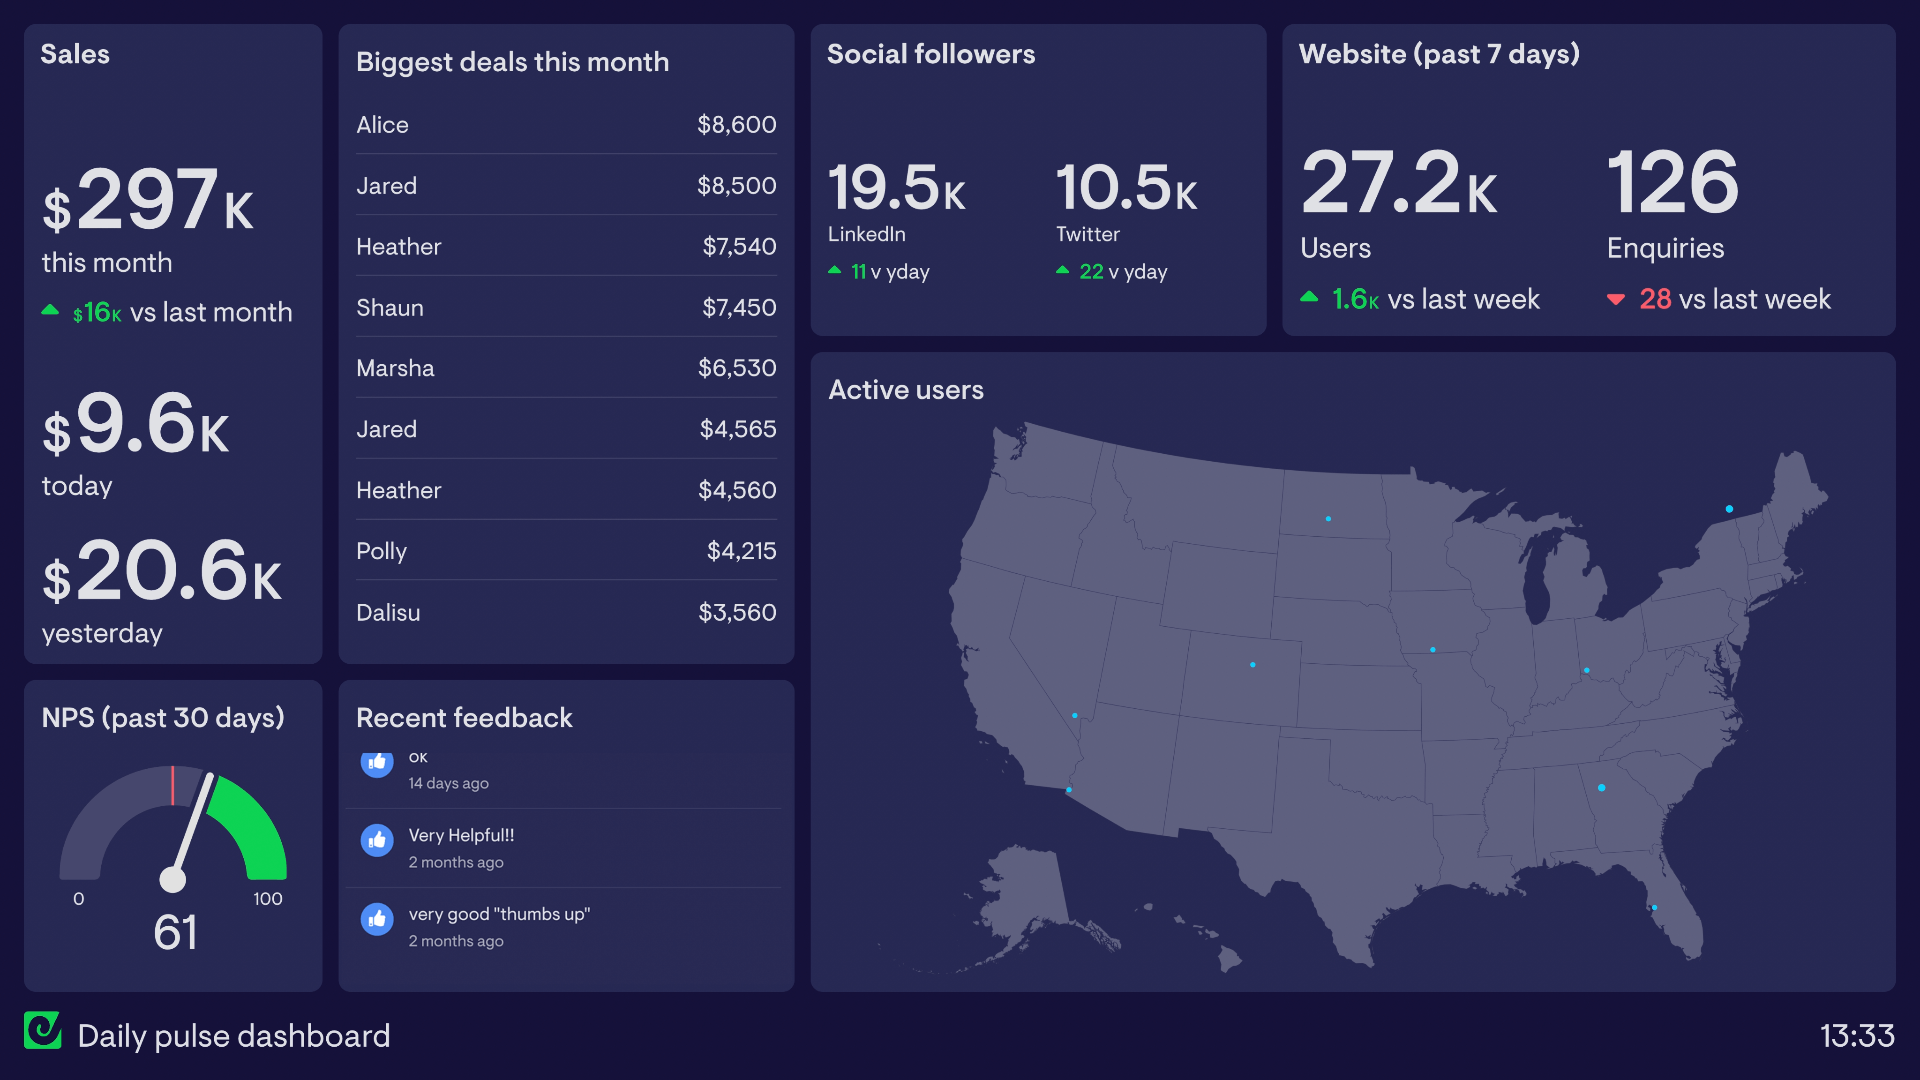
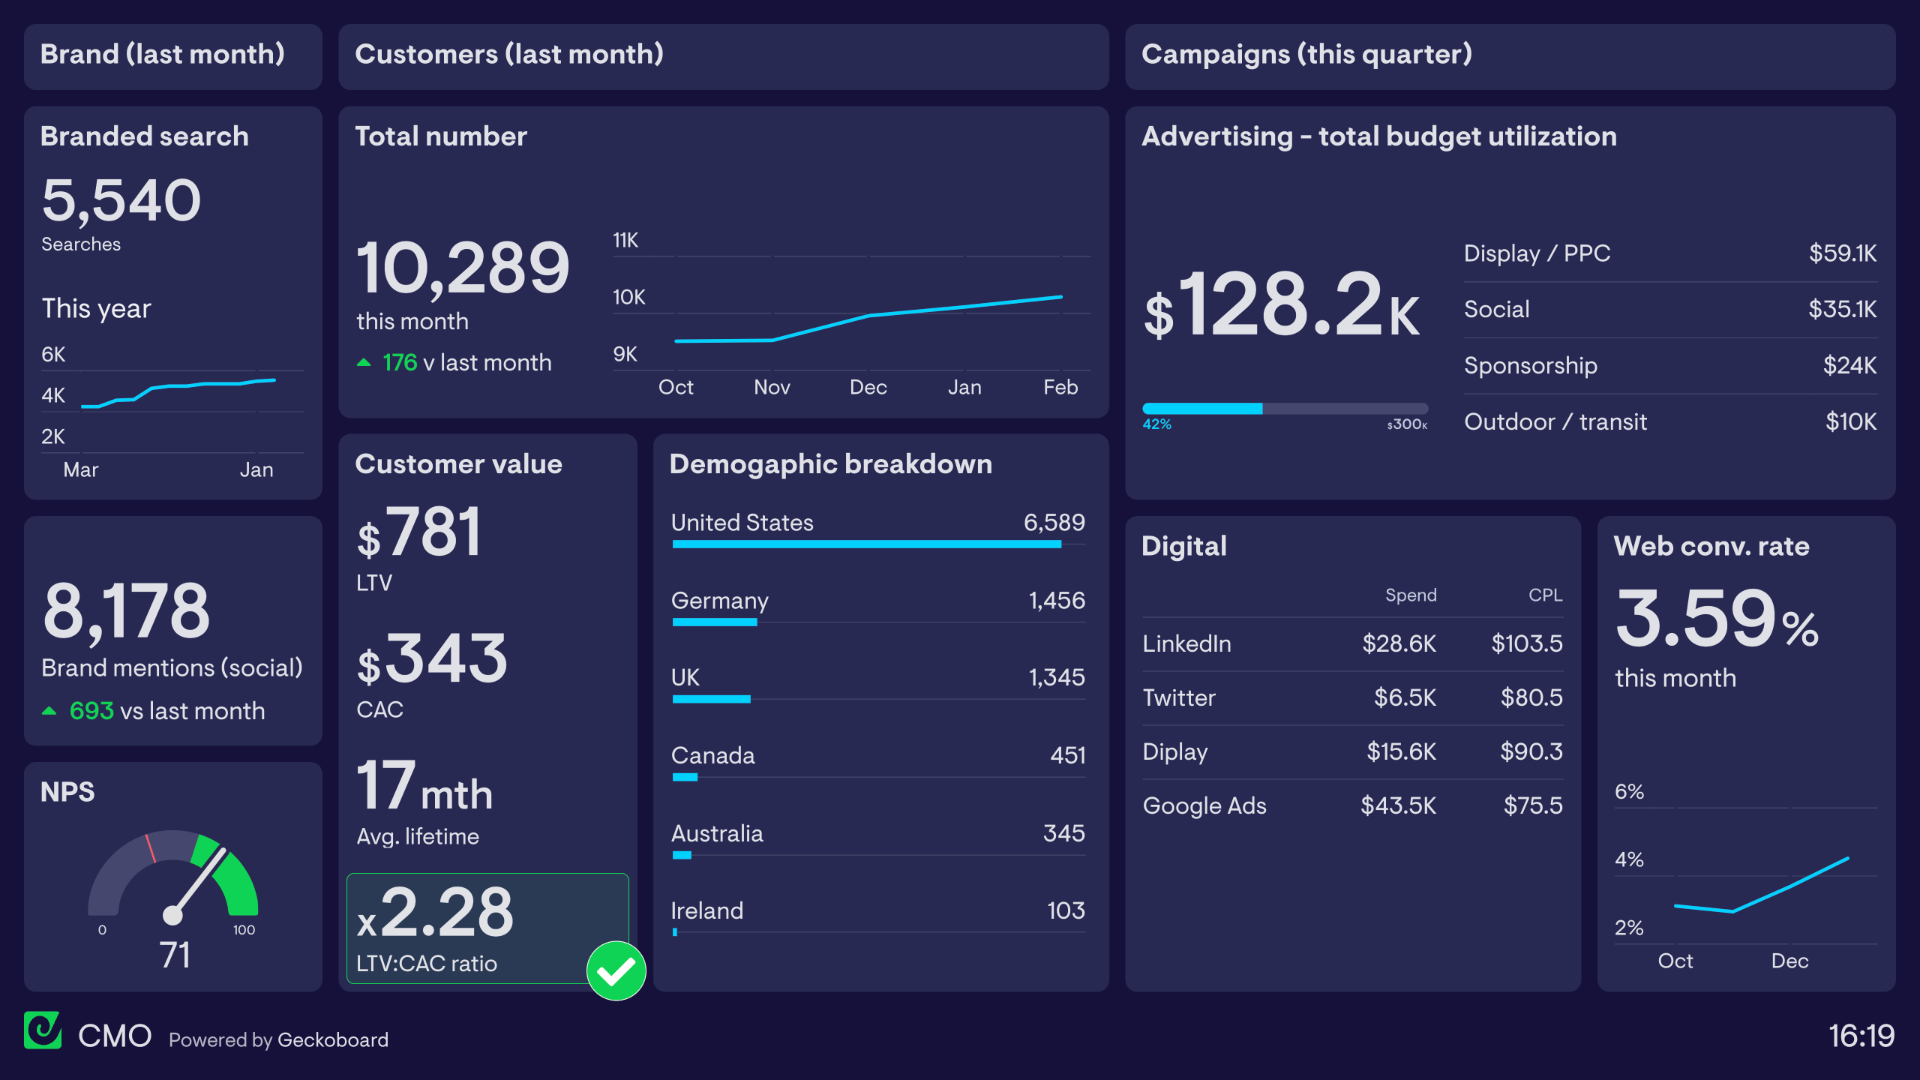
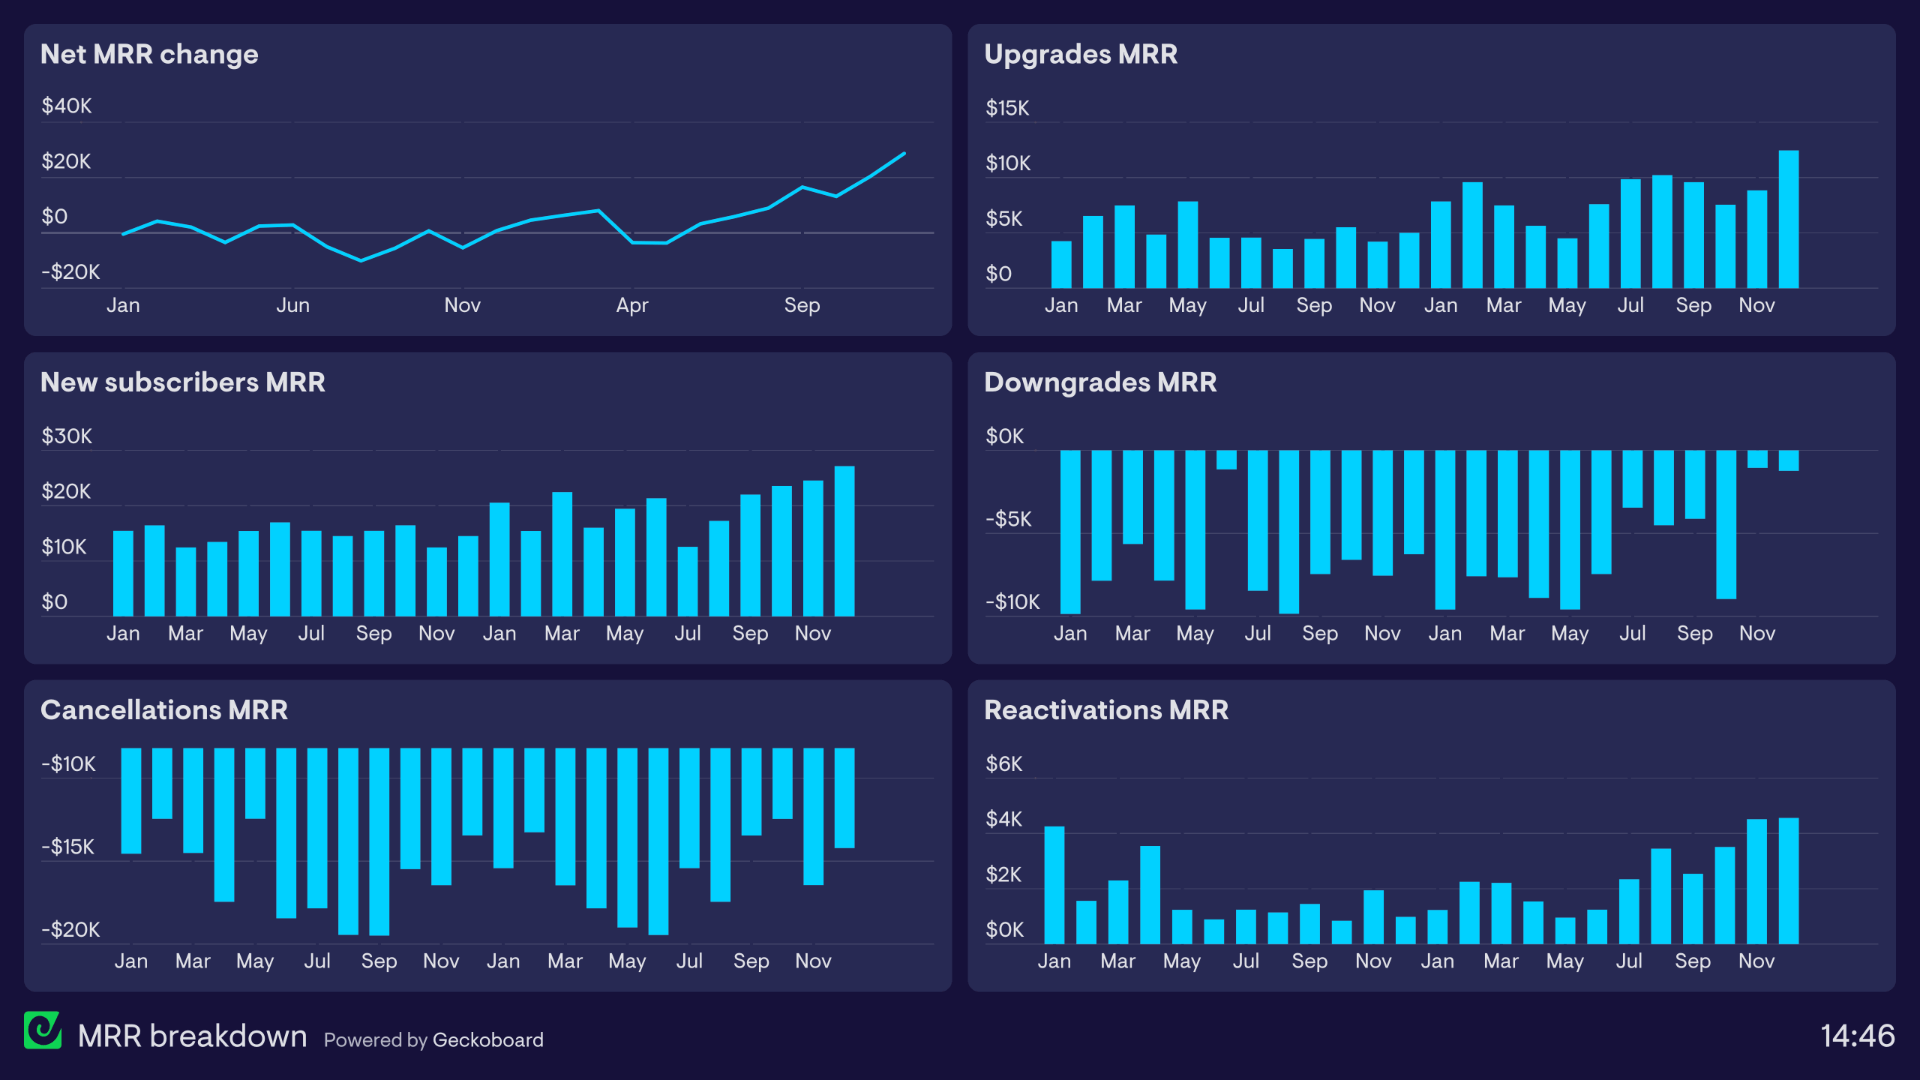
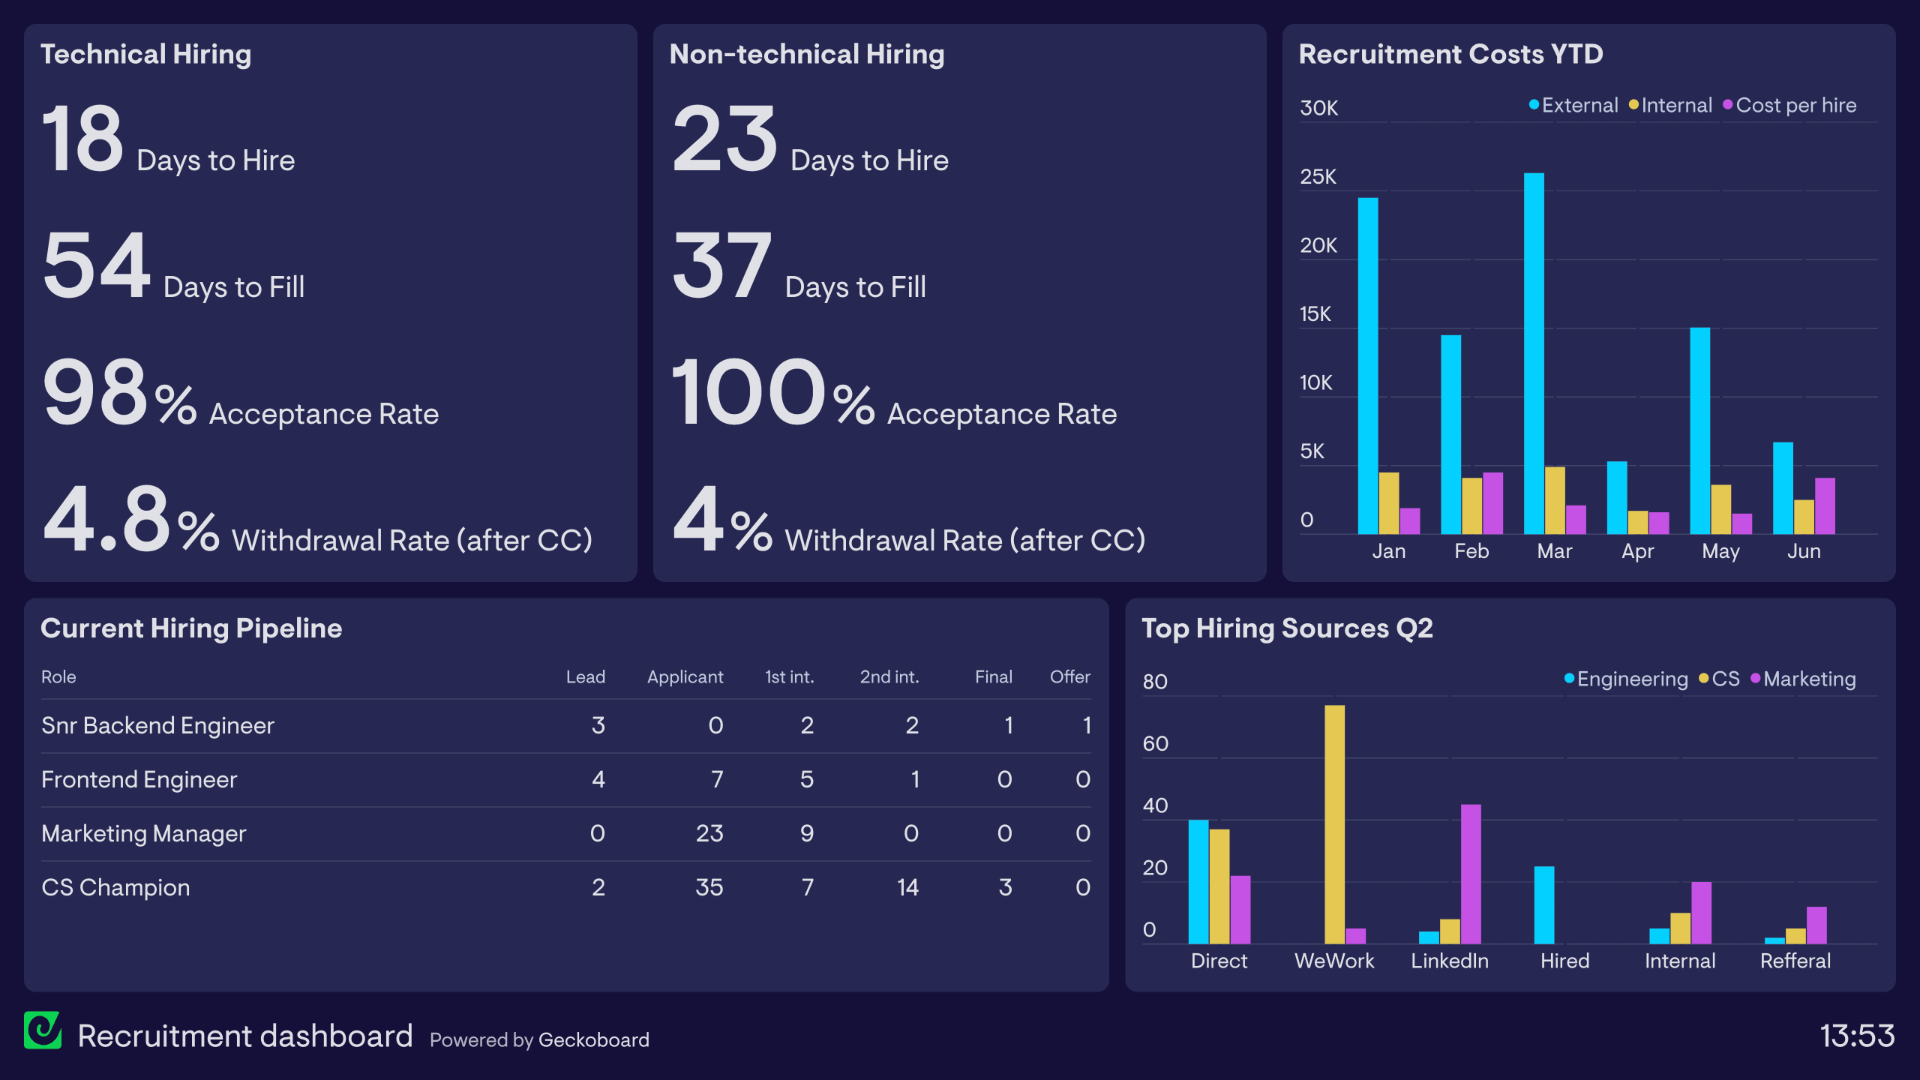
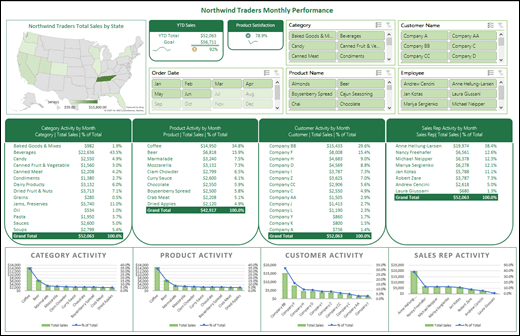
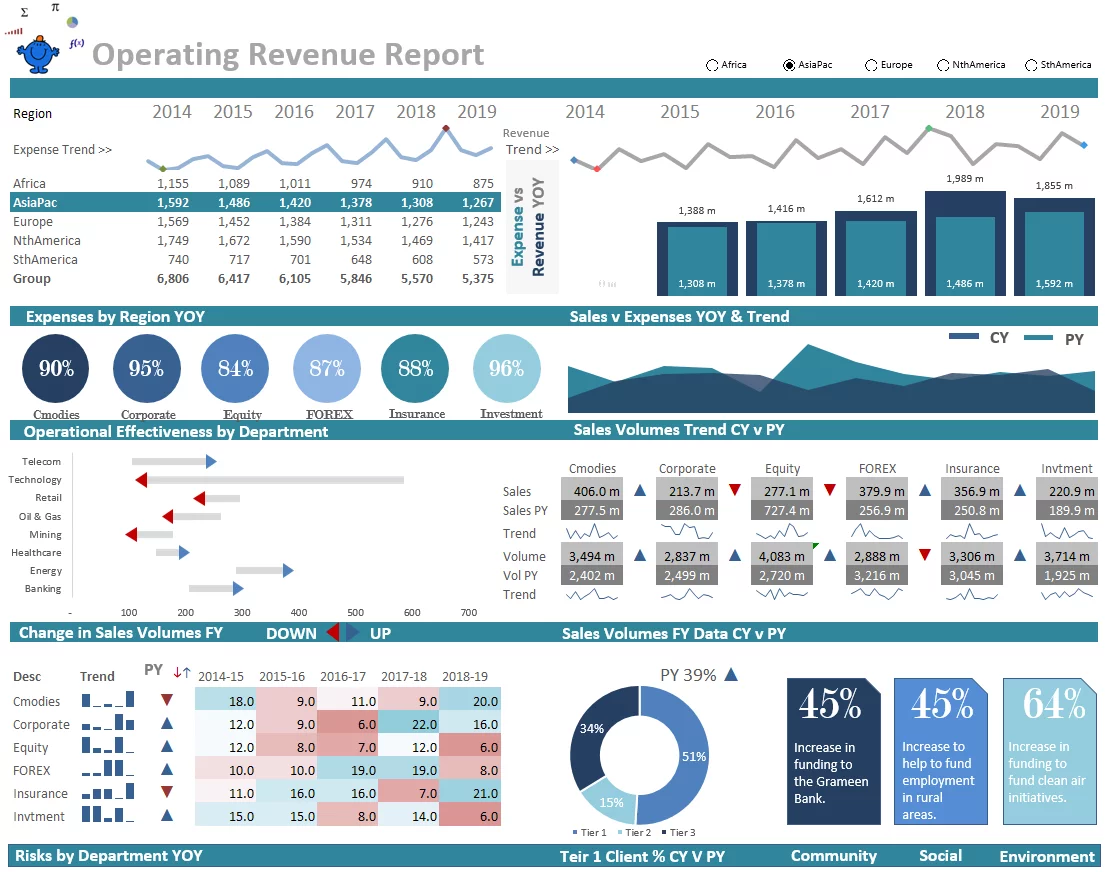
Dashboards!
KPI: Key-Performance-Indicators
<html>
<head>
<script src="https://cdn.jsdelivr.net/npm/vega@latest"></script>
<script src="https://cdn.jsdelivr.net/npm/vega-lite@latest"></script>
<script src="https://cdn.jsdelivr.net/npm/vega-embed@latest"></script>
</head>
<body>
<div id="vis"></div>
<script>
chart1 = {
"params": [{
"name": "zoom",
"select": "interval",
"bind": "scales"
}],
"vconcat": [
{
"width": 1000,
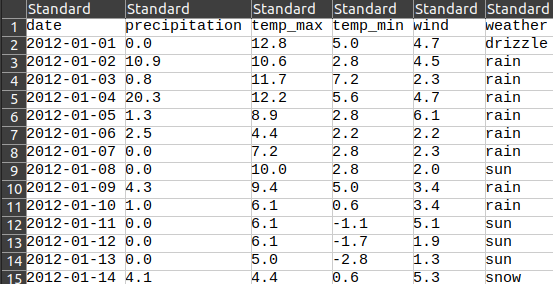
"data": {"url": "https://vega.github.io/vega-lite/data/seattle-weather.csv"},
"mark": "circle",
"title": "Seattle",
"encoding": {
"x": {
"field": "date",
"timeUnit": "monthdate",
"title":"Date",
"axis": {"format": "%b"}
},
"y": {
"field": "temp_max",
"scale": {"domain": [-5, 40]},
"type": "quantitative",
"title": "Max. Temperature (C)"},
"size": {
"title": "Precipitation",
"field": "precipitation",
"scale": {"domain": [-1, 50]},
"type": "quantitative"
},
},
},
{
"width": 1000,
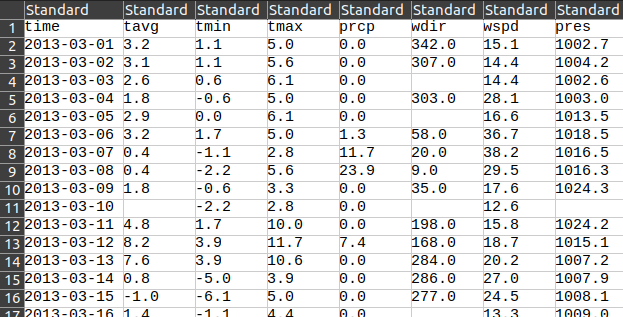
"data": {"url": "https://cs617.org/data/boston_weather.csv"},
"mark": "circle",
"transform": [{
"filter": {"field": "time",
"range": [ {"year": 2012, "month": 1, "date": 1},
{"year": 2016, "month": 12, "date": 31}]},
}],
"title": "Boston",
"encoding": {
"x": {
"field": "time",
"timeUnit": "monthdate",
"title":"Date",
"axis": {"format": "%b"}
},
"y": {
"field": "tmax",
"scale": {"domain": [-5, 40]},
"type": "quantitative",
"title": "Max. Temperature (C)"
},
"size": {
"title": "Precipitation",
"field": "prcp",
"scale": {"domain": [-1, 50]},
"type": "quantitative"
},
},
}
]
};
vegaEmbed("#vis", chart1, {actions: false});
</script>
</body>
</html>Homework
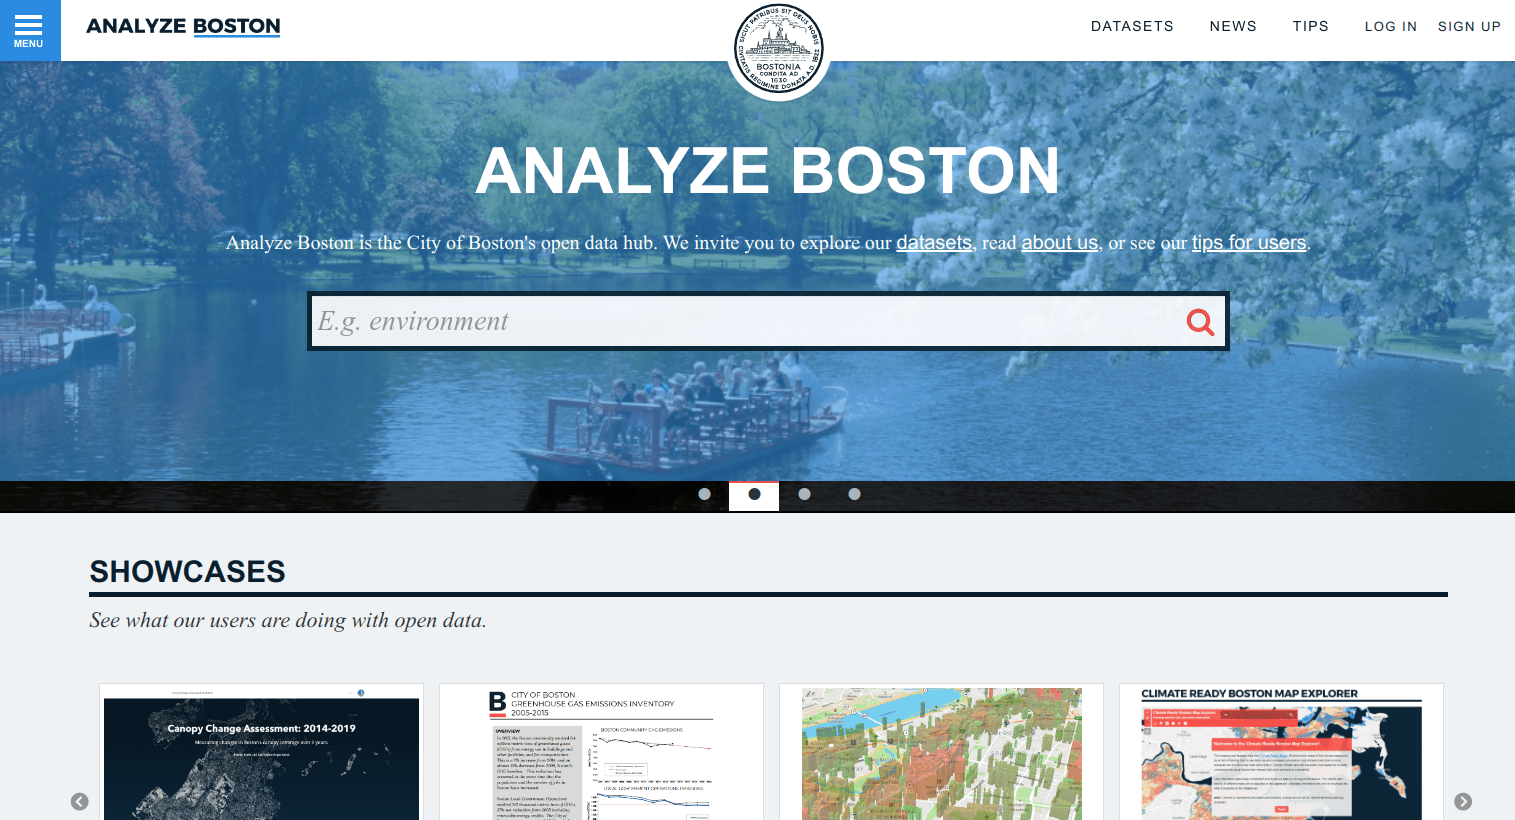
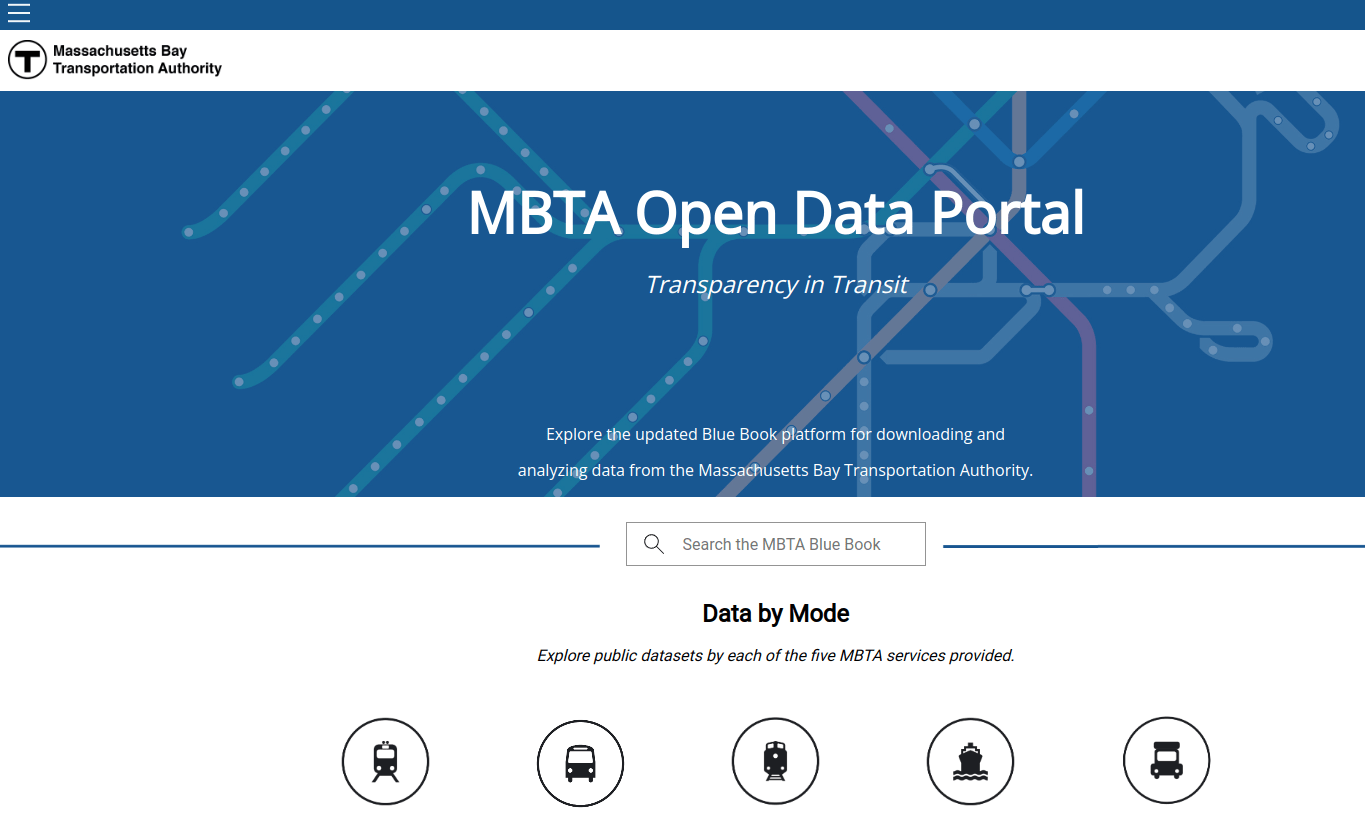
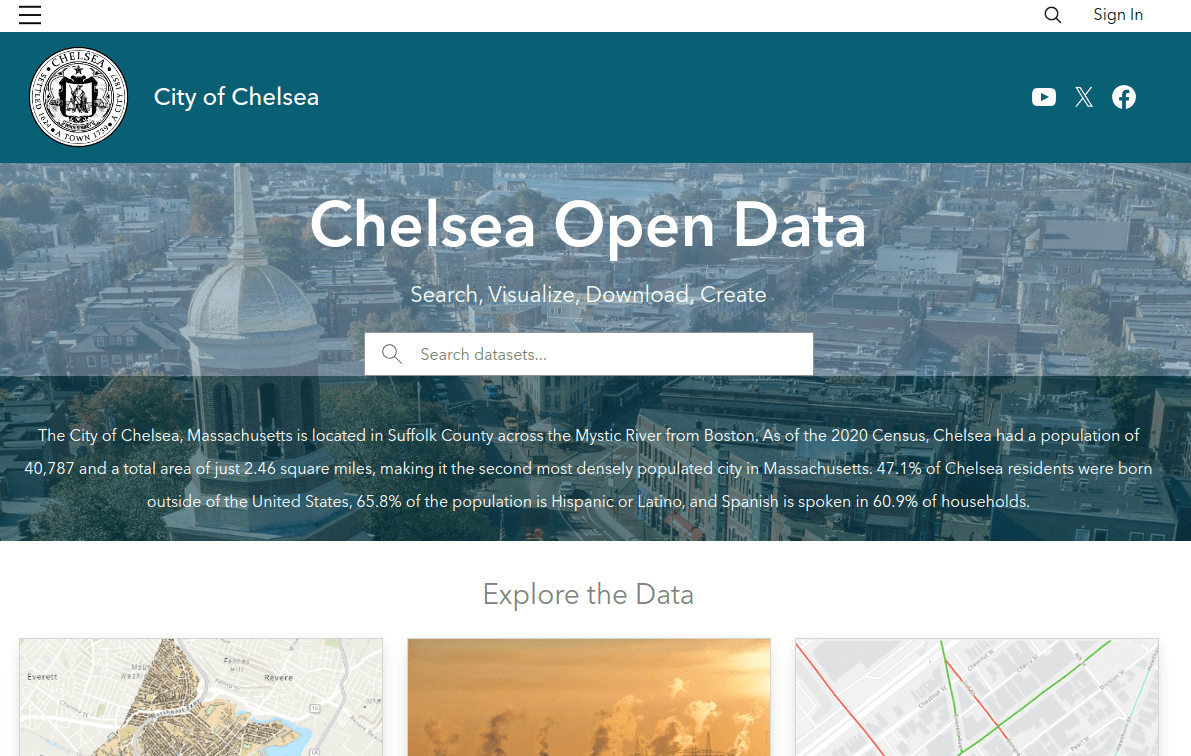
local / regional data
visualize
to tell a story!
Homework
Find examples of beautiful dashboards!
By Daniel Haehn
Slides for CS617 VISUALIZING.BOSTON - See https://cs617.orghttps://cs617.org


