Debugging
with
Visual studio code/ Git pod
What is visual studio code
a lightweight but powerful source code editor
- Availability for Windows, macOS and Linux
- built-in support for multiple programming languages
- a rich ecosystem of extensions
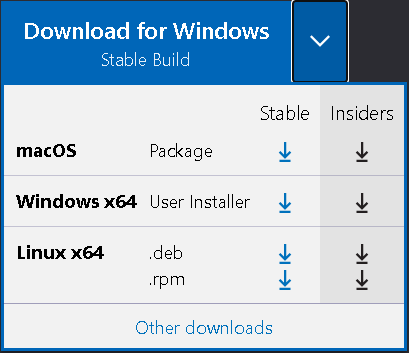
Step 1: Install vsc
Choose the suitable platform and download the stable version via:
Step 2: Install python extension
Download the python extension for visual studio code via the Link, it supports:
- IntelliSense
- Debugging
- Code formatting
- Jupyter notebook support
- and More
Step 3: Install python interpreter
Windows
Download via the link and install it, remember to configure the system path
macOS
Install brew and run the command
brew install python3
at the terminal prompt
Linux
Linux's built-in python packages work well
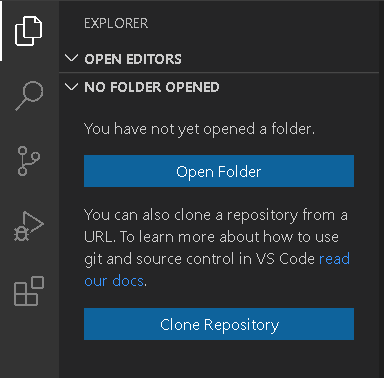
Step 3: Create the hello word
On the explorer panel, click the "Open Folder" button to choose the desired the directory to put your file
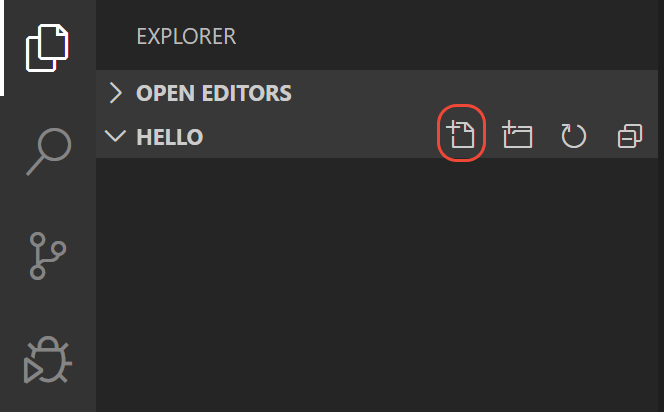
Step 3: Create the hello word
Click the "New File" button and create a new file named "hello.py", and edit its code as follow
msg = "Hello World"
print(msg)
Step 3: Create the hello word
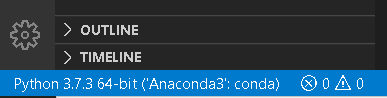
Configure the interpreter in the lower-left corner
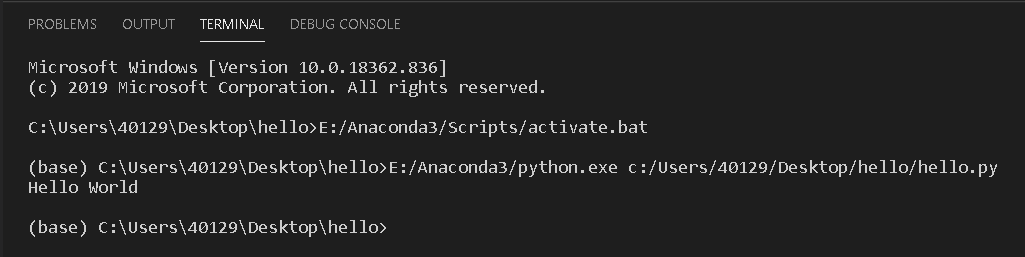
Step 4: Run hello world
Result printed in the command prompt
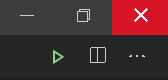
Click the green triangle in the upper right corner
Step 4: Run hello world
other ways to run
- Selected the lines to run and press "CTRL+ENTER"
- right-click in the editor window and choose run file in the terminal
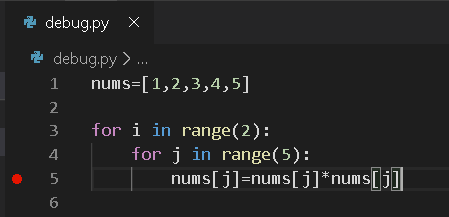
Step 5: Set a break point
You could set a break point on line 2 of hello.py by
- placing the cursor on the print call and pressing F9
- just click in the editor's left gutter, next to the line numbers.
What is a break point
Break point is an intentional stopping place in a program. It allows you to examine the state of the running program at the break point such as the variables' value
Step 6: Initialize the debugger
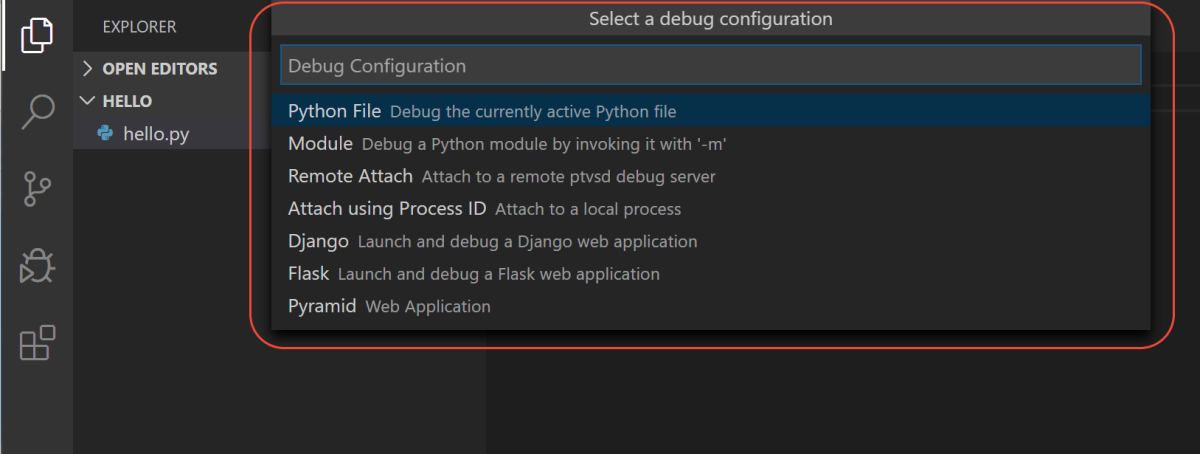
Press F5 to call the configuration menu and
choose the "Python file as the file type".
Step 7: Debugging
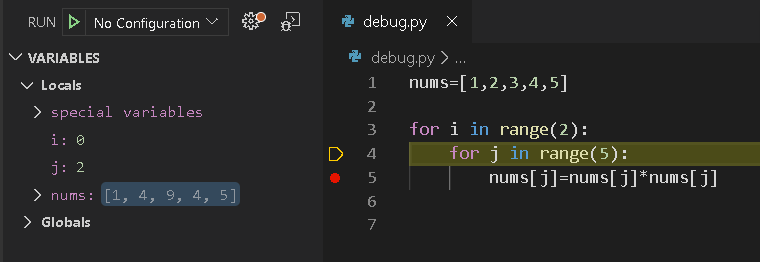
The program will start at the first breakpoint, you could see the information of the variables in the left column
Step 7: Debugging
A debug toolbar appears along the top with the following commands from left to right:
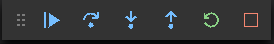
- continue (F5)
- step over (F10)
- step into (F11)
- step out (Shift+F11)
- restart (Ctrl+Shift+F5)
- stop (Shift+F5)
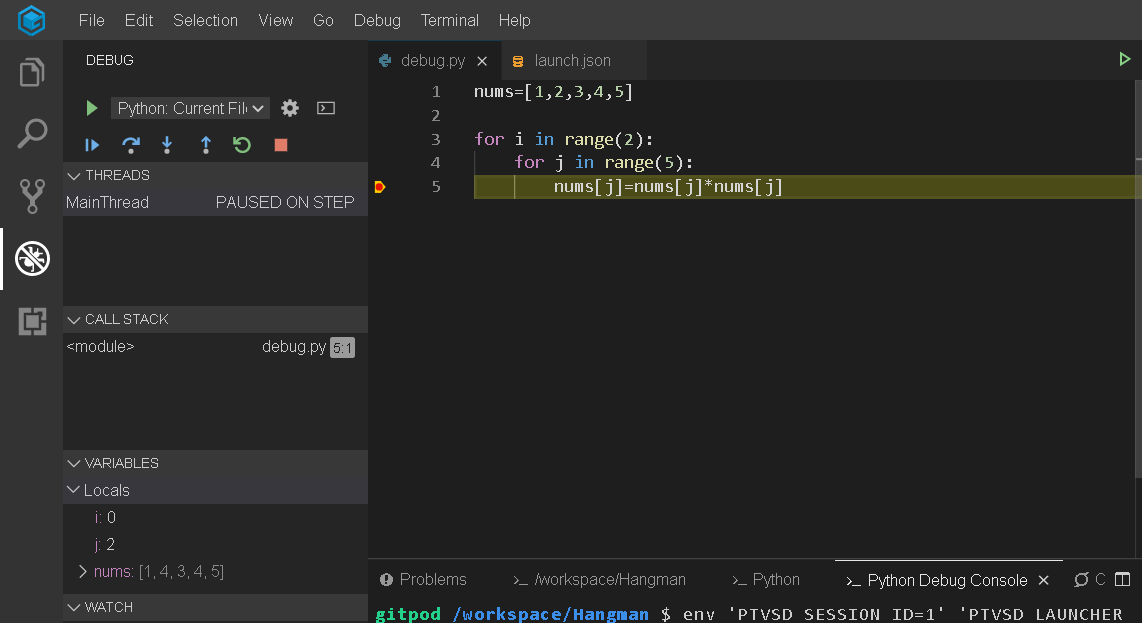
What is gitpod
Gitpod is a ready-to-Code Development Environments for GitHub and GitLab
- automated dev environments
- Seamless GitHub & GitLab Integration
- Based on the Online IDE Theia

Create your own program
You could log on to gitpot with your own github or gitlab account, it may take some time for gitpot to prepare the environment for you
Debugging configuration
{
    "version": "0.2.0",
    "configurations": [
        {
            "name": "Python: Current File",
            "type": "python",
            "request": "launch",
            "program": "${file}",
            "console": "internalConsole"
        }
    ]
}
Debugging
Debugging with
By Huang Patrick
