Visualization for Explainable AI
May 6th

Dennis Collaris
PhD Visualization

75% risk!
Black box
model

Domain expert
But why?

Data
Machine learning


DECISION SUPPORT
Trending issue


Husky vs. Wolf problem
DIAGNOSTICS
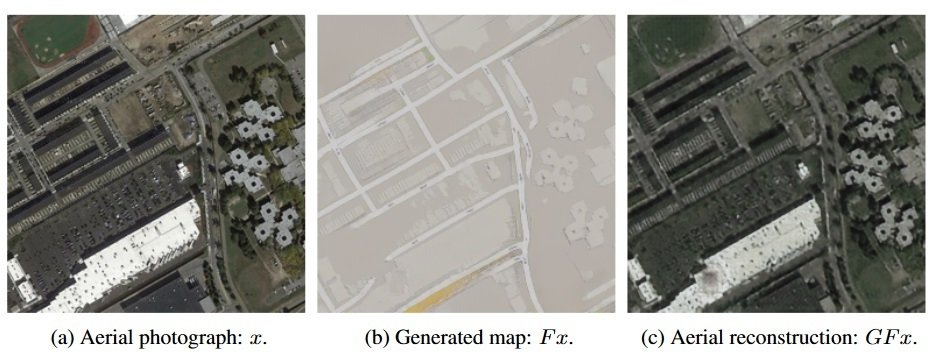
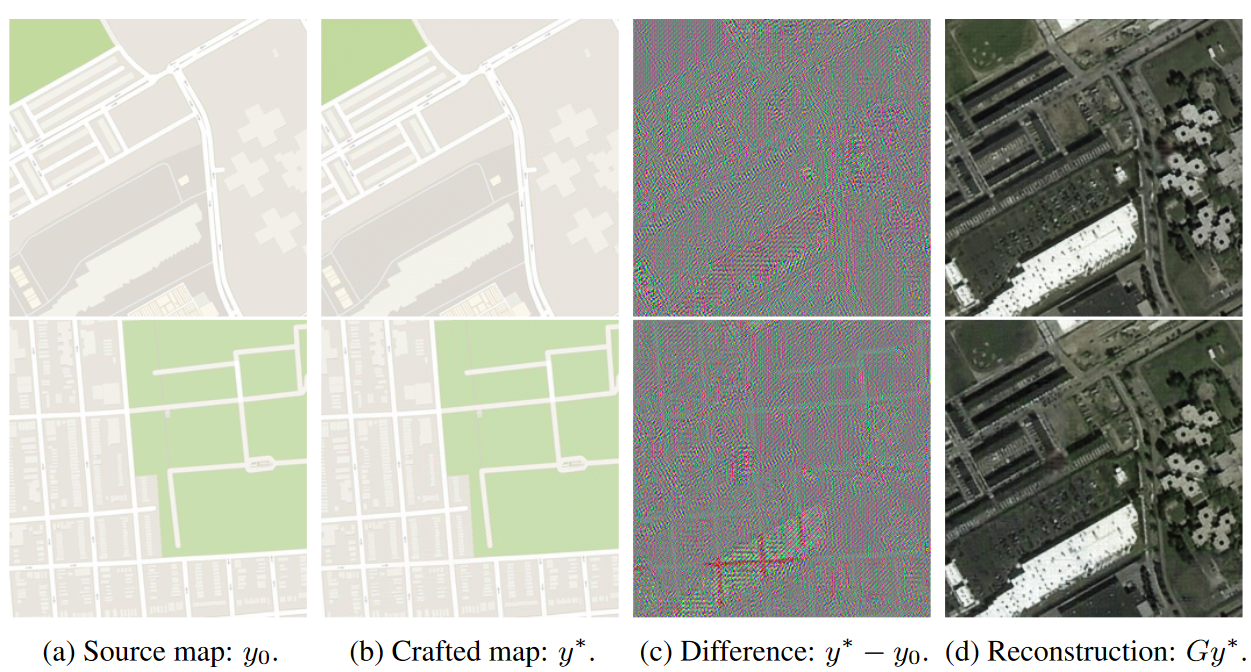
CycleGAN
DIAGNOSTICS
75% risk!
Black box
model
Domain expert
Explanation

Aha!
But why?
Data

Explainer
Machine learning
Global
Instance-level
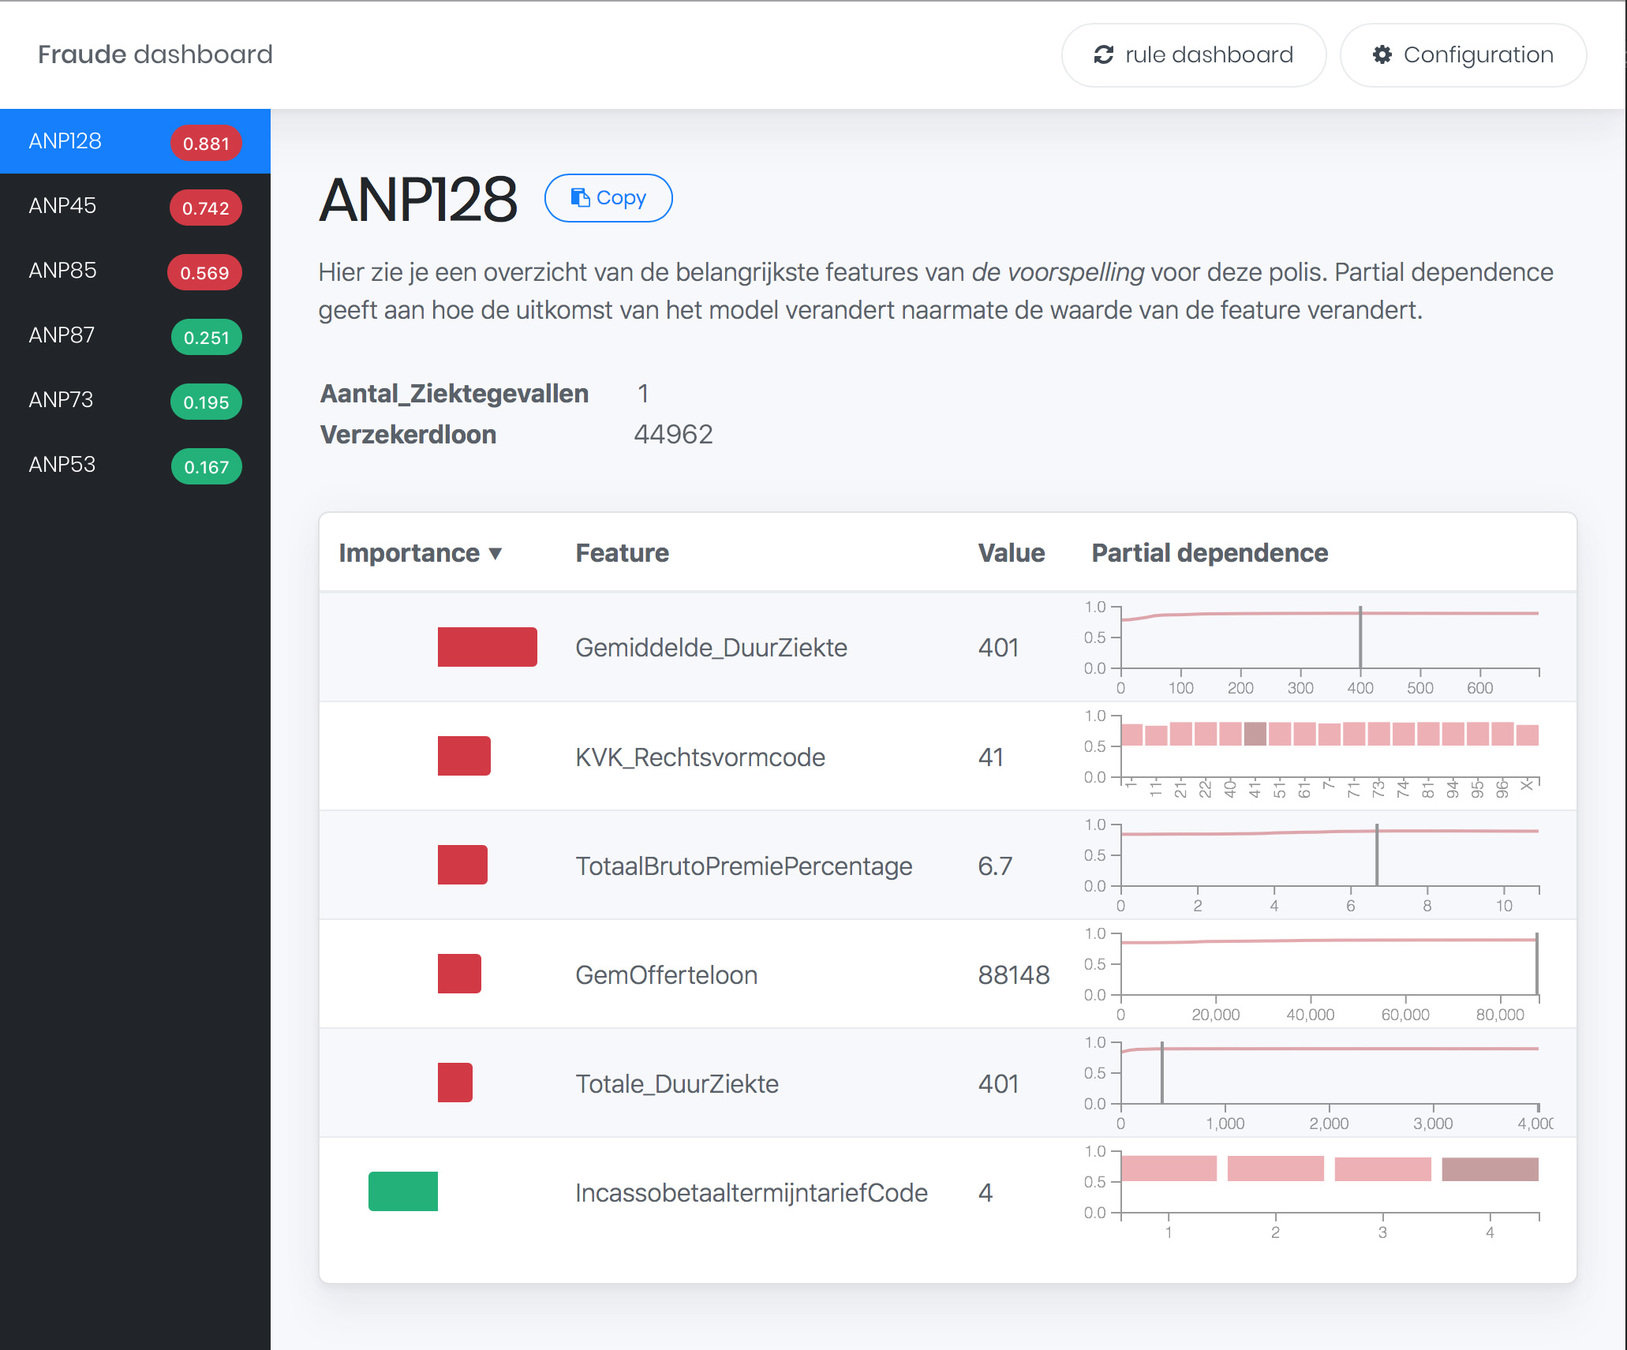
Fraud Dashboard

Overview
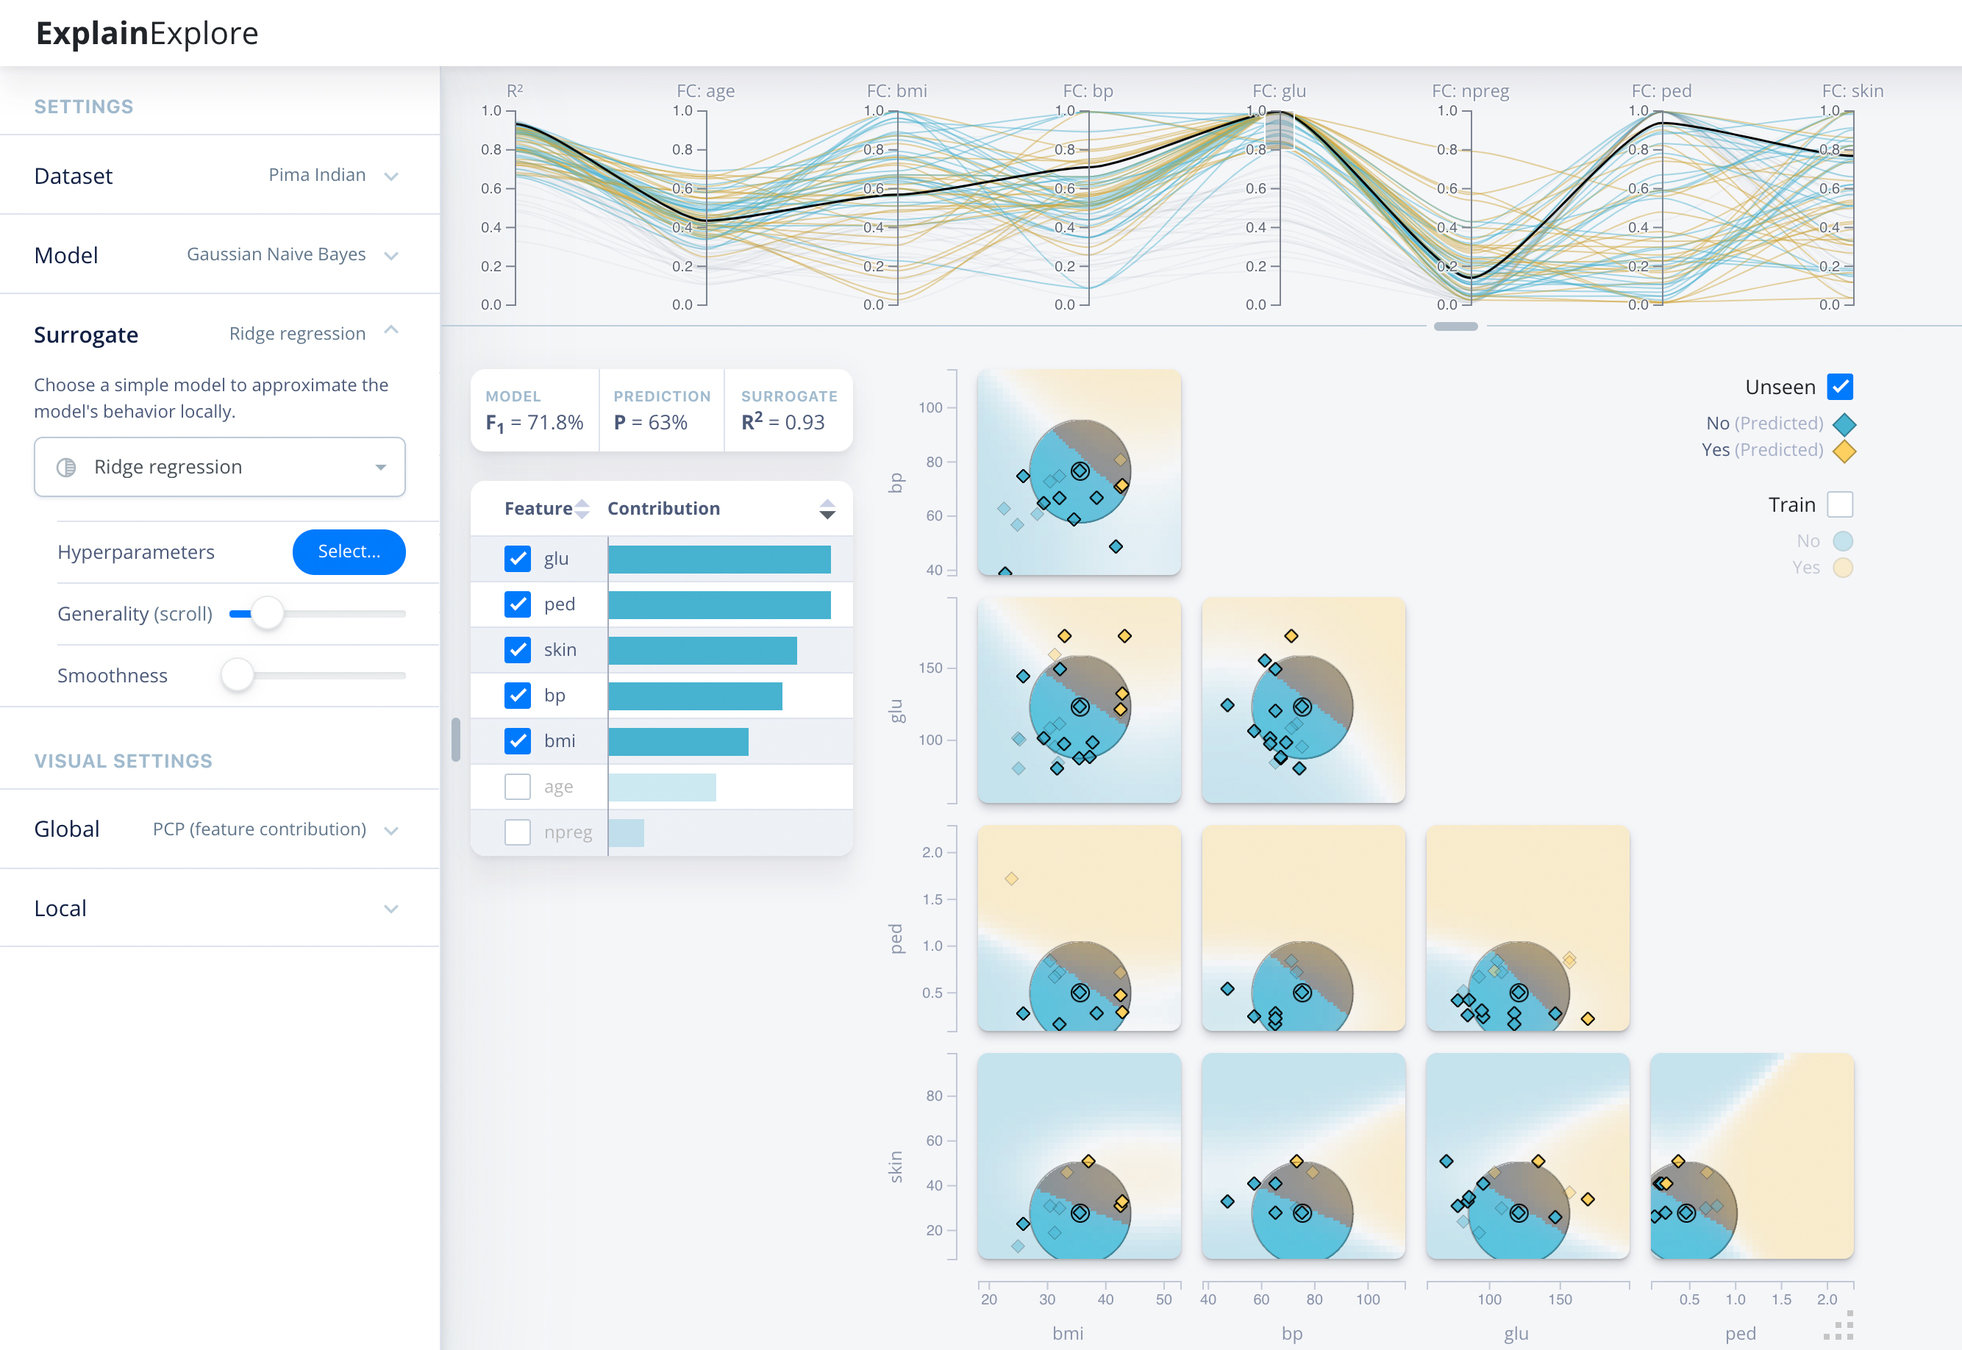
ExplainExplore
Global
Instance-level
Fraud Dashboard
Overview
ExplainExplore
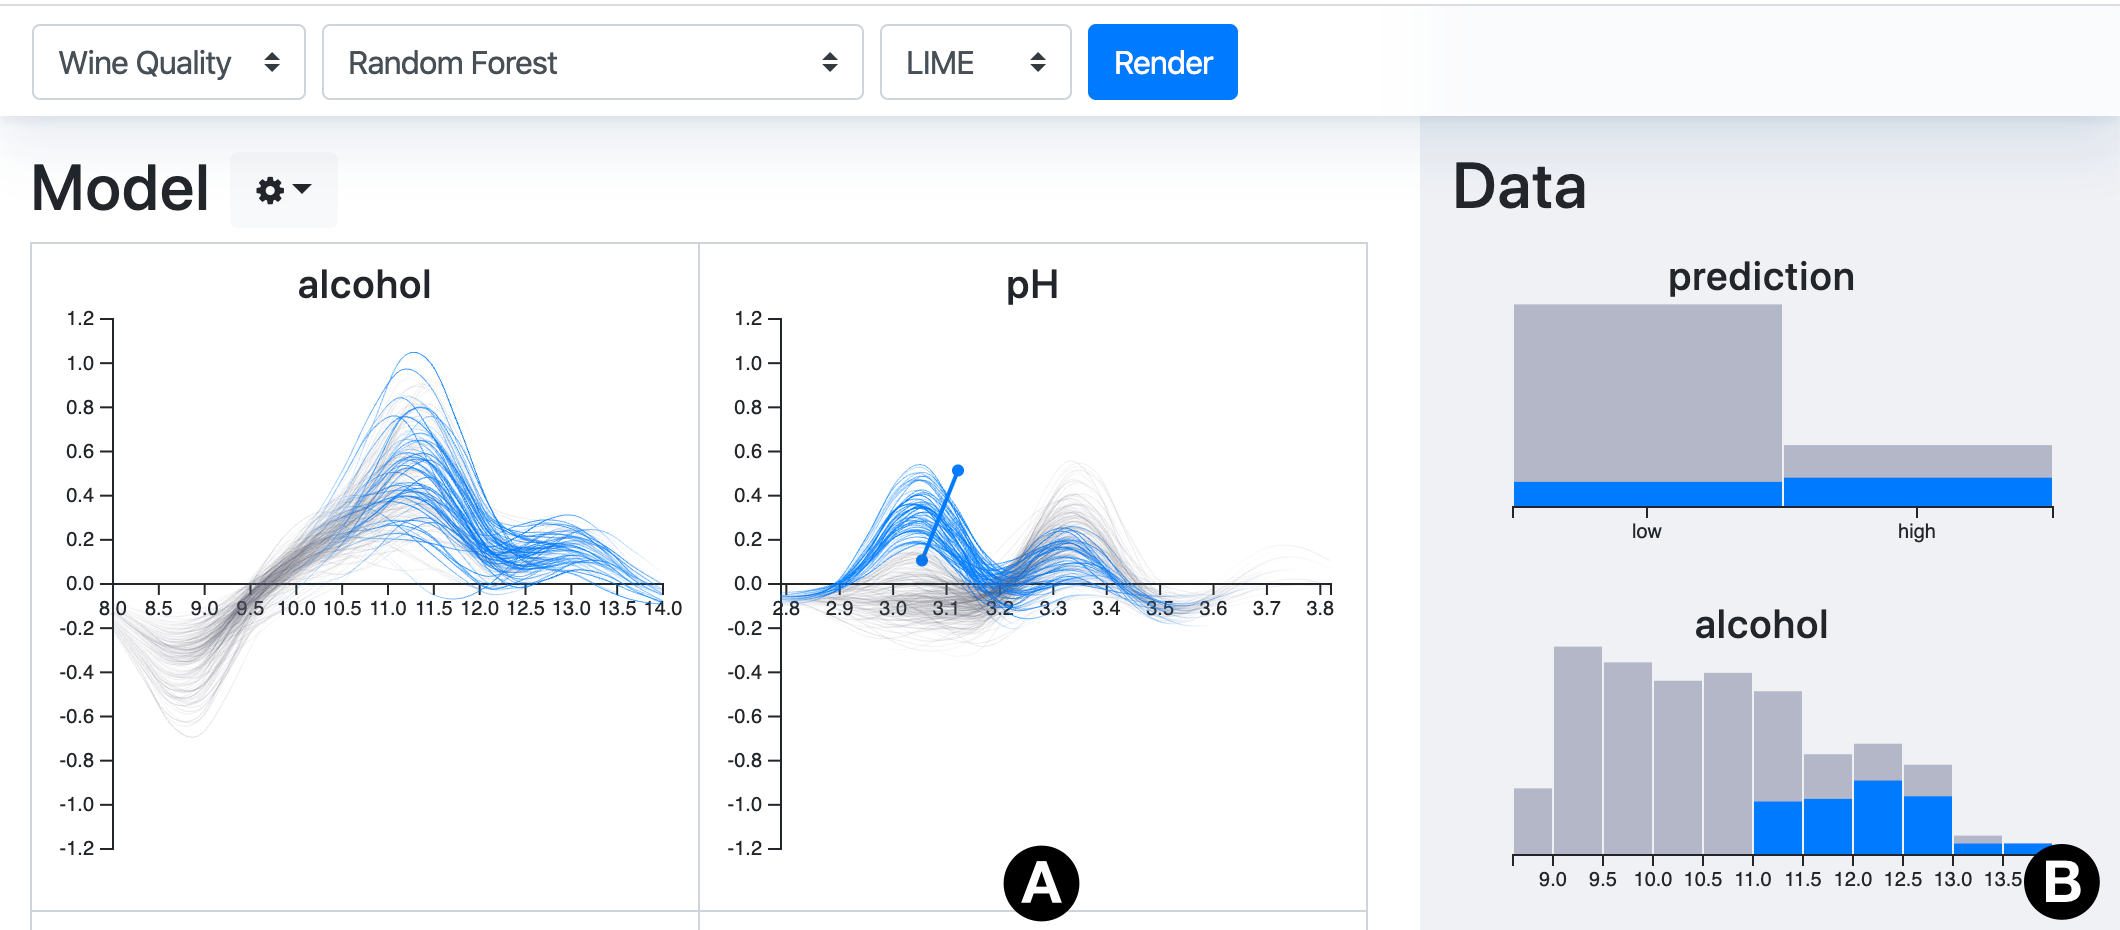
Contribution-Value Plots
Global
Instance-level
Fraud Dashboard
Overview
ExplainExplore
CV Plots
Global
Instance-level
Fraud Dashboard
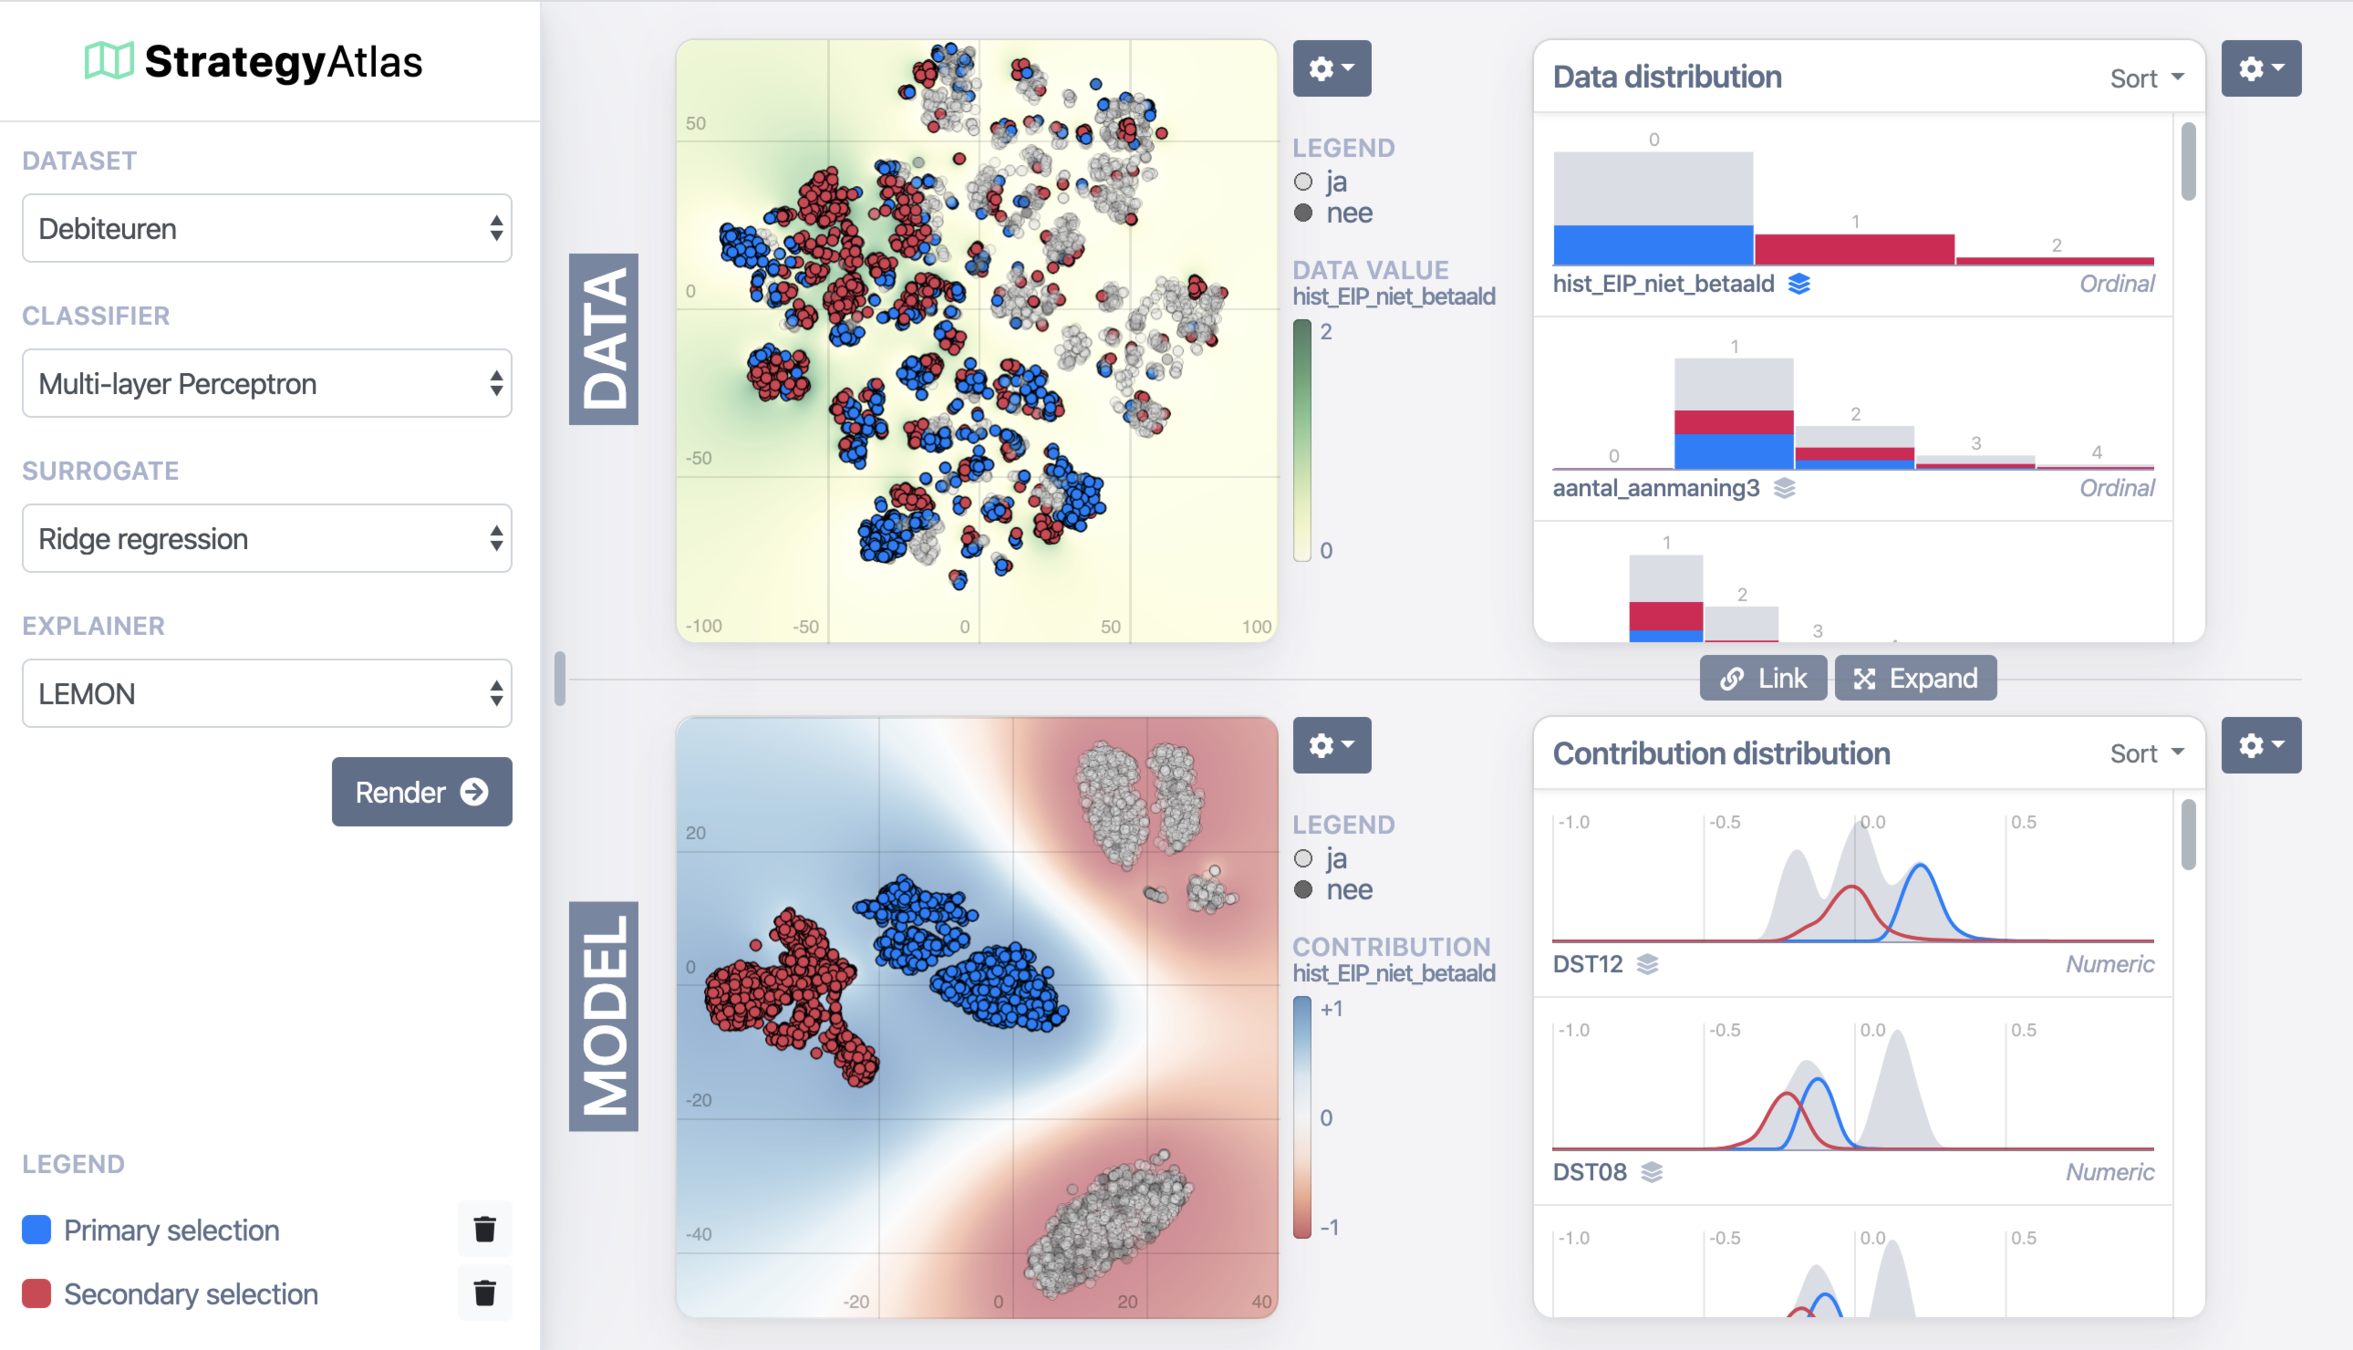
StrategyAtlas
Overview

Fraud detection explanations
sick-leave insurances
FRAUD DETECTION EXPLANATIONS
Data
- Missing/incorrect values
Model
- 100 Random Forest
- 500 trees each
- ~25 decisions per tree
- 1.312.471 decisions total!
×
OOB error: 27.7%
Real world scenario
FRAUD DETECTION EXPLANATIONS


My solution
FRAUD DETECTION EXPLANATIONS
[1] Palczewska, Anna et. al. Interpreting random forest classification models using a feature contribution method. In Integration of reusable systems, pp. 193–218. Springer, 2014.
0 1 2 3 x
y
2
1
7 : 7
6 : 2
...
\(Y_{mean}\) = 0.5
\(Y_{mean}\) = 0.75
\(LI_{X}\) = 0.25
Contribution per Decision Tree:
\(FC_{i,t}^f = \sum_{N \in R_{i,t}} LI_f^N\)
Contribution per Random Forest:
\(FC_i^f = \frac{1}{T}\sum_{t=1}^T FC_{i,t}^f\)
X < 2.5
Feature contribution
FRAUD DETECTION EXPLANATIONS
[2] Friedman, Jerome H. Greedy function approximation: A gradient boosting machine. Annals of Statistics, 29(5): pp. 1189–1232, 2001.
300
250
200
150
100
50
1
0%
100%
200
100
0
Duration illness
Fraud?
Fraud (55%)
Non-fraud (35%)
| Company | ABC Inc |
| Employees | 5 |
| Duration illness | days |
| ... | ... |
Fraud (65%)
Fraud (90%)
Non-fraud (45%)
Non-fraud (40%)
Non-fraud (25%)
Partial dependence
FRAUD DETECTION EXPLANATIONS
[3] Ribeiro, Marco Tulio et. al. Why should i trust you?: Explaining the predictions of any classifier. In
Proceedings of the 22nd ACM SIGKDD, pp. 1135–1144. ACM, 2016.
[4] Deng, Houtao. Interpreting tree ensembles with inTrees. arXiv preprint arXiv:1408.5456 , pp. 1–18, 2014.
0 1 2 3 x
y
2
1


Local rule extraction
FRAUD DETECTION EXPLANATIONS
Any project using a Random Forest in R!
- Given a workshop for data science teams
- Code for dashboard available at team Leon
Applications
FRAUD DETECTION EXPLANATIONS
Fraud team happy! 🎉
FRAUD DETECTION EXPLANATIONS

Paper presented at:
Workshop on Human Interpretability in Machine Learning
Stockholm, Sweden
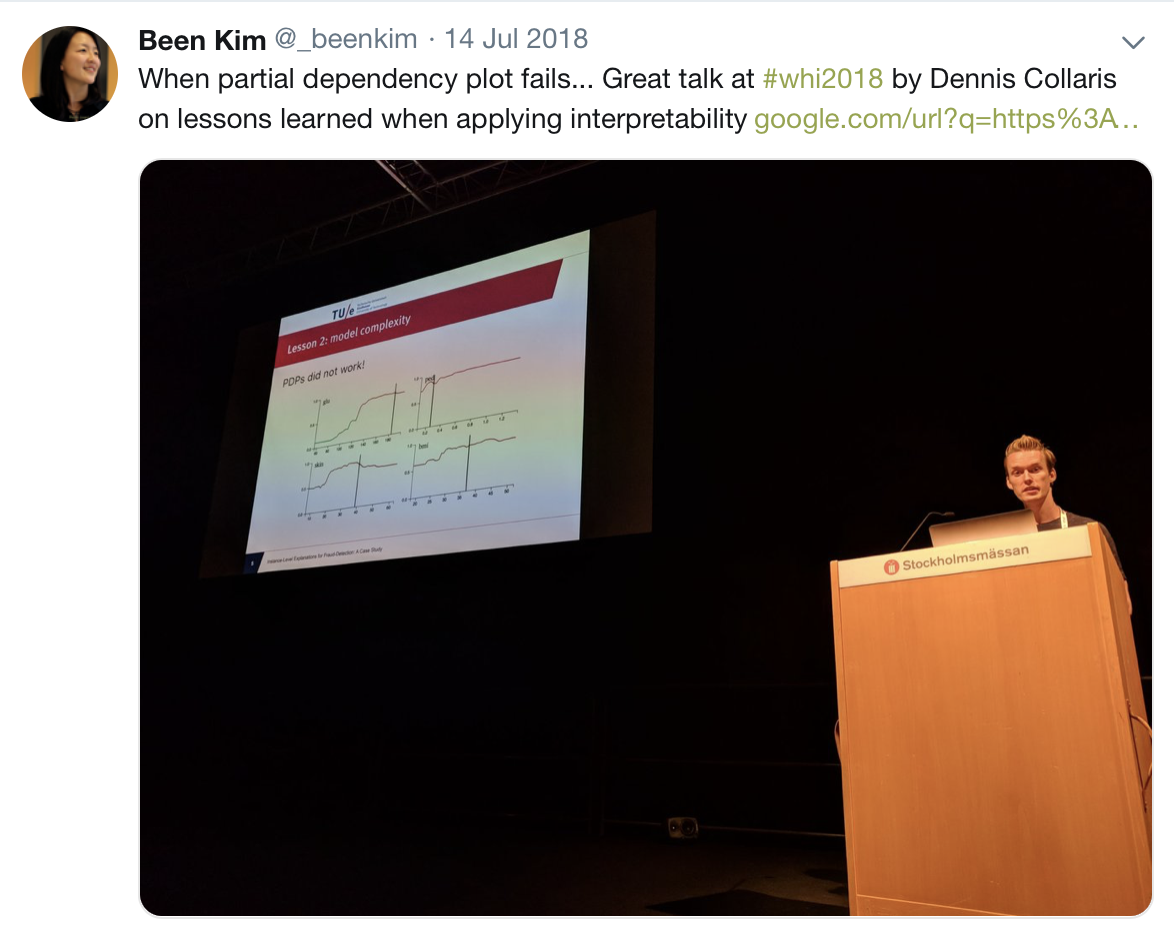
FRAUD DETECTION EXPLANATIONS
Applicable to any machine learning model
EXPLAINER TECHNIQUES
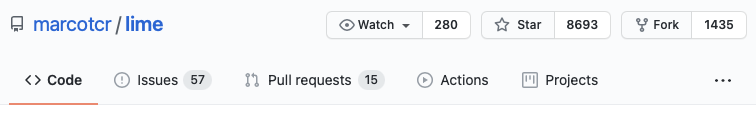
LIME

0 1 2 3 x
y
2
1
0 1 2 3 x
y
2
1
LIME
LEMON
EXPLAINER TECHNIQUES
LEMON
Can be used for any Python model...

sklearn-pmml-model

Can be used for any model...
EXPLAINER TECHNIQUES
Applications
Effectiveness of debt
collection strategies
DEBTOR MANAGEMENT
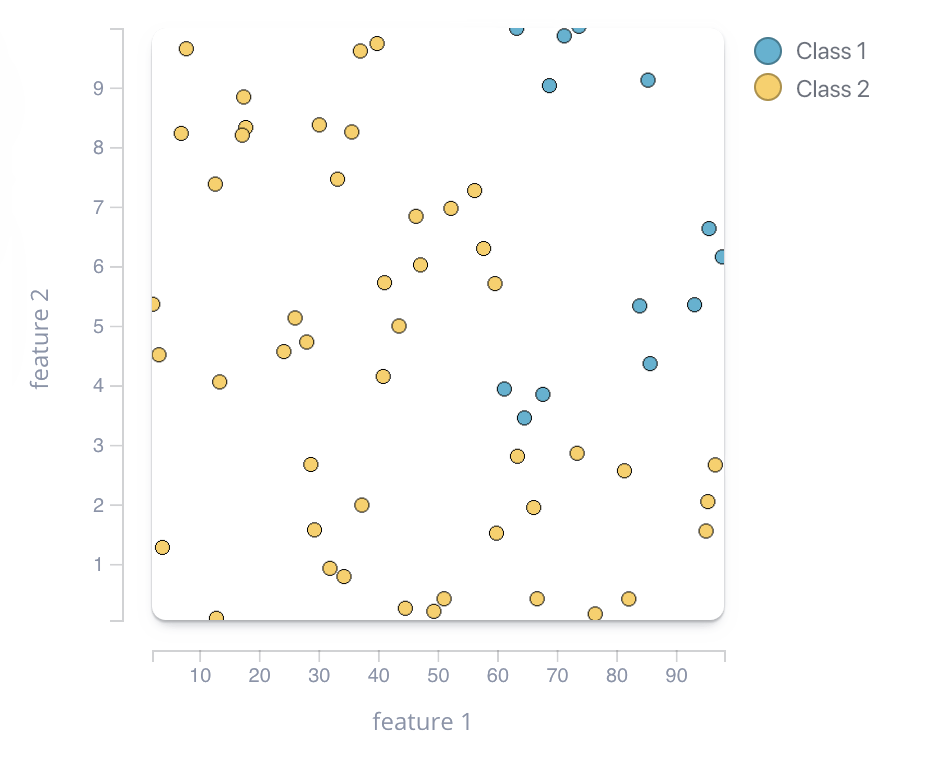
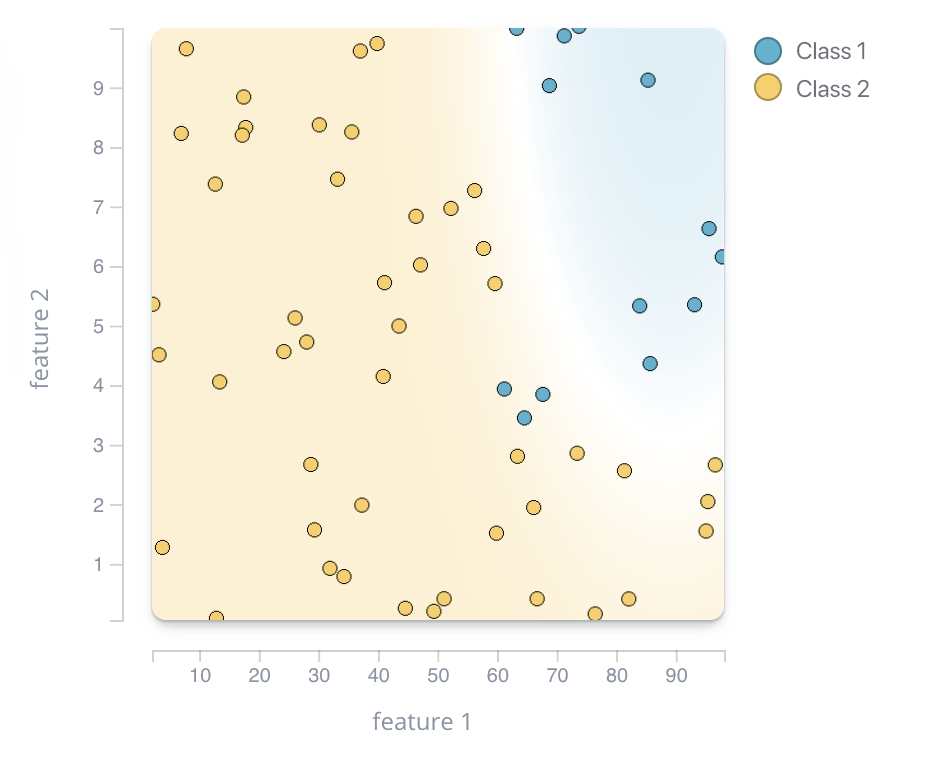
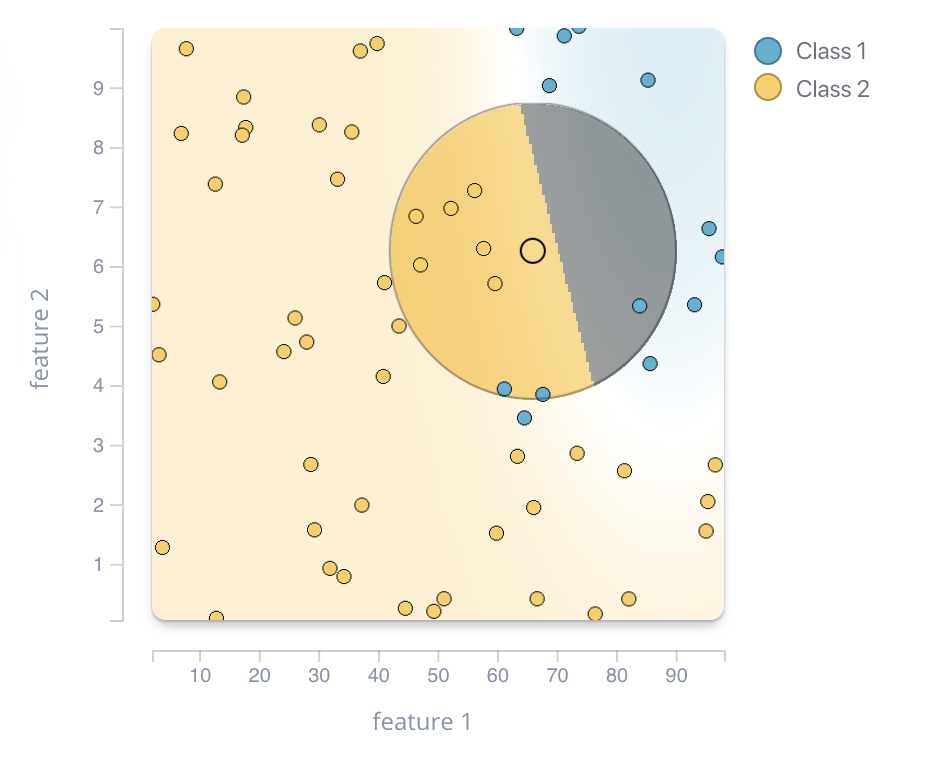
Surrogate learning
0 1 2 3 x
y
2
1
Feature 1
Feature 2
Feature 3
Feature 1
Feature 2
Feature 3
Feature 1
Feature 2
Feature 3
DEBTOR MANAGEMENT
Problem
Help data scientists to create and tune explanatory surrogate models.
DEBTOR MANAGEMENT
-
← Any tabular data set
-
← Any Python classifier, or PMML
-
← Different surrogate models

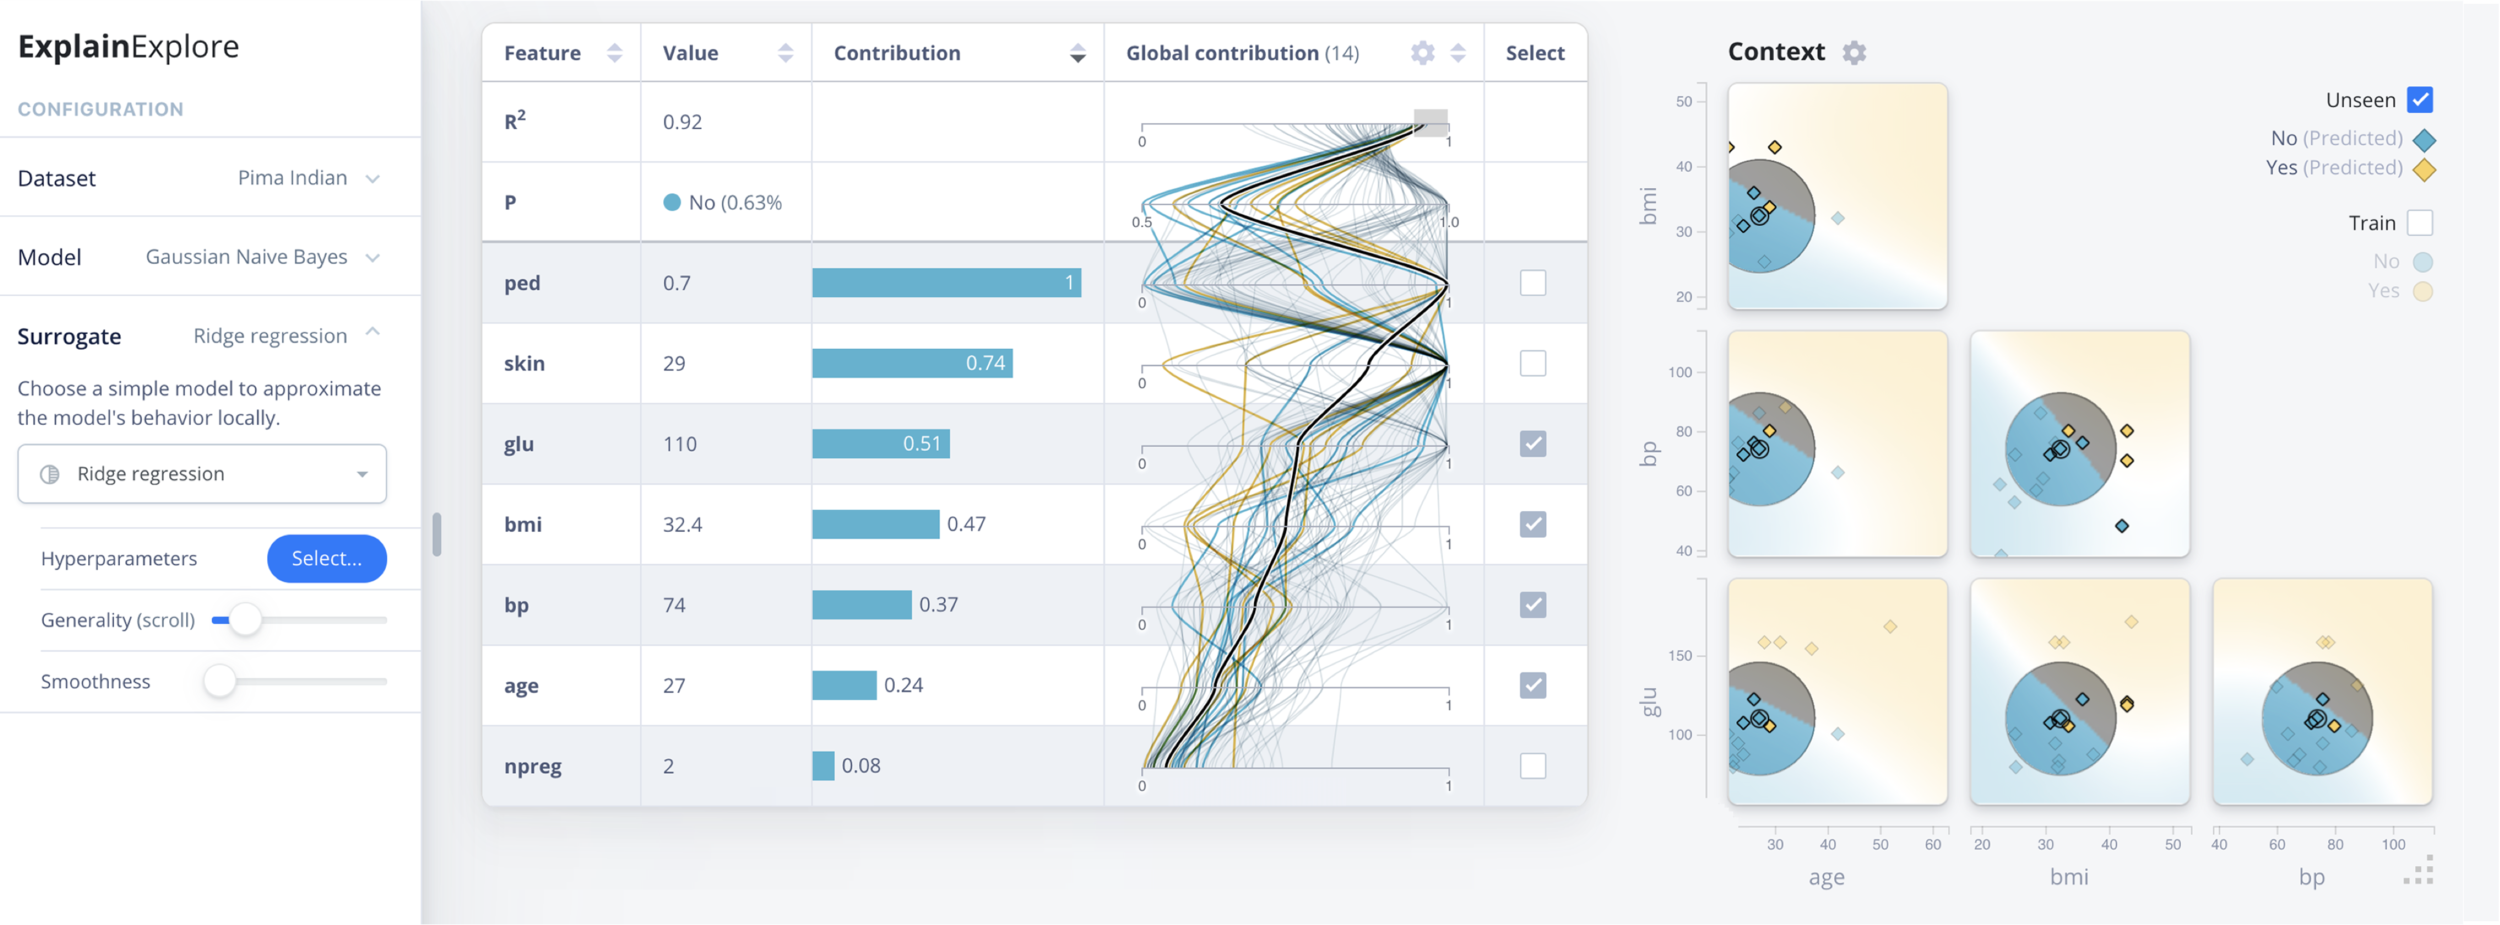
DEBTOR MANAGEMENT
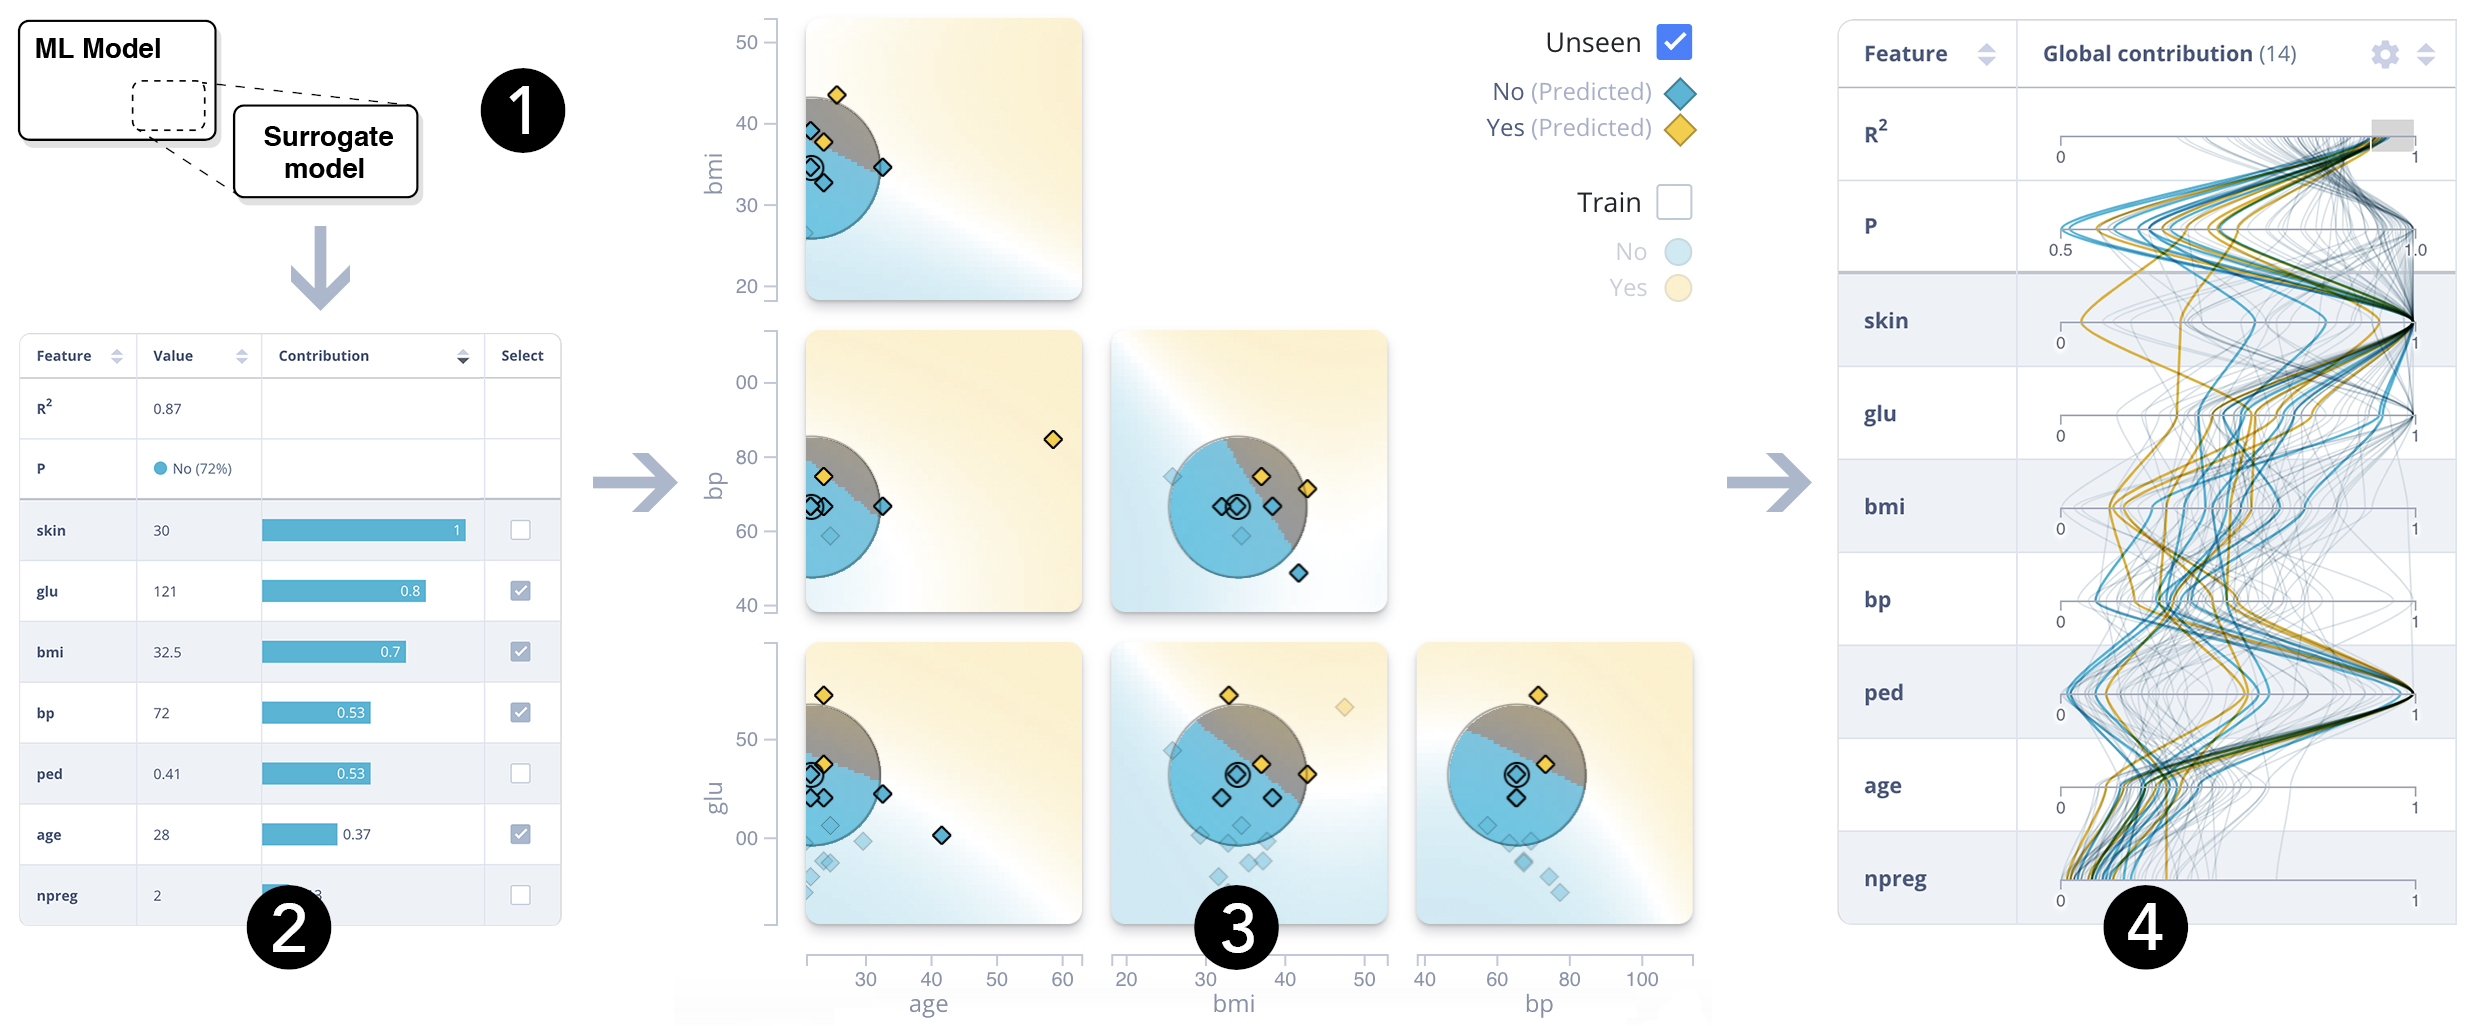
Configuration view
- ← Surrogate fidelity: R2
- ← Prediction
- ← Feature contribution
Local columns
Global columns
- Shows values or contribution →
- Line color = predicted class →
- Compare selected instance with data →
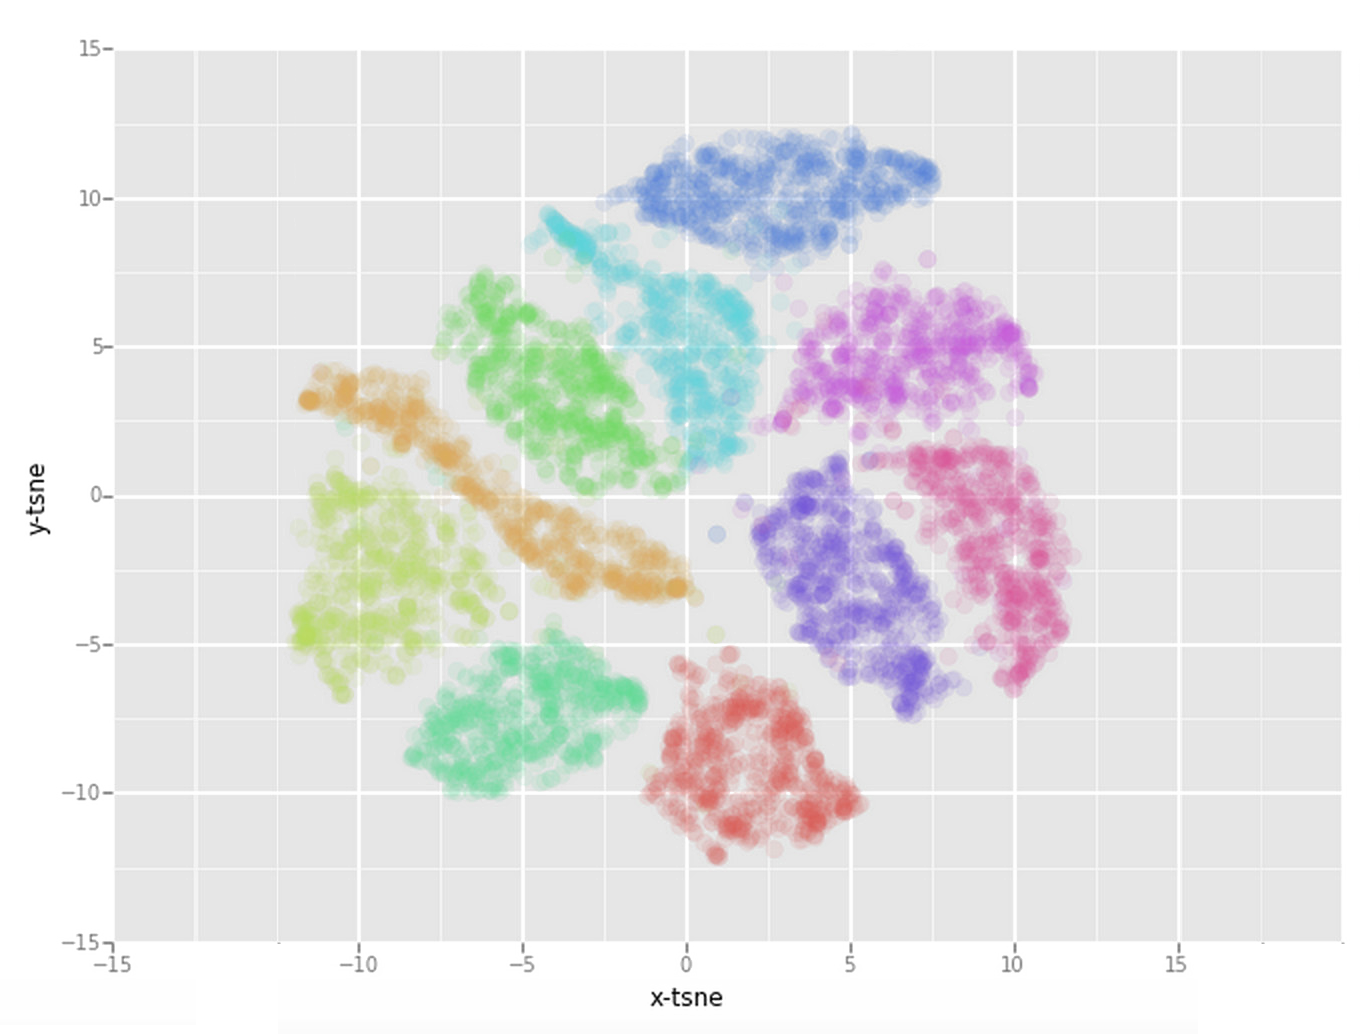
- Clusters indicate ‘strategies’ →
DEBTOR MANAGEMENT
Feature view
DEBTOR MANAGEMENT
Context view

DEBTOR MANAGEMENT
Context view
DEBTOR MANAGEMENT
Context view
Paper accepted at:
IEEE Pacific Visualization 2020
@
Tianjin, China
😢
Anywhere where tabular data is used.
Any model in Python or PMML.
- Debtor management (Team Randy Soet)
- Team Data Science / Wheel of Knowledge
- More soon!
DEBTOR MANAGEMENT
Applications
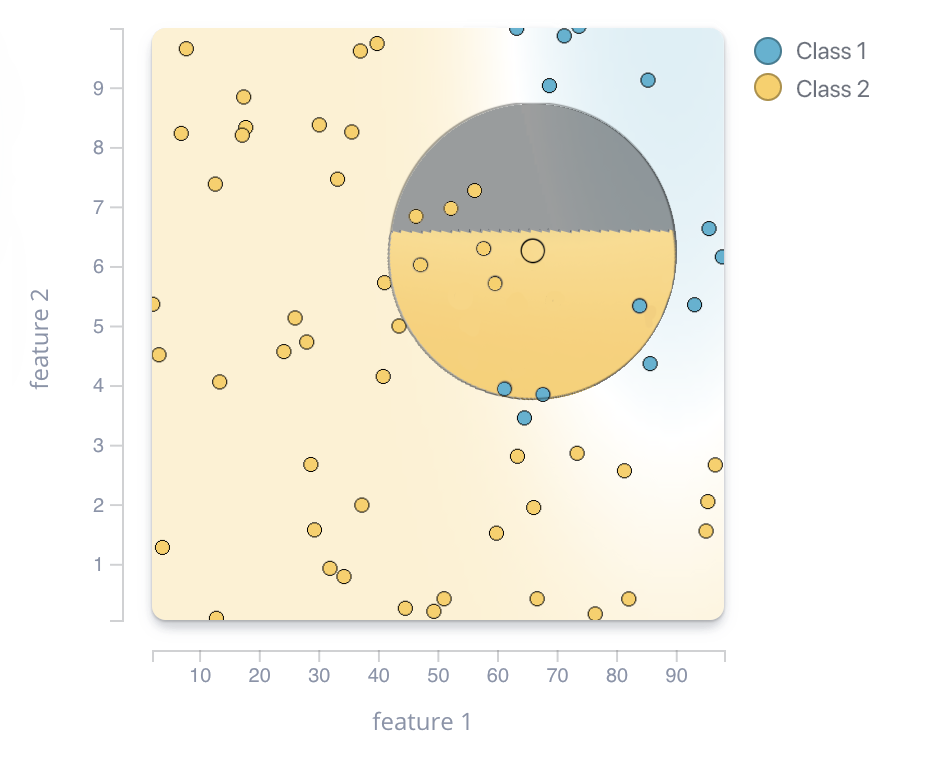
Machine Learning Interpretability through Contribution-Value Plots
CONTRIBUTION-VALUE PLOTS
Pre-existing techniques as elementary building blocks.
Prediction (ŷ)
x
ŷ


CONTRIBUTION-VALUE PLOTS
How?
Pre-existing techniques as elementary building blocks.
[1] Friedman, J. H. "Greedy function approximation: a gradient boosting machine.", 2001.
Prediction (ŷ)
Local PDP [1]
Sensitivity
analysis
x
ŷ


CONTRIBUTION-VALUE PLOTS
How?
Pre-existing techniques as elementary building blocks.
Prediction (ŷ)
Sensitivity
analysis
x
ŷ
[2] Goldstein, A., et al. "Peeking inside the black box: Visualizing statistical learning with plots of individual conditional expectation.", 2015.
Local PDP [1]
ICE plot [2]
Repeat
x
ŷ
CONTRIBUTION-VALUE PLOTS
How?
Pre-existing techniques as elementary building blocks.
[4] Lundberg, S. M., et. al.. "A unified approach to interpreting model predictions.". 2017.
Feature 1
Feature 2
Feature 3
Feature 4
Feature 5
[3] Ribeiro, M. T., et. al. ""Why should i trust you?" Explaining the predictions of any classifier.", 2016.
CONTRIBUTION-VALUE PLOTS
How?
Pre-existing techniques as elementary building blocks.
Prediction (ŷ)
Sensitivity
analysis
x
ŷ
Local PDP [1]
ICE plot [2]
Repeat
β
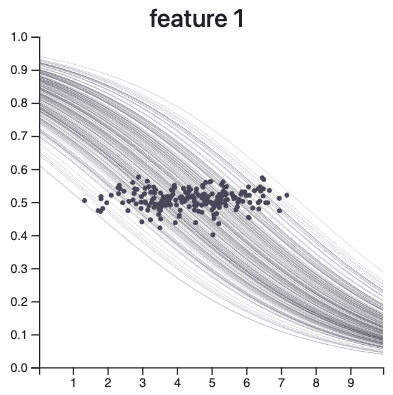
CONTRIBUTION-VALUE PLOTS
How?
Pre-existing techniques as elementary building blocks.
Prediction (ŷ)
Local PDP
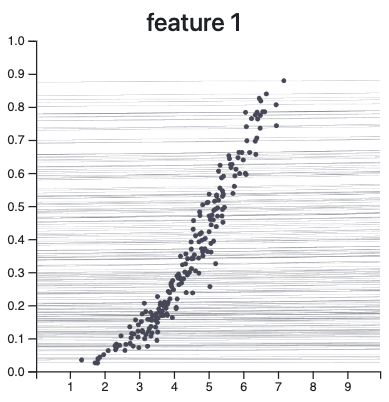
ICE plot
Contribution (β)
Sensitivity
analysis
Repeat
x
ŷ
β
x
β
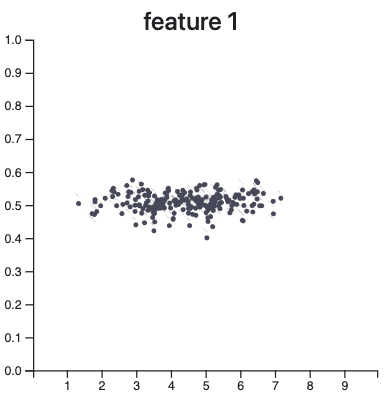
CONTRIBUTION-VALUE PLOTS
How?
Pre-existing techniques as elementary building blocks.
Prediction (ŷ)
Local PDP
ICE plot
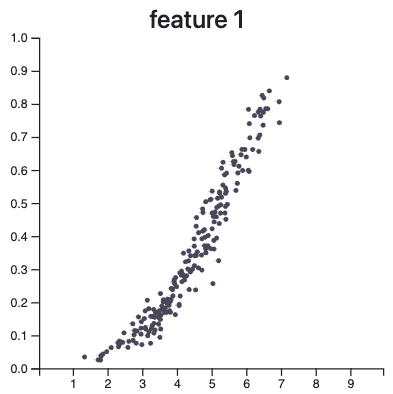
Contribution (β)
LCV plot
Sensitivity
analysis
Sensitivity
analysis
Repeat
x
ŷ
β
x
β
CONTRIBUTION-VALUE PLOTS
How?
How?
Pre-existing techniques as elementary building blocks.
Prediction (ŷ)
Local PDP
ICE plot
Contribution (β)
LCV plot
GCV plot
Sensitivity
analysis
Sensitivity
analysis
Repeat
Repeat
x
ŷ
β
x
β
CONTRIBUTION-VALUE PLOTS
VISxAI AnalyzeData
By iamdecode


