Visualization for Explainable AI
May 12th

Dennis Collaris
PhD Visualization

75% risk!
Black box
model

Domain expert
But why?

Data
Machine learning


Trending issue


Husky vs. Wolf problem
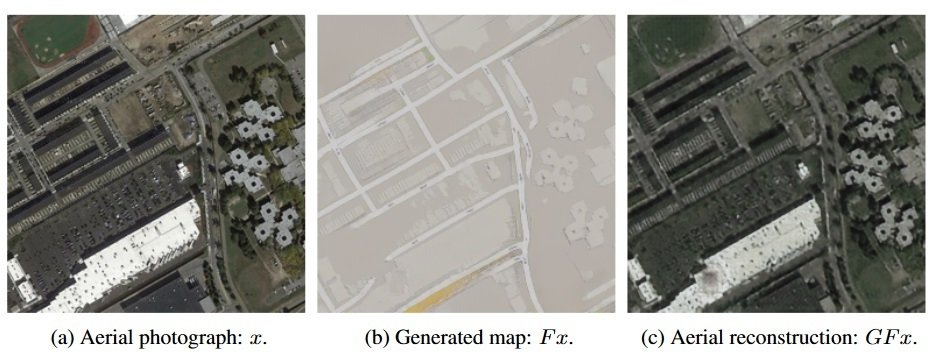
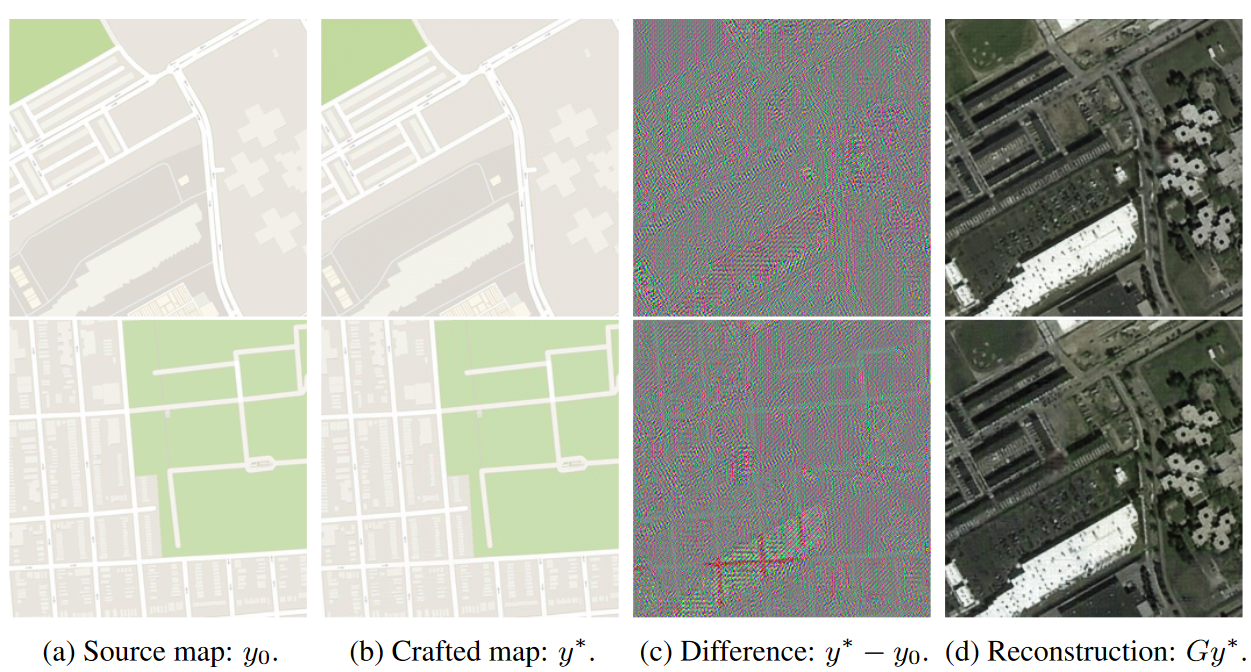
CycleGAN
75% risk!
Black box
model
Domain expert
Explanation

Aha!
But why?
Data

Explainer
Machine learning
Global
Instance-level
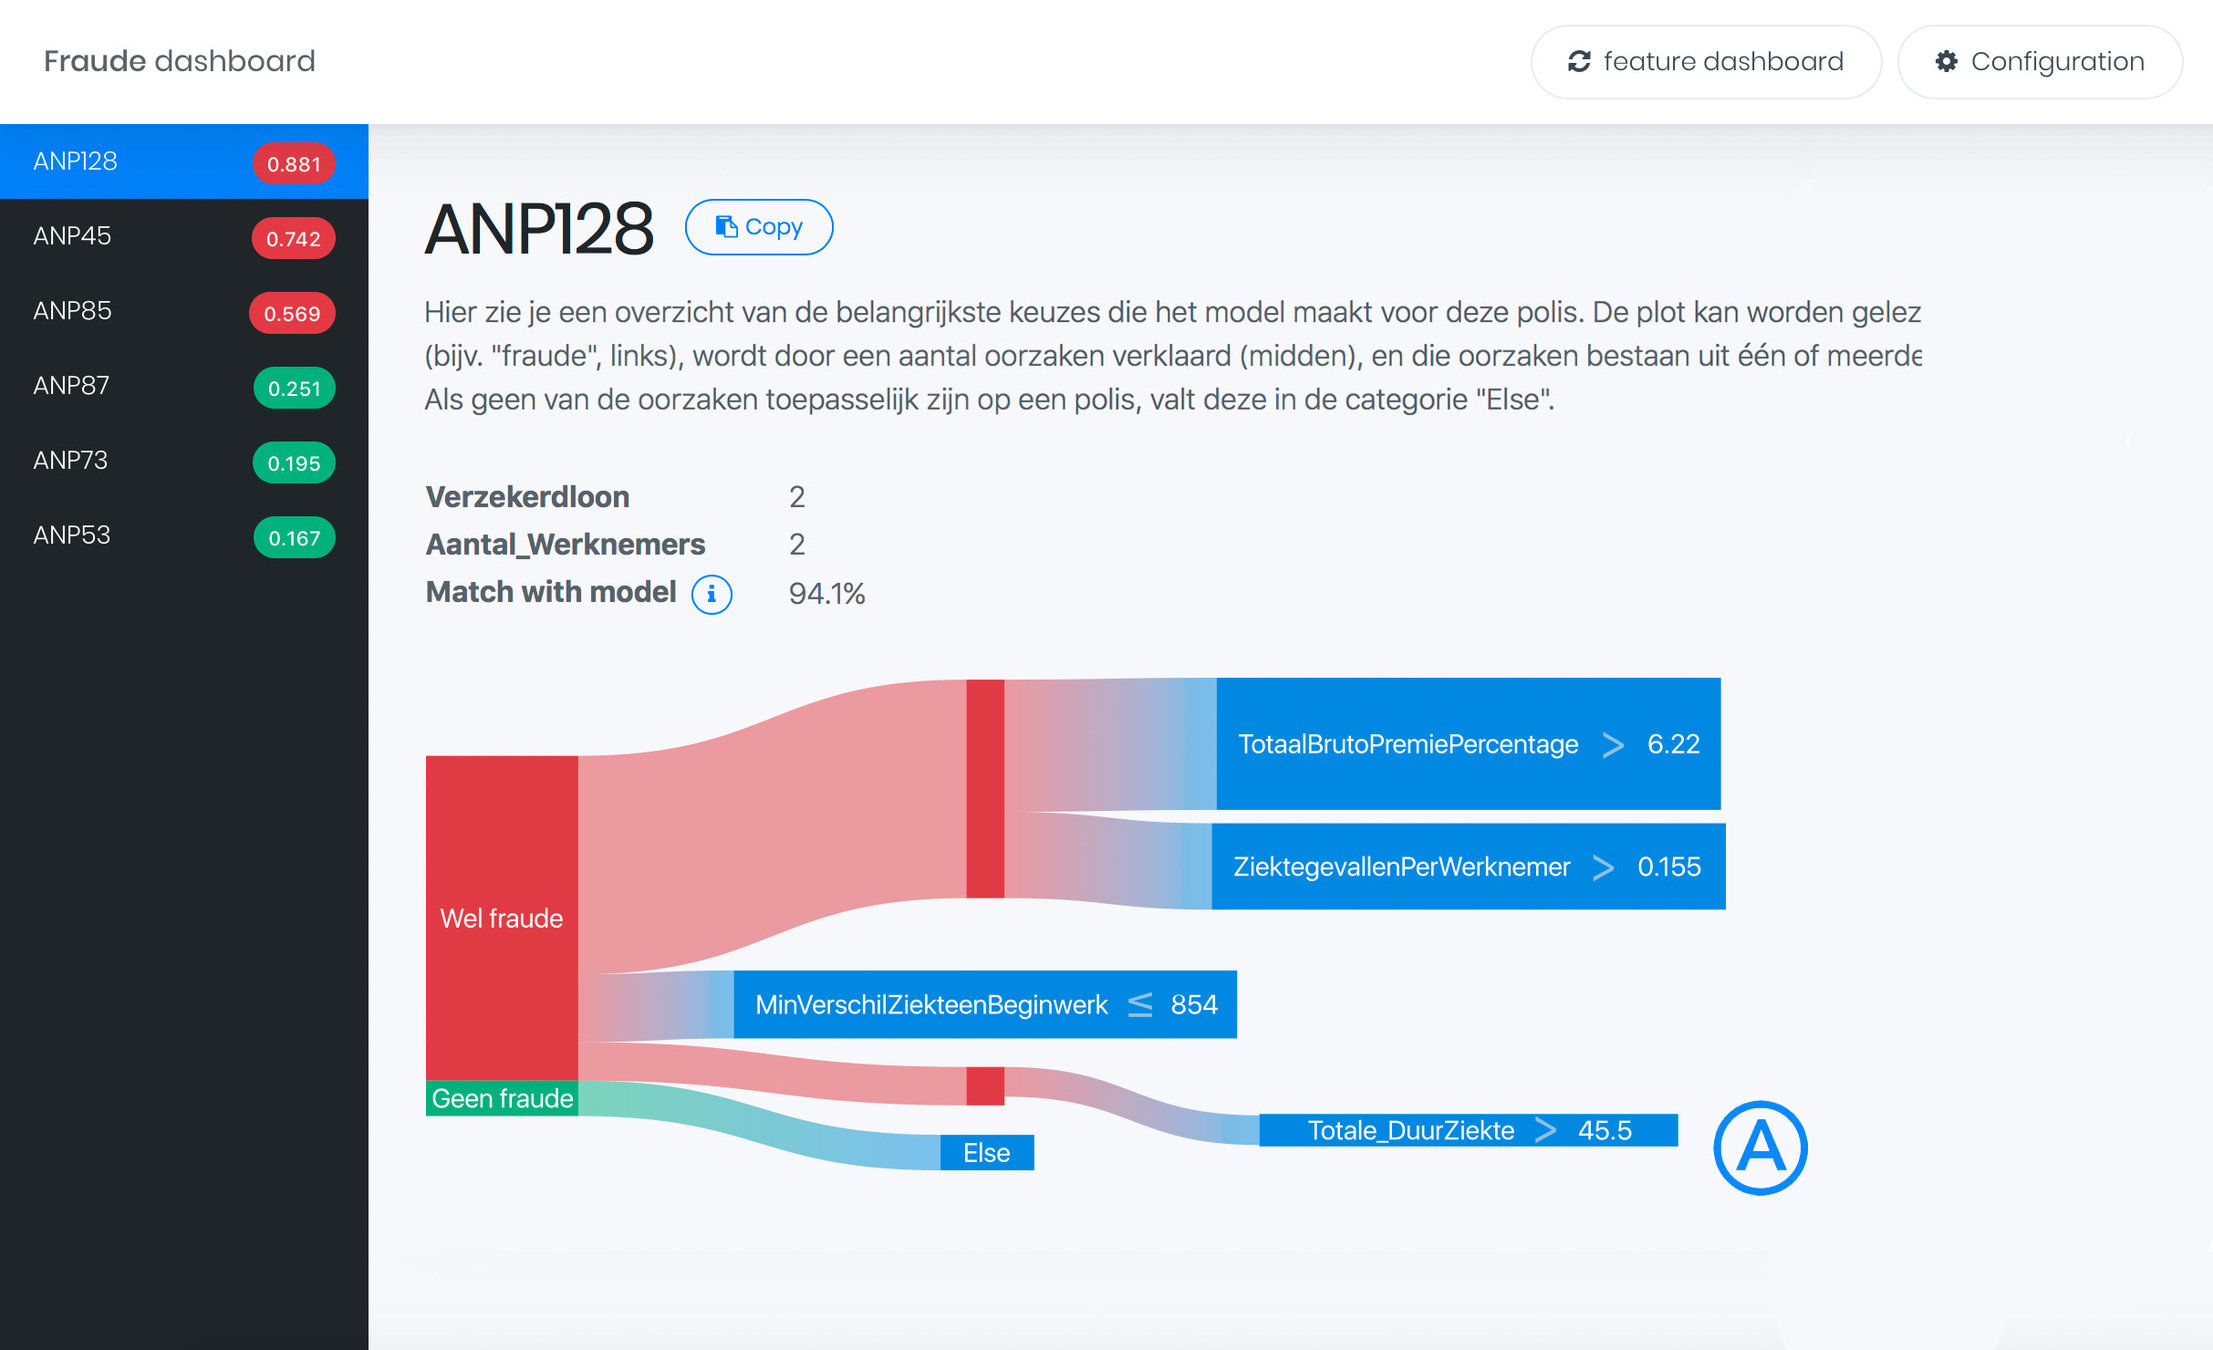
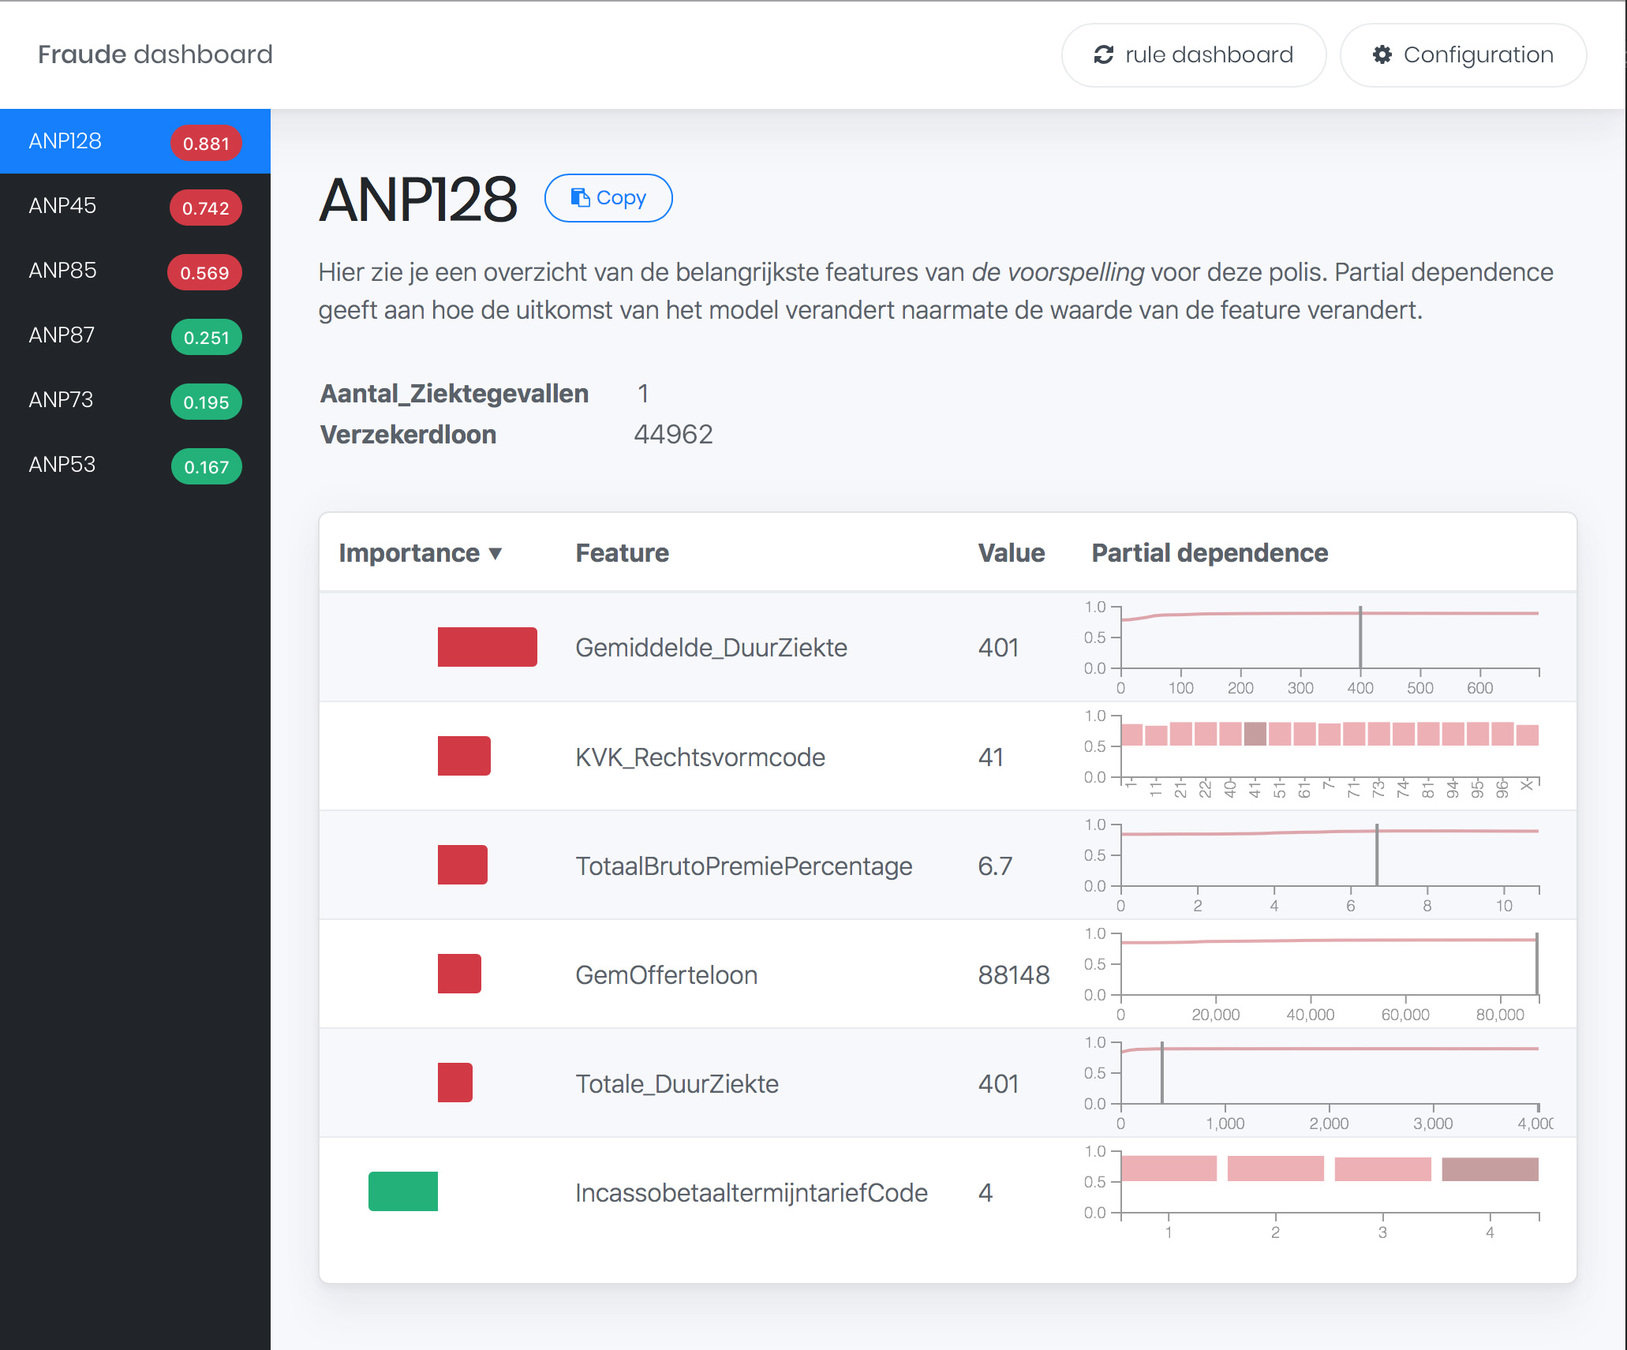
Fraud Dashboard
Overview
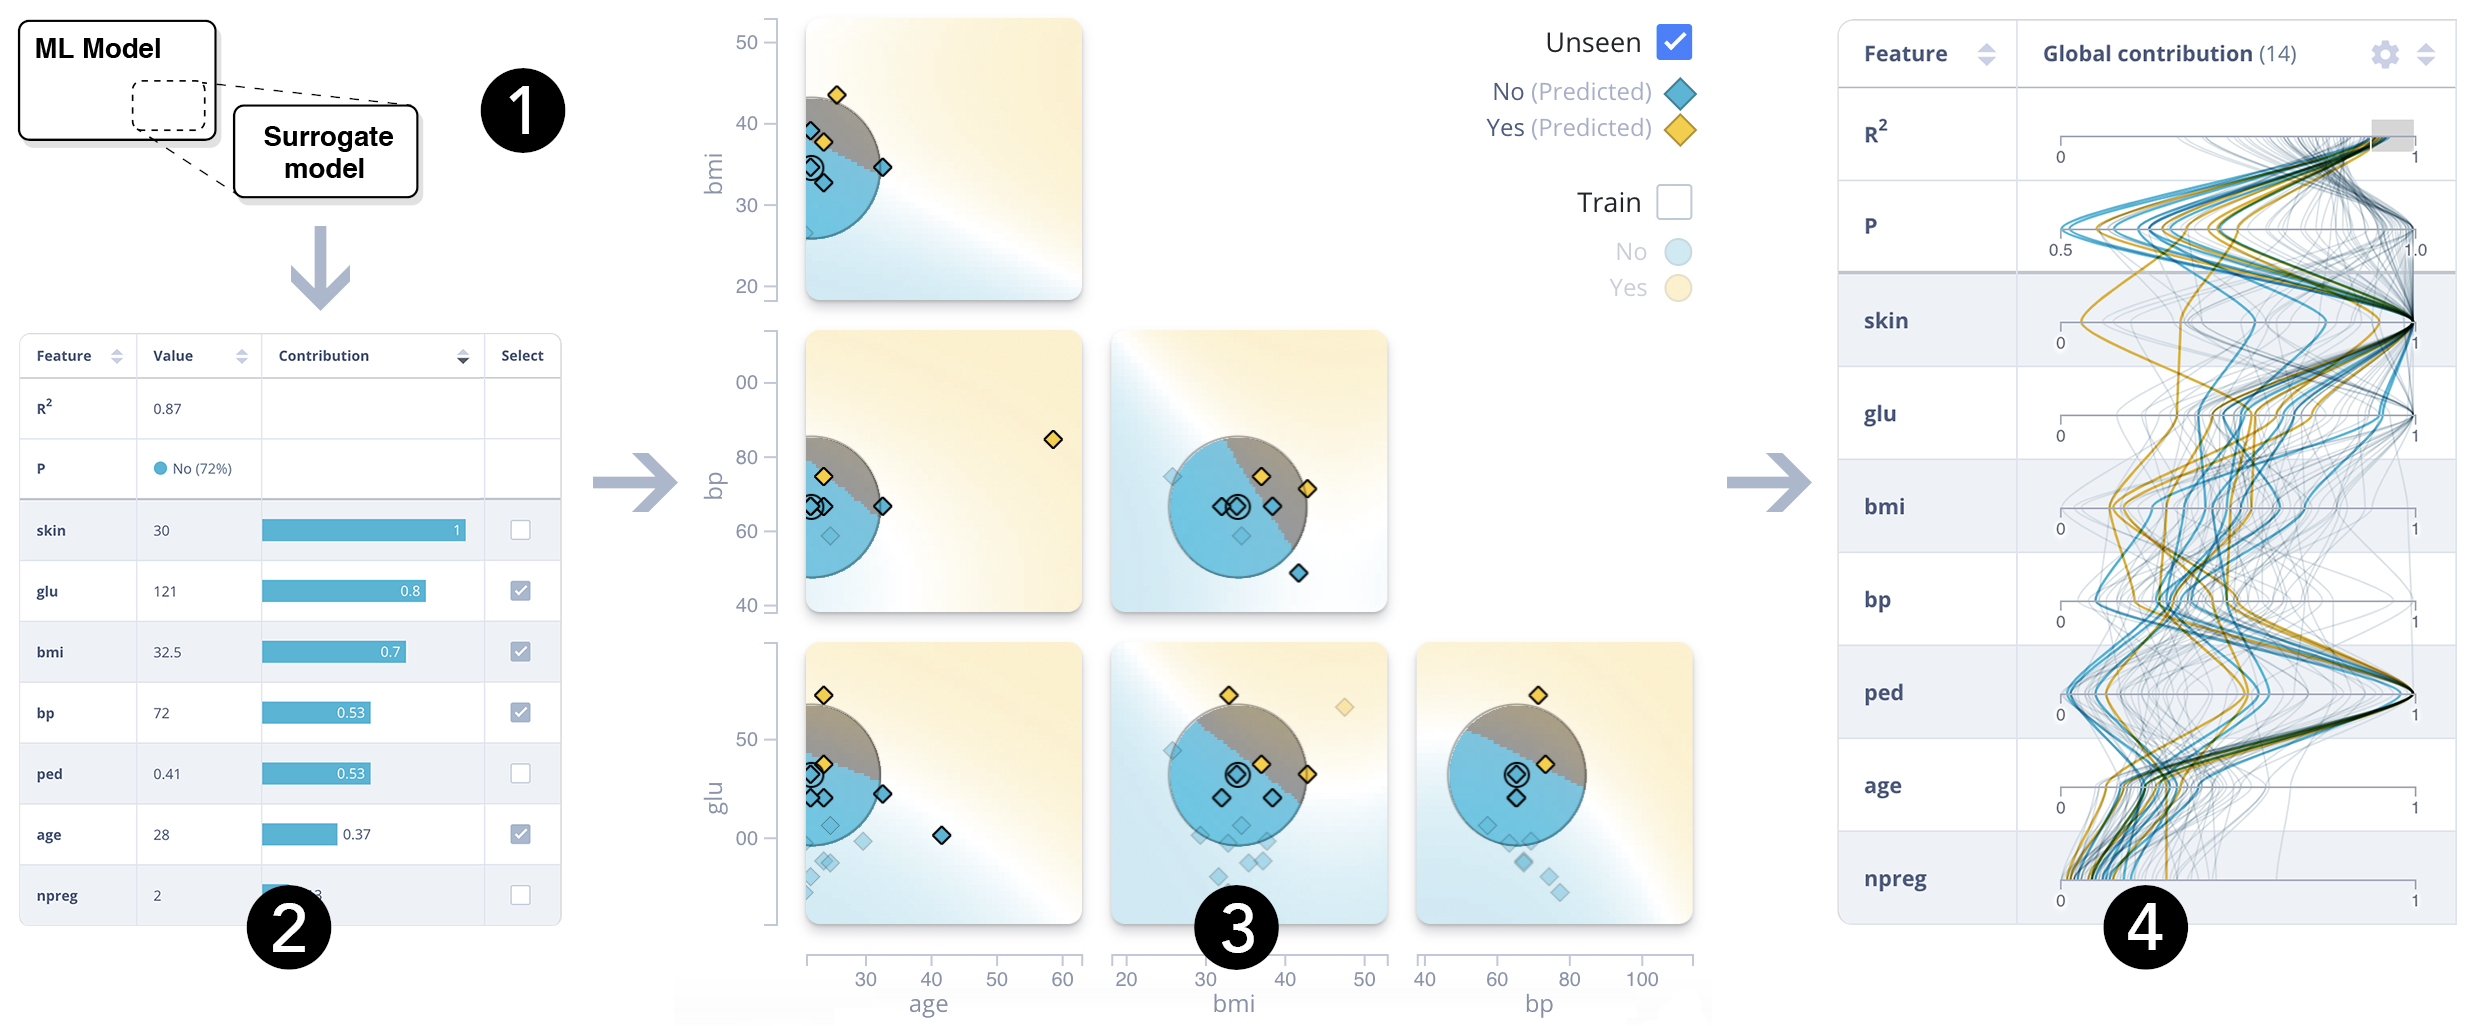
ExplainExplore
Global
Instance-level
Fraud Dashboard
Overview
ExplainExplore
Contribution-Value Plots
Global
Instance-level
Fraud Dashboard
Overview
ExplainExplore
CV Plots
Global
Instance-level
Fraud Dashboard
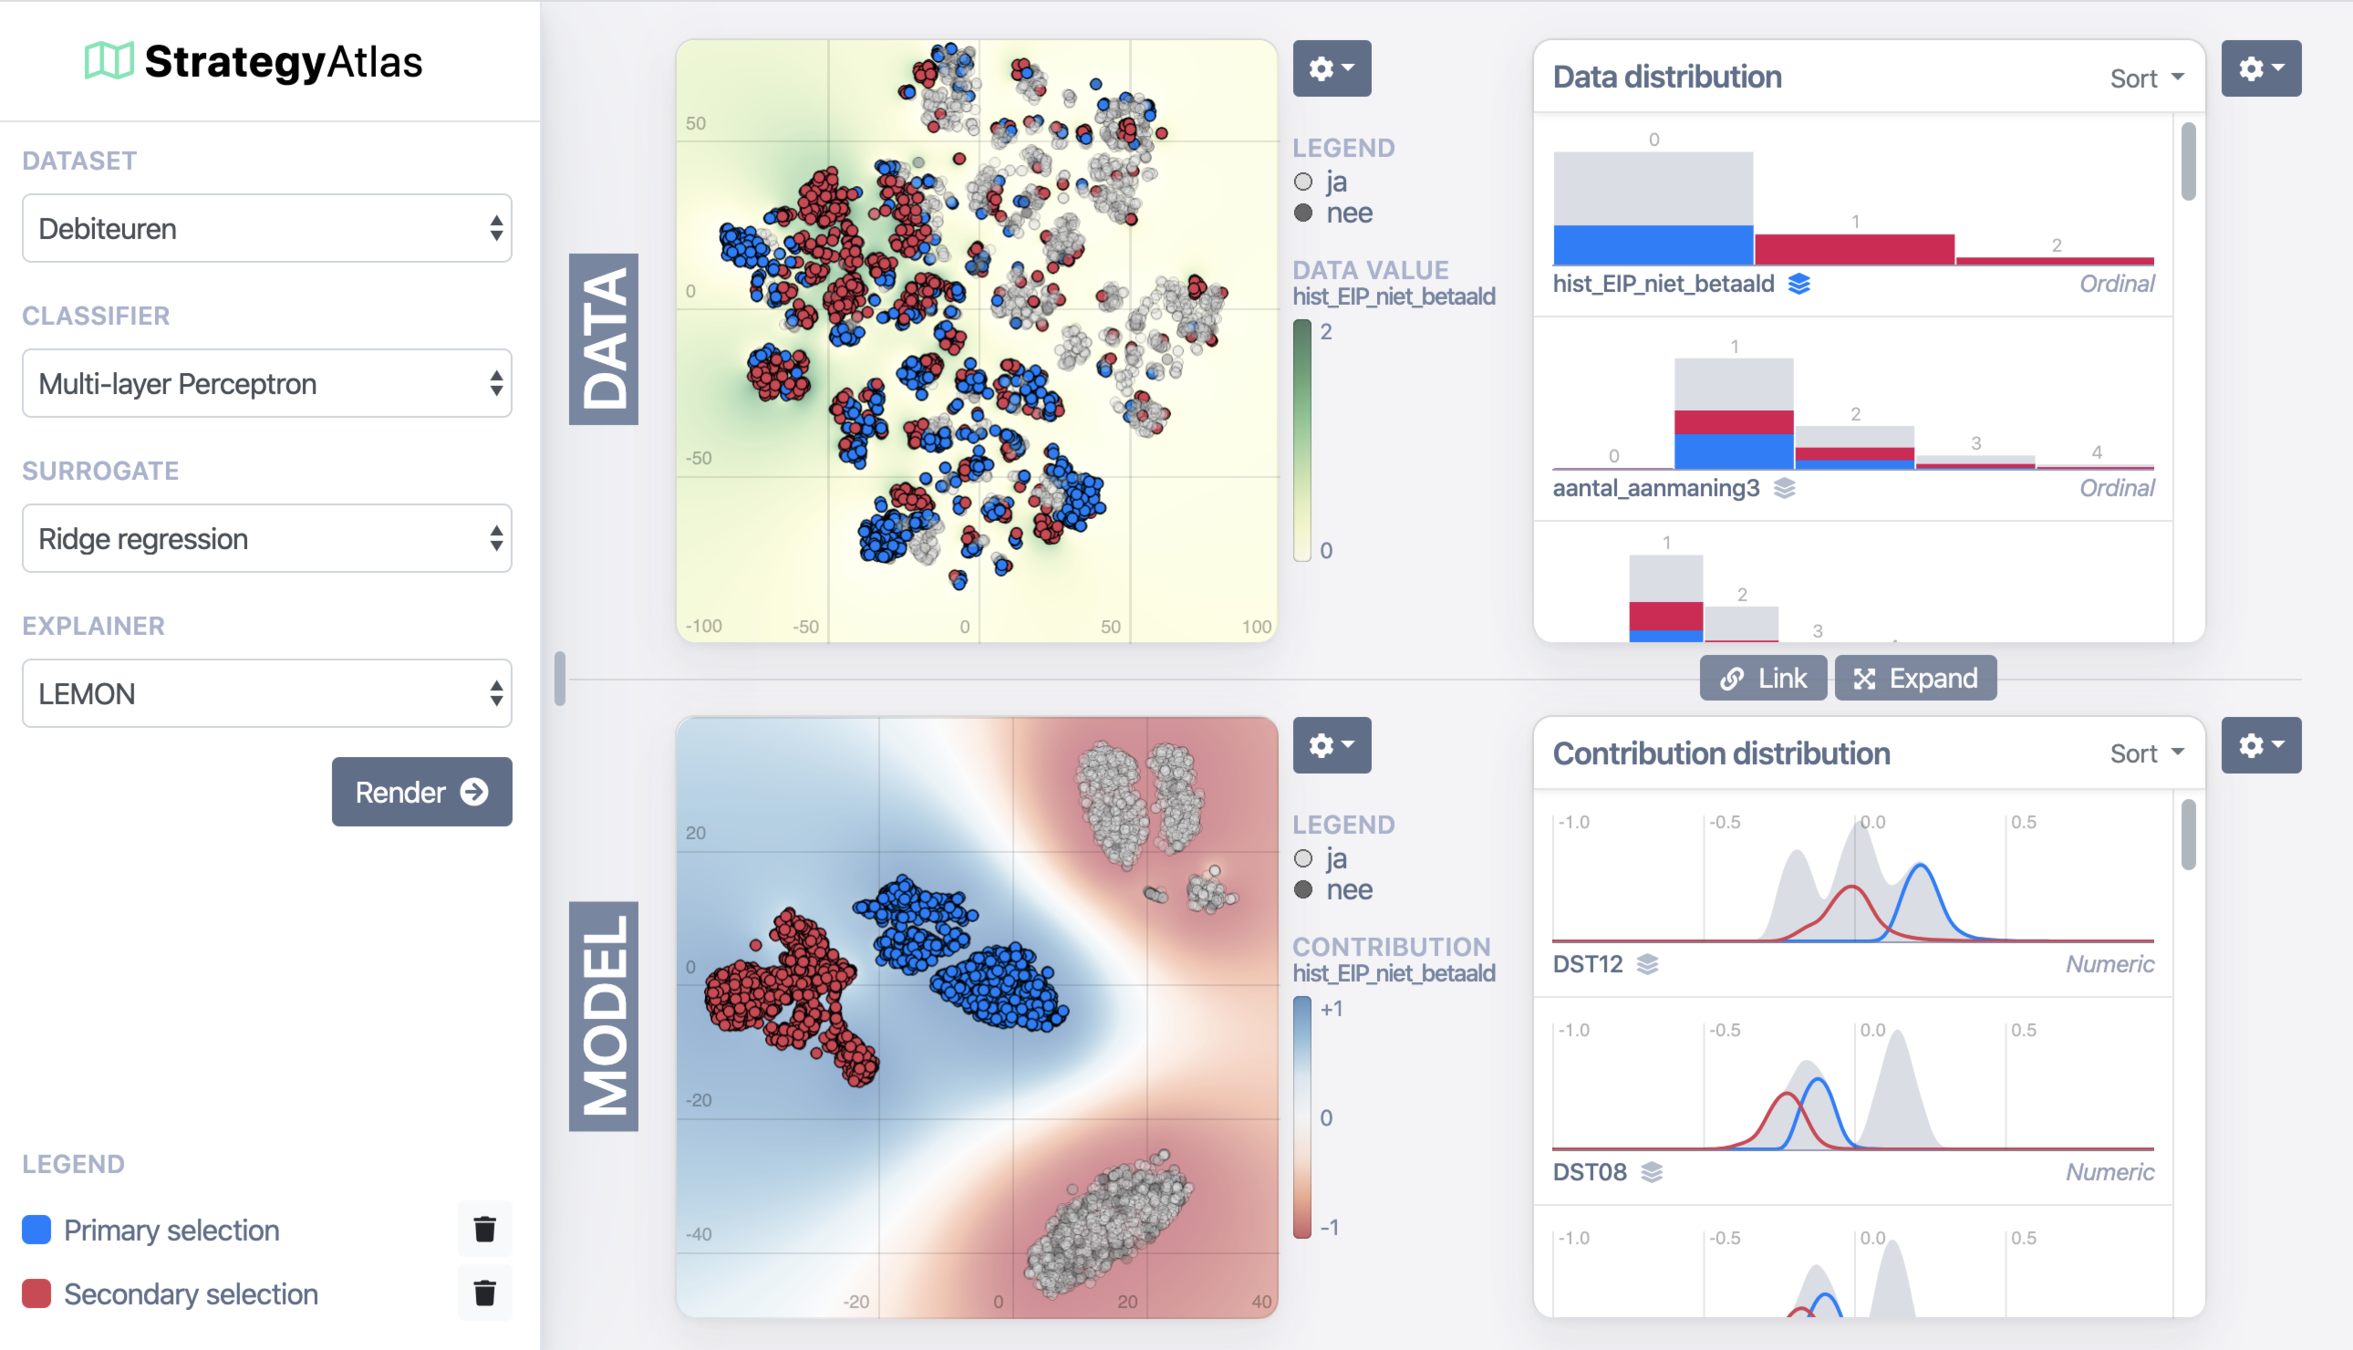
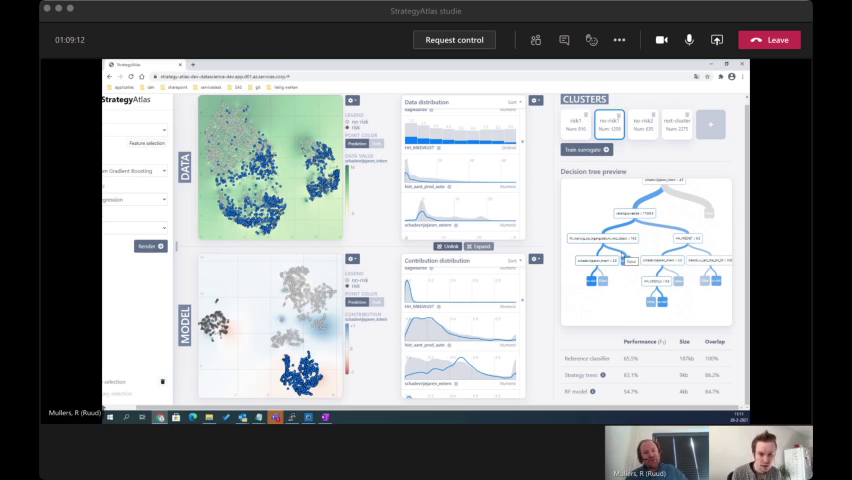
StrategyAtlas
Overview

Fraud detection explanations
sick-leave insurances
FRAUD DETECTION EXPLANATIONS
Data
- Missing/incorrect values
Model
- 100 Random Forest
- 500 trees each
- ~25 decisions per tree
- 1.312.471 decisions total!
×
OOB error: 27.7%
Problem
FRAUD DETECTION EXPLANATIONS
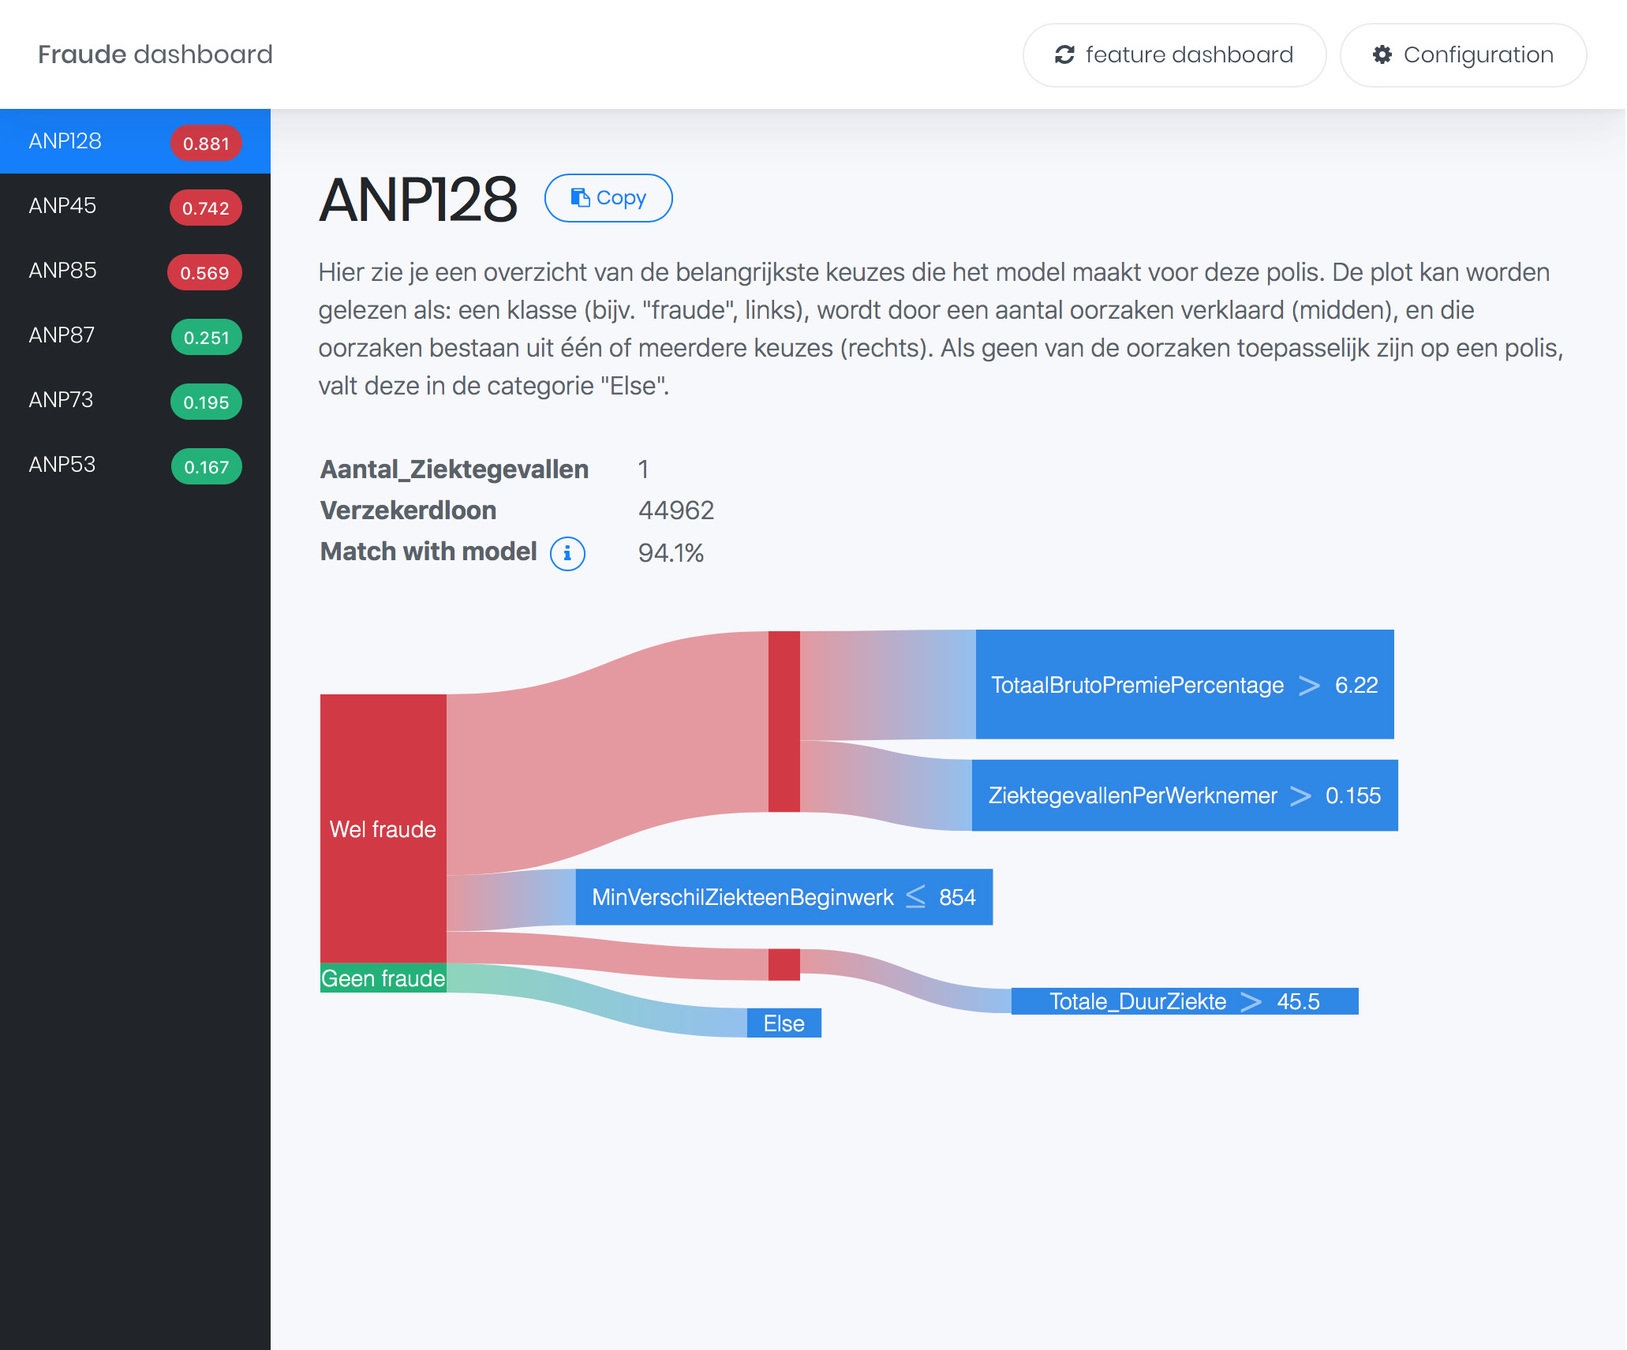


My solution
FRAUD DETECTION EXPLANATIONS
Fraud team happy! 🎉
FRAUD DETECTION EXPLANATIONS
Any project using a Random Forest in R!
- Given a workshop for data science teams
- Code for dashboard available at team Leon
Applications
FRAUD DETECTION EXPLANATIONS

Paper presented at:
Workshop on Human Interpretability in Machine Learning
Stockholm, Sweden
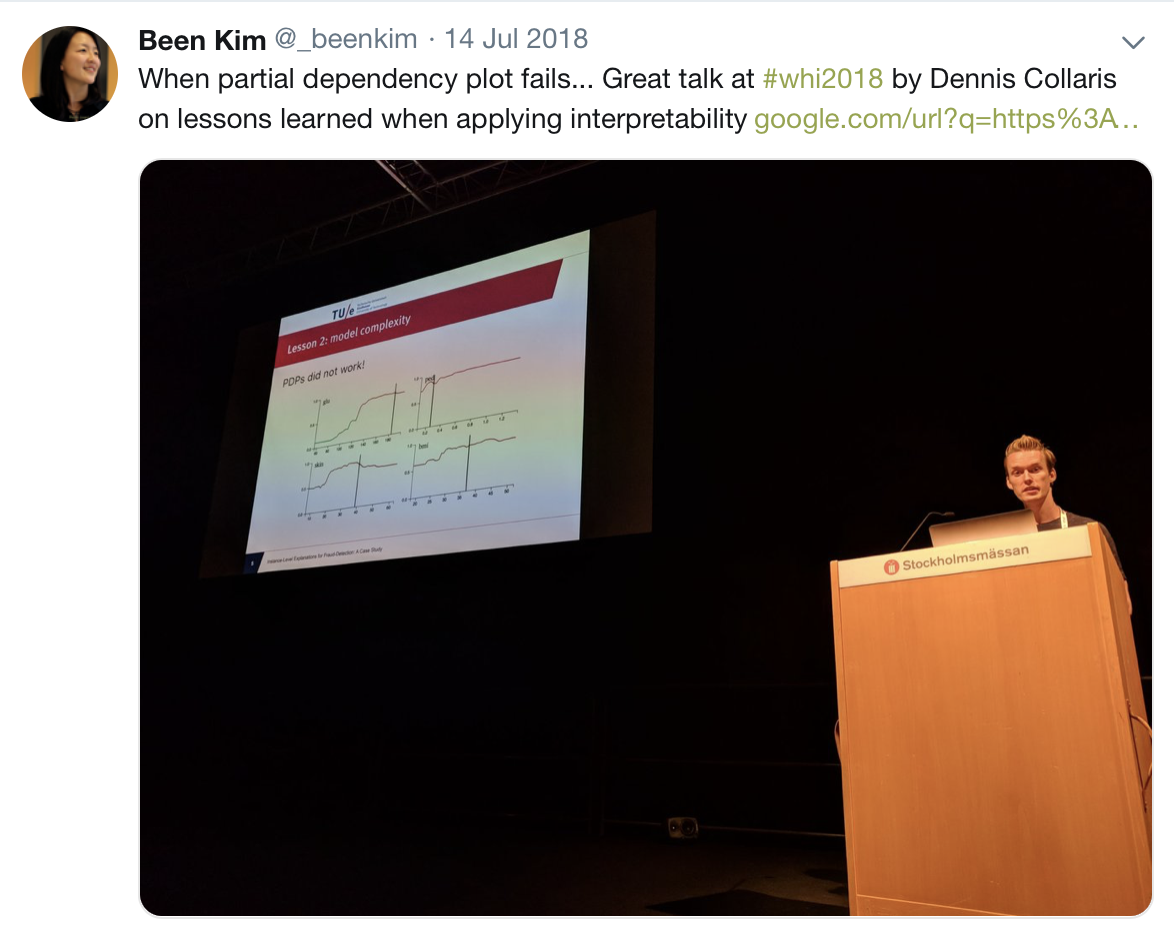
FRAUD DETECTION EXPLANATIONS
Effectiveness of debt
collection strategies
DEBTOR MANAGEMENT
Help data scientists to create and tune explanatory surrogate models.
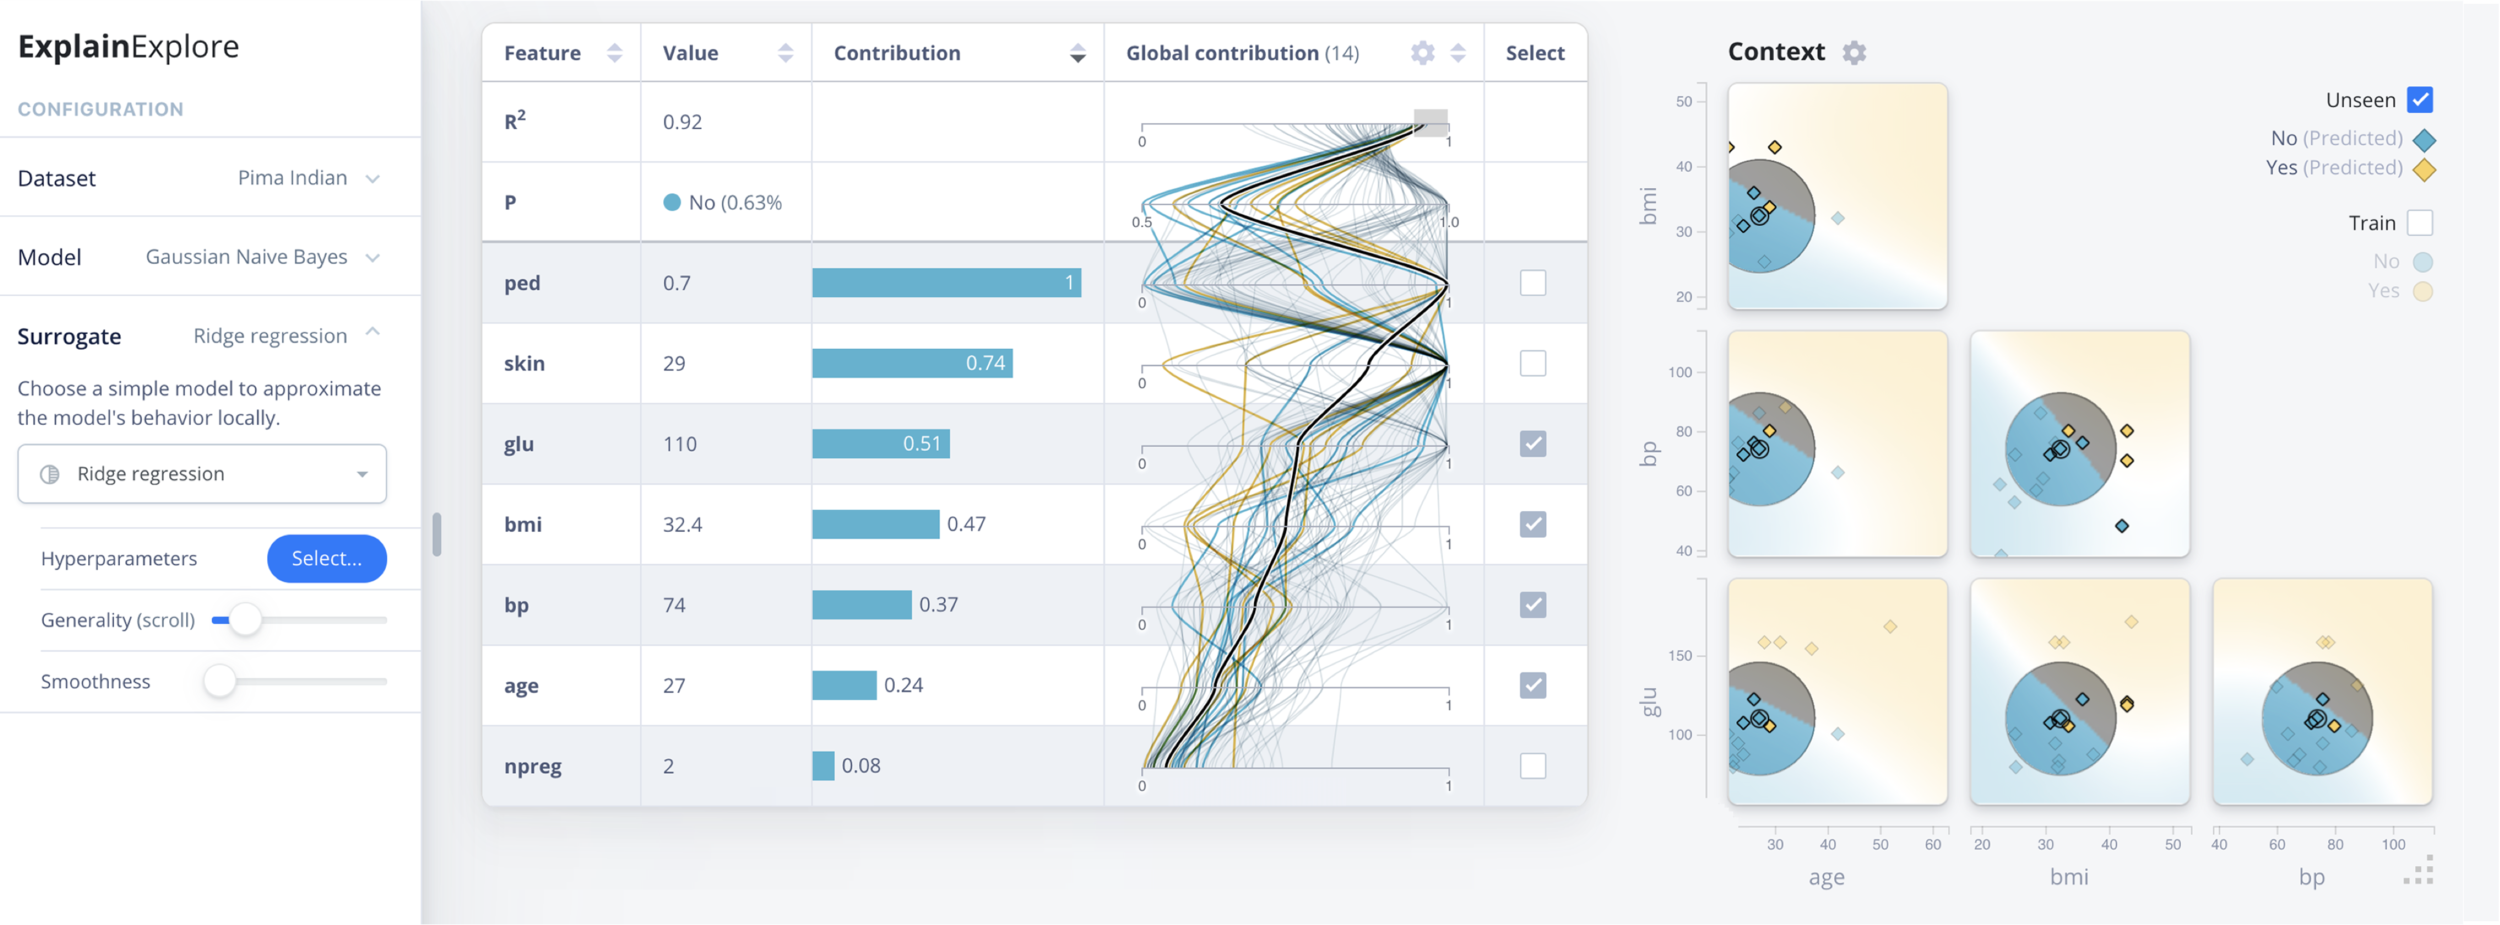
DEBTOR MANAGEMENT
My solution
DEBTOR MANAGEMENT
Data scientists happy! 🎉
Anywhere where tabular data is used.
Any model in Python or PMML.
- Debtor management (Team Randy Soet)
- Discussing operationalization
DEBTOR MANAGEMENT
Applications
Paper presented at:
IEEE Pacific Visualization 2020
@
Tianjin, China
😢
DEBTOR MANAGEMENT
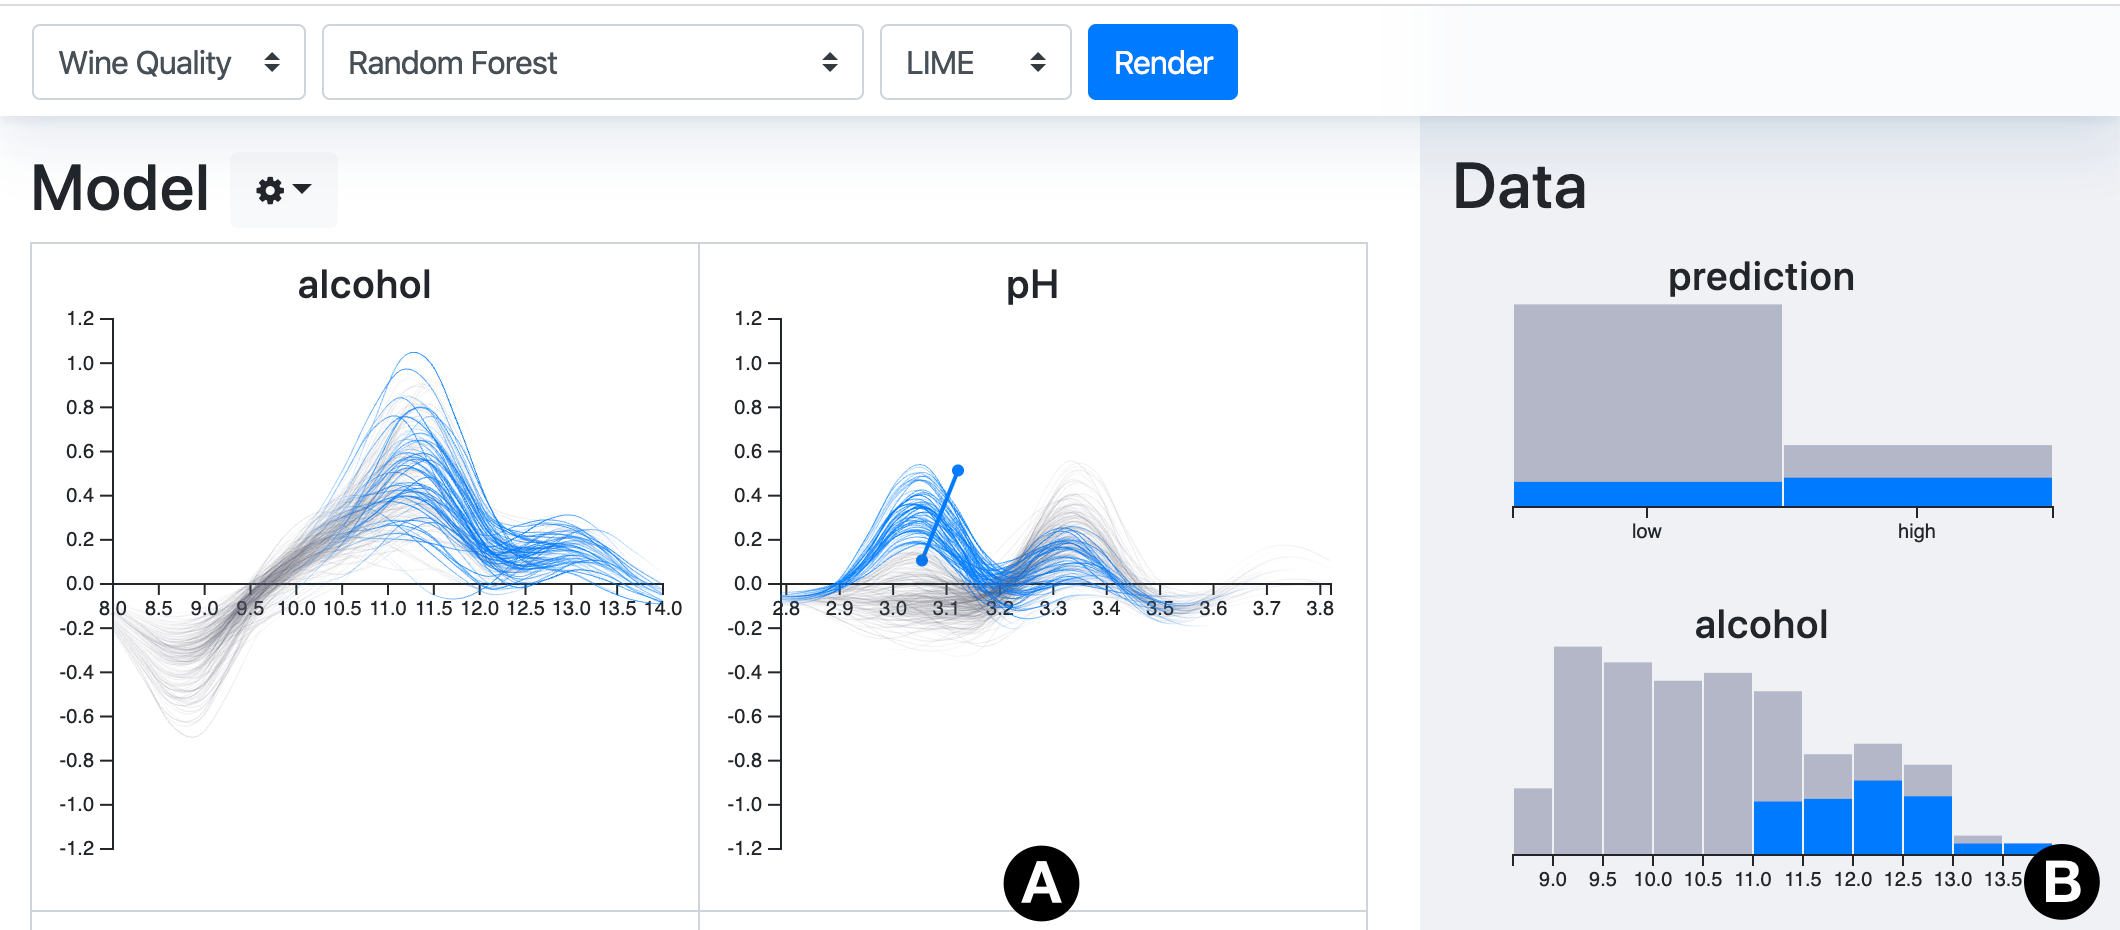
Machine Learning Interpretability through Contribution-Value Plots
CONTRIBUTION-VALUE PLOTS
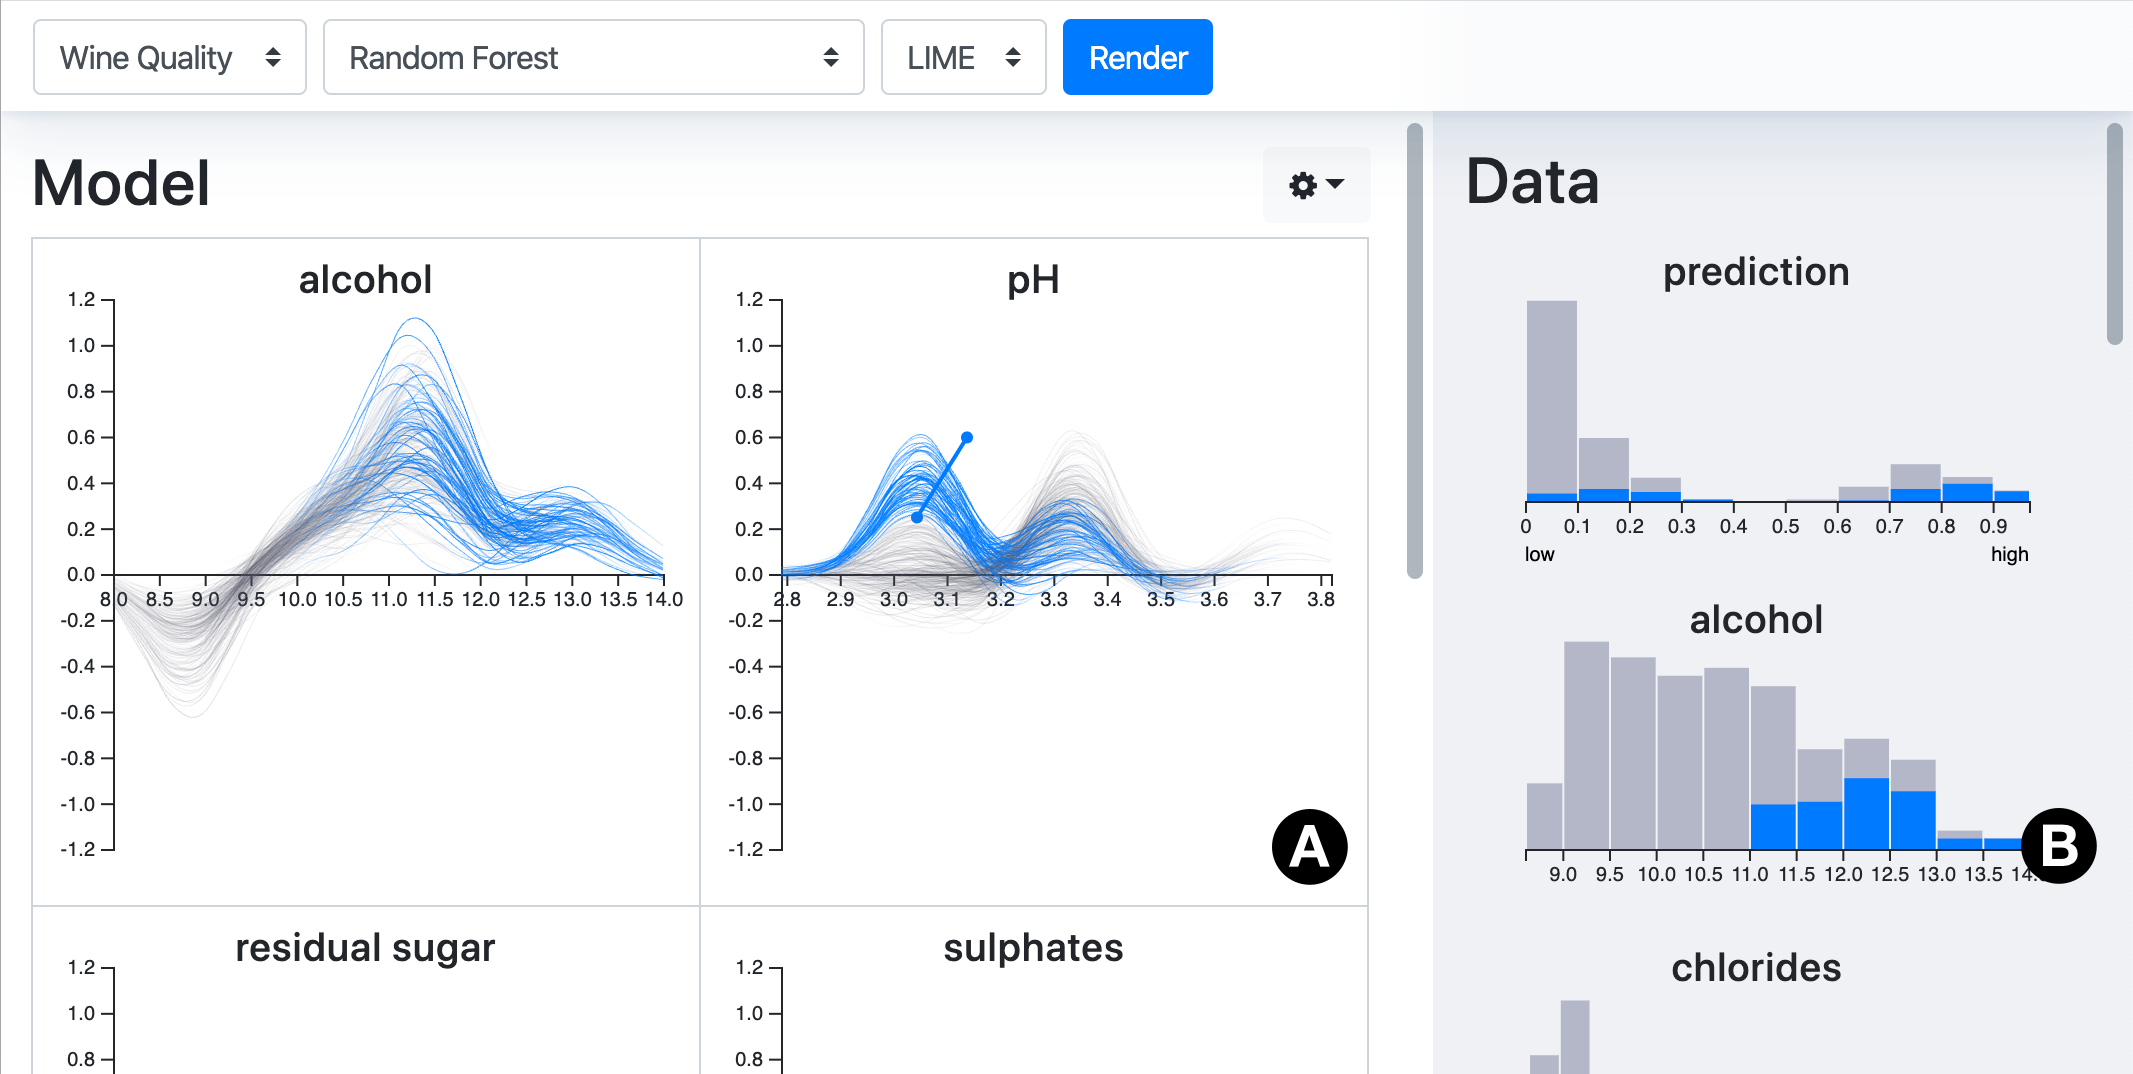
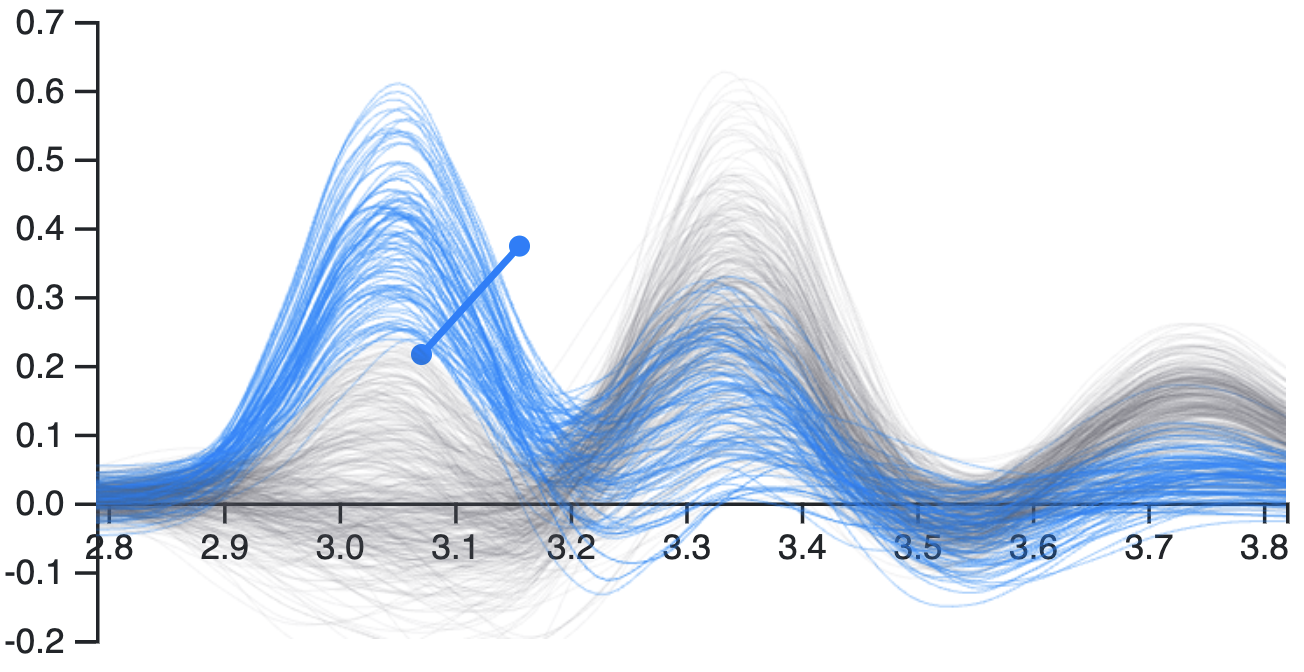
Pre-existing techniques as elementary building blocks.
Prediction (ŷ)
x
ŷ


CONTRIBUTION-VALUE PLOTS
How?
Pre-existing techniques as elementary building blocks.
[1] Friedman, J. H. "Greedy function approximation: a gradient boosting machine.", 2001.
Prediction (ŷ)
Local PDP [1]
Sensitivity
analysis
x
ŷ


CONTRIBUTION-VALUE PLOTS
How?
Pre-existing techniques as elementary building blocks.
Prediction (ŷ)
Sensitivity
analysis
x
ŷ
[2] Goldstein, A., et al. "Peeking inside the black box: Visualizing statistical learning with plots of individual conditional expectation.", 2015.
Local PDP [1]
ICE plot [2]
Repeat
x
ŷ
CONTRIBUTION-VALUE PLOTS
How?
Pre-existing techniques as elementary building blocks.
[4] Lundberg, S. M., et. al.. "A unified approach to interpreting model predictions.". 2017.
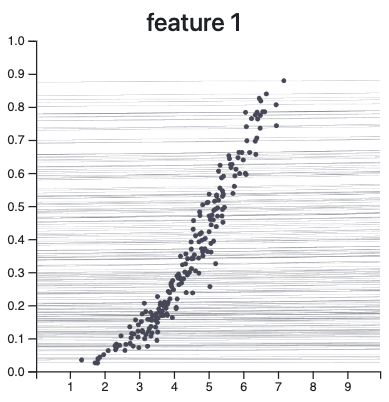
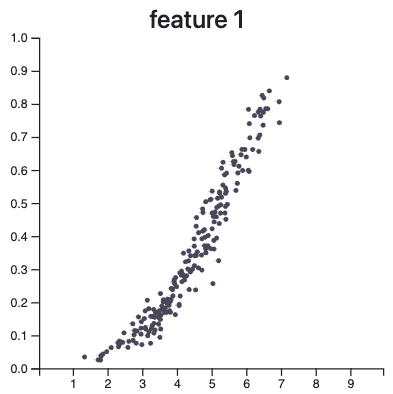
Feature 1
Feature 2
Feature 3
Feature 4
Feature 5
[3] Ribeiro, M. T., et. al. ""Why should i trust you?" Explaining the predictions of any classifier.", 2016.
CONTRIBUTION-VALUE PLOTS
How?
Pre-existing techniques as elementary building blocks.
Prediction (ŷ)
Sensitivity
analysis
x
ŷ
Local PDP [1]
ICE plot [2]
Repeat
β
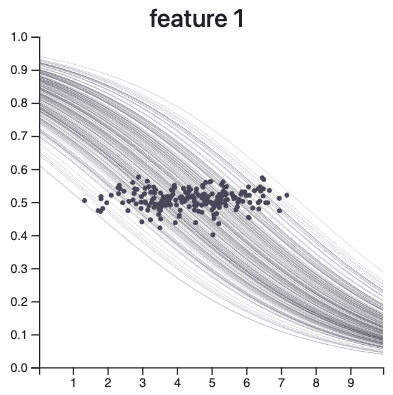
CONTRIBUTION-VALUE PLOTS
How?
Pre-existing techniques as elementary building blocks.
Prediction (ŷ)
Local PDP
ICE plot
Contribution (β)
Sensitivity
analysis
Repeat
x
ŷ
β
x
β
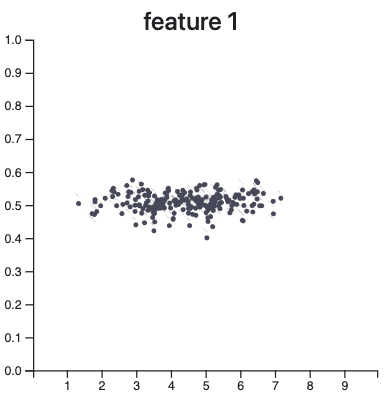
CONTRIBUTION-VALUE PLOTS
How?
Pre-existing techniques as elementary building blocks.
Prediction (ŷ)
Local PDP
ICE plot
Contribution (β)
LCV plot
Sensitivity
analysis
Sensitivity
analysis
Repeat
x
ŷ
β
x
β
CONTRIBUTION-VALUE PLOTS
How?
How?
Pre-existing techniques as elementary building blocks.
Prediction (ŷ)
Local PDP
ICE plot
Contribution (β)
LCV plot
GCV plot
Sensitivity
analysis
Sensitivity
analysis
Repeat
Repeat
x
ŷ
β
x
β
CONTRIBUTION-VALUE PLOTS
Automatic acceptance of
car insurance applications
AUTOMATIC INSURANCE ACCEPTANCE
How?
Strategy A
Strategy B
The basic principle
AUTOMATIC INSURANCE ACCEPTANCE
| ID | Name | Age | Sex | Product | Branch | ... |
|---|---|---|---|---|---|---|
| 1 | 💤 | 💤 | 💤 | 🔥 | 💤 | ... |
| 2 | 🔥 | 💤 | 💤 | 💤 | 🔥 | ... |
| 3 | 💤 | 🔥 | 💤 | 🔥 | 🔥 | ... |
| ... | ... | ... | ... | ... | ... | ... |
| ID | Name | Age | Sex | Product | Branch | ... |
|---|---|---|---|---|---|---|
| 1 | Alice | 28 | F | Health | Zekur | ... |
| 2 | Bob | 57 | M | Car | FBTO | ... |
| 3 | Chad | 34 | M | Life | Intrpls | ... |
| ... | ... | ... | ... | ... | ... | ... |
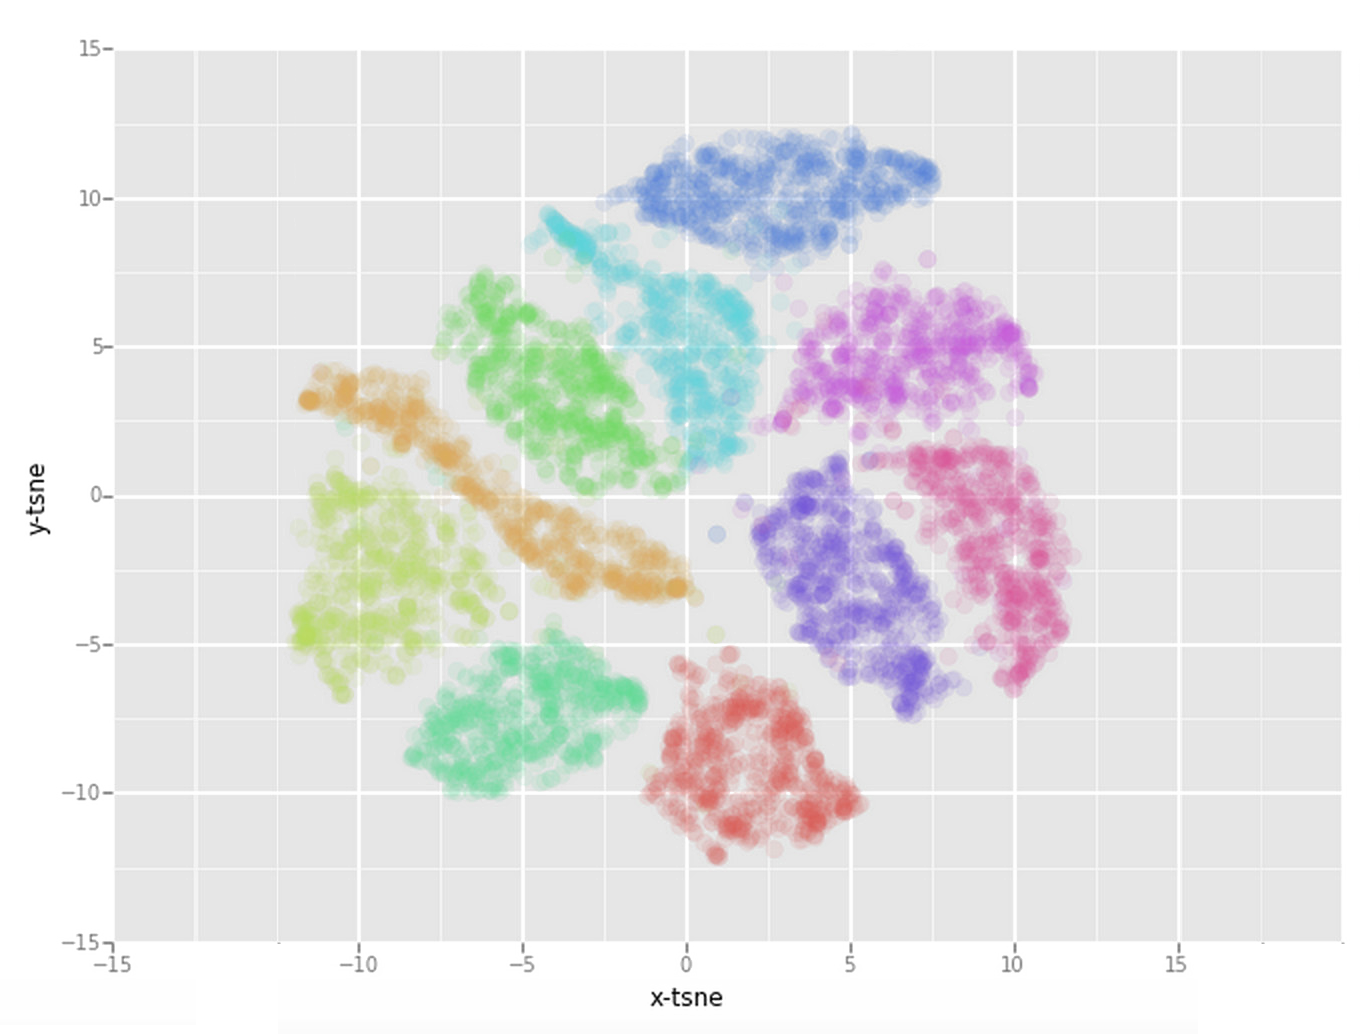
2D projection
StrategyMap
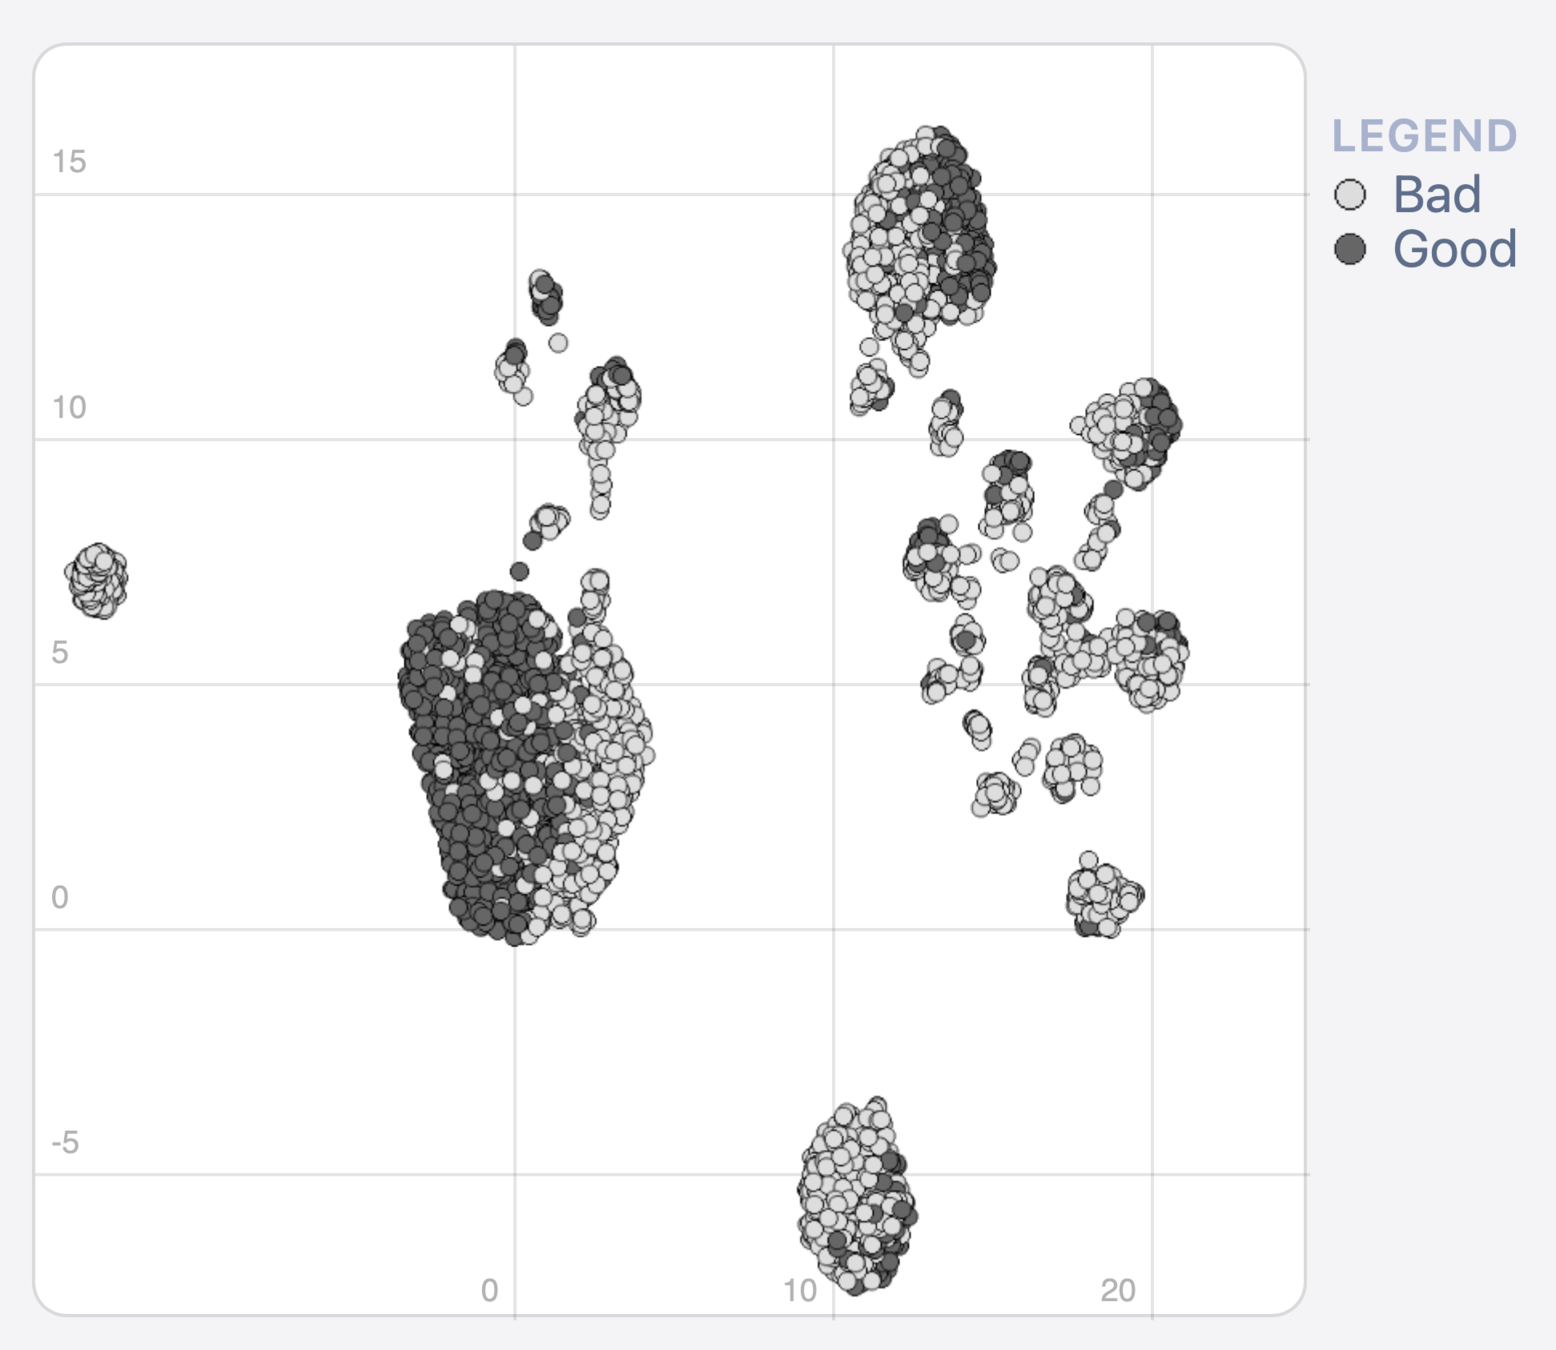
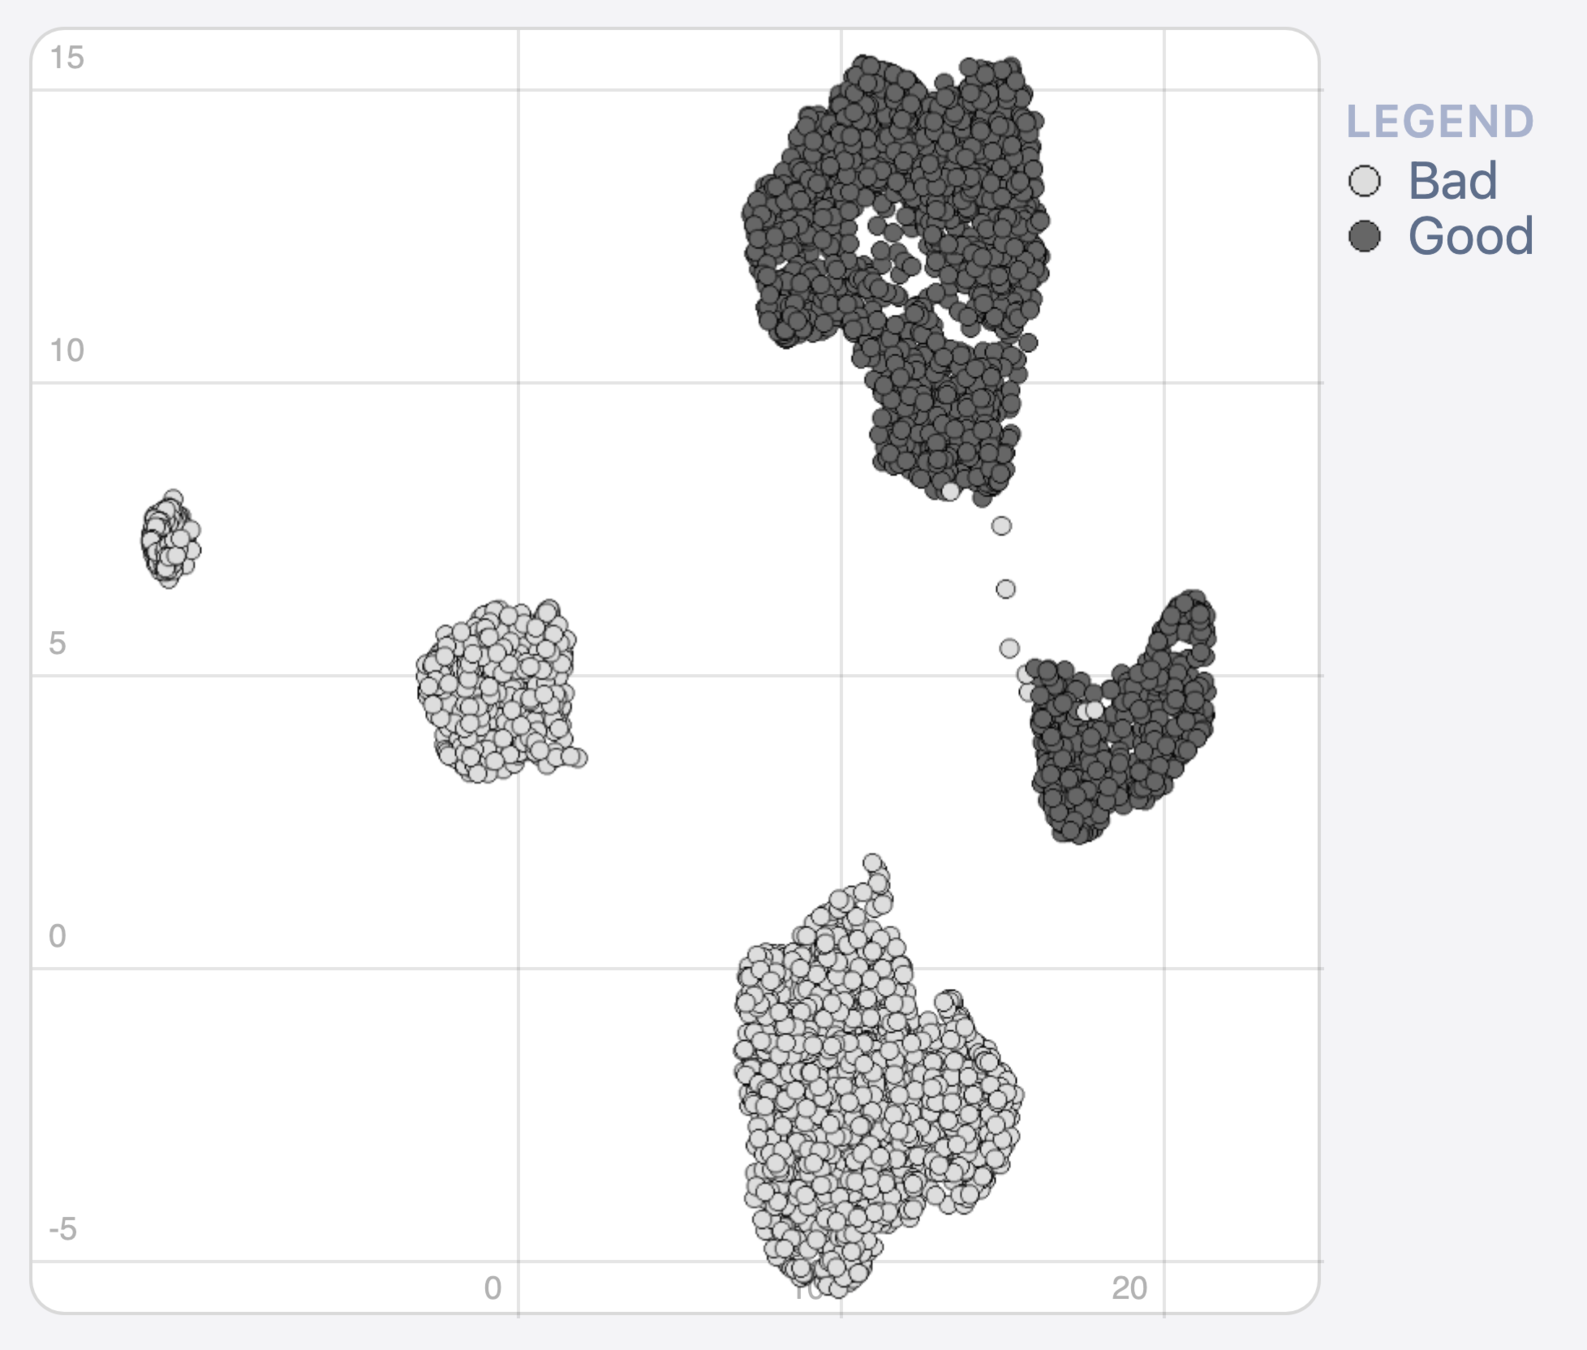
feature contribution (LIME)
How?
The basic principle
AUTOMATIC INSURANCE ACCEPTANCE
My solution
AUTOMATIC INSURANCE ACCEPTANCE

Data scientists happy! 🎉
AUTOMATIC INSURANCE ACCEPTANCE
Anywhere where tabular data is used.
Any model in Python or PMML.
- Schade en Inkomen (Team Wouter Slot)
- Discussing operationalization
Applications
AUTOMATIC INSURANCE ACCEPTANCE
Paper submitted to:
IEEE VIS 2021
@
New Orleans, LA, USA
AUTOMATIC INSURANCE ACCEPTANCE
ExplainExplore
CV Plots
Global
Instance-level
Fraud Dashboard
StrategyAtlas
Conclusion
Any questions?
More info at
explaining.ml
VISxAI Achmea + Ortec
By iamdecode


