


Ivan Leon
Software Developer
Introduction to
and
?
  ivanleon@ilg40: ~ $ pip3 show pandas
  Name: pandas
  Version: 0.23.4
  Summary: Powerful data structures for data analysis, time series, and statistics
  Home-page: http://pandas.pydata.org
  Author: None
  Author-email: None
  License: BSD
  Location: /usr/local/lib/python3.5/dist-packages
  Requires: pytz, numpy, python-dateutil
  Required-by:

  ivanleon@ilg40: ~ $ pip3 show matplotlib
  Name: matplotlib
  Version: 3.0.2
  Summary: Python plotting package
  Home-page: http://matplotlib.org
  Author: John D. Hunter, Michael Droettboom
  Author-email: matplotlib-users@python.org
  License: BSD
  Location: /usr/local/lib/python3.5/dist-packages
  Requires: cycler, python-dateutil, pyparsing, numpy, kiwisolver
  Required-by:
import numpy as np
  >>> numbers = []
  >>>
  >>> for i in range(0, 11):
  ...     numbers.append(i)
  ...
  >>> numbers
  [0, 1, 2, 3, 4, 5, 6, 7, 8, 9, 10]


  >>> numbers_2 = [n for n in range(0, 11)]
  >>>
  >>> numbers_2
  [0, 1, 2, 3, 4, 5, 6, 7, 8, 9, 10]


  >>> numbers_3 = np.arange(0, 11)
  >>>
  >>> numbers_3
  array([ 0,  1,  2,  3,  4,  5,  6,  7,  8,  9, 10])
  >>>
  >>> list(numbers_3)
  [0, 1, 2, 3, 4, 5, 6, 7, 8, 9, 10]
  >>> l1 = [1, 1, 1, 1]
  >>> l2 = [2, 2, 2, 2]
  >>> l1 + l2
  [1, 1, 1, 1, 2, 2, 2, 2]


  >>> l1 = [1, 1, 1, 1]
  >>> l2 = [2, 2, 2, 2]
  >>> l3 = []
  >>> for i, j in zip(l1, l2):
  ...     l3.append(i + j)
  ...
  >>> l3
  [3, 3, 3, 3]

  >>> a1 = np.array(l1)
  >>> a2 = np.array(l2)
  >>> a1 + a2
  array([3, 3, 3, 3])
  >>> a3 = list(a1 + a2)
  >>> a3
  [3, 3, 3, 3]
>>> l3
[3, 3, 3, 3]
>>> l3 * 3
[3, 3, 3, 3, 3, 3, 3, 3, 3, 3, 3, 3]

>>>
>>> result = [n*3 for n in l3]
>>> result
[9, 9, 9, 9]

>>> result_2 * 3
array([9, 9, 9, 9])
>>>
>>> list(result_2 * 3)
[9, 9, 9, 9]
  $ cat sample_countries_gdp.py

  import pandas as pd

  ds = {
        2016: [3.4, 1.6, 2.9, 3.6],
        2017: [3.6, 1.7, 2.7, 3.4],
        2018: [3.9, 1.5, 2.9, 3.3]
  }

  countries = ["Norway", "India", "Argentina", "China"]

  df = pd.DataFrame(ds, index=countries)

  print("\n", df)
Pandas - DataFrame
  $ python3 sample_countries_gdp.py

             2016  2017  2018
  Australia   3.4   3.6   3.9
  India       1.6   1.7   1.5
  Argentina   2.9   2.7   2.9
  China       3.6   3.4   3.3
Pandas - DataFrame
  $ cat it_companies.csv
  IBM,3.6,3.2,3.5
  Microsoft,3.4, 3.5,3.4
  Apple,2.8,3.9,3.7
  HP,3.8,3.3,3.7
Pandas - DataFrames
  $ cat read_csv.py

  import pandas as pd

  df = pd.read_csv("it_companies.csv", header=None)

  print(df)
Pandas - DataFrames
  $ python3 read_csv.py
             0    1    2    3
  0        IBM  3.6  3.2  3.5
  1  Microsoft  3.4  3.5  3.4
  2      Apple  2.8  3.9  3.7
  3         HP  3.8  3.3  3.7
Pandas - DataFrames
  ### Before ######################################

             0    1    2    3
  0        IBM  3.6  3.2  3.5
  1  Microsoft  3.4  3.5  3.4
  2      Apple  2.8  3.9  3.7
  3         HP  3.8  3.3  3.7
  #################################################

  import pandas as pd

  df = pd.read_csv("it_companies.csv", header=None) <------- reading .CSV
  new_index = list(df[0])
  new_columns = [2016, 2017, 2018]
  del df[0]
  df.columns = new_columns
  df.index = new_index
  print(df)


  ### After ######################################

             2016  2017  2018
  IBM         3.6   3.2   3.5
  Microsoft   3.4   3.5   3.4
  Apple       2.8   3.9   3.7
  HP          3.8   3.3   3.7
  ################################################
Pandas - DataFrames
  ### After ######################################
             2016  2017  2018
  IBM         3.6   3.2   3.5
  Microsoft   3.4   3.5   3.4
  Apple       2.8   3.9   3.7
  HP          3.8   3.3   3.7
  ################################################

  import pandas as pd

  df = pd.read_csv("it_companies.csv", header=None) <------- reading .CSV
  new_index = list(df[0])
  new_columns = [2016, 2017, 2018]
  del df[0]
  df.columns = new_columns
  df.index = new_index
  df.at['IBM', 2018] = 6.9
  df.at['Microsoft', 2018] = 2.8
  df.to_csv("it_companies_new.csv", header=None)    <------- saving to new .CSV
  print(df)

  ### After ######################################
             2016  2017  2018
  IBM         3.6   3.2   6.9
  Microsoft   3.4   3.5   2.8
  Apple       2.8   3.9   3.7
  HP          3.8   3.3   3.7
  ################################################
Pandas - DataFrames
Pandas - DataFrames
Pandas - DataFrames
>>> df.head()
     CLAVE CT NOM TURNO     NOMBRE CT    ... REPROBACIÓN CON REGULARIZADOS EFICIENCIA TER..
0  14DJN0128O  MATUTINO   JUAN DE LAR..  ...           N.A.                N.A.
1  14DJN0129N  MATUTINO   JOSEFA DOMI..  ...           N.A.                N.A.
2  14DJN0130C  MATUTINO   ROSAURA ZAP..  ...           N.A.                N.A.q
3  14DJN0132A  MATUTINO   UNIDAD MODE..  ...           N.A.                N.A.
4  14DJN0133Z  MATUTINO   CIPRIANA GU..  ...           N.A.                N.A.
....

[14018 rows x 17 columns]


>>> df.columns
Index(['CLAVE CT', 'NOM TURNO', 'NOMBRE CT', 'DOMICILIO', 'LOCALIDAD INEGI',
       'NOMBRE LOCALIDAD', 'COLONIA', 'NOMBRE COLONIA',
       'MUNICIPIO CLAVE INEGI', 'NOMBRE MUNICIPIO', 'SOSTENIMIENTO', 'NIVEL',
       'PROGRAMA', 'DESERCIÓN INTRACURRICULAR', 'REPROBACIÓN',
       'REPROBACIÓN CON REGULARIZADOS', 'EFICIENCIA TERMINAL'],
      dtype='object')
Pandas - DataFrames
  >>> df["DESERCIÓN INTRACURRICULAR"].head()
  0    N.A.
  1    N.A.
  2    N.A.
  3    N.A.
  4    N.A.
  Name: DESERCIÓN INTRACURRICULAR, dtype: object

  >>> df["DESERCIÓN INTRACURRICULAR"].tail()
  14013    0.00%
  14014    0.00%
  14015    0.00%
  14016    0.00%
  14017    0.00%
  Name: DESERCIÓN INTRACURRICULAR, dtype: object
Pandas - DataFrames
  >>> dic_matutino = df.loc[df['NOM TURNO'] == "MATUTINO"]["DESERCIÓN INTRACURRICULAR"]
  >>> dic_matutino = [float(d.strip("%")) for d in dic_matutino if d != "N.A."]
  >>> dic_matutino_med = pd.Series(dic_matutino).mean()
  >>> dic_matutino
  3.420325159914712

  >>> dic_vespertino = df.loc[df['NOM TURNO'] == "VESPERTINO"]["DESERCIÓN INTRACURRICULAR"]
  >>> dic_vespertino = [float(d.strip("%")) for d in dic_vespertino if d != "N.A."]
  >>> dic_vespertino = pd.Series(dic_vespertino).mean()
  >>> dic_vespertino
  5.200691310609698

  >>>
  >>> dic_nocturno = df.loc[df['NOM TURNO'] == "NOCTURNO"]["DESERCIÓN INTRACURRICULAR"]
  >>> dic_nocturno = [float(d.strip("%")) for d in dic_nocturno if d != "N.A."]
  >>> dic_nocturno = pd.Series(dic_nocturno).mean()
  >>> dic_nocturno
  16.28141176470588
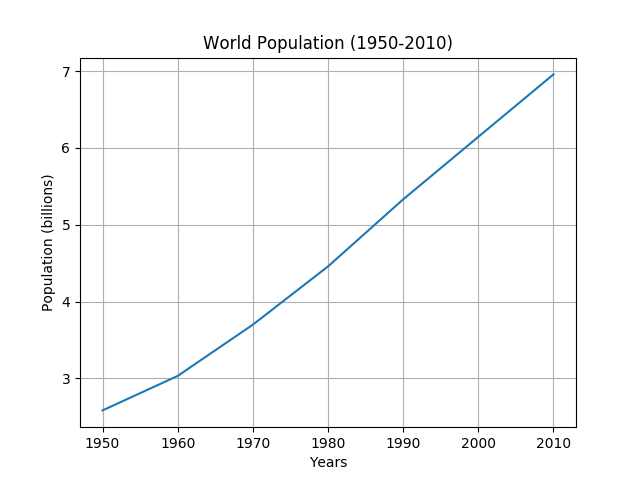
  import matplotlib.pyplot as plt

  years = [1950, 1960, 1970, 1980, 1990, 2000, 2010]
  population = [2.584, 3.033, 3.700, 4.458, 5.331, 6.145, 6.958]

  plt.plot(years, population)

  plt.grid()
  plt.title("World Population (1950-2010)")
  plt.xlabel("Years")
  plt.ylabel("Population (billions)")

  plt.show()
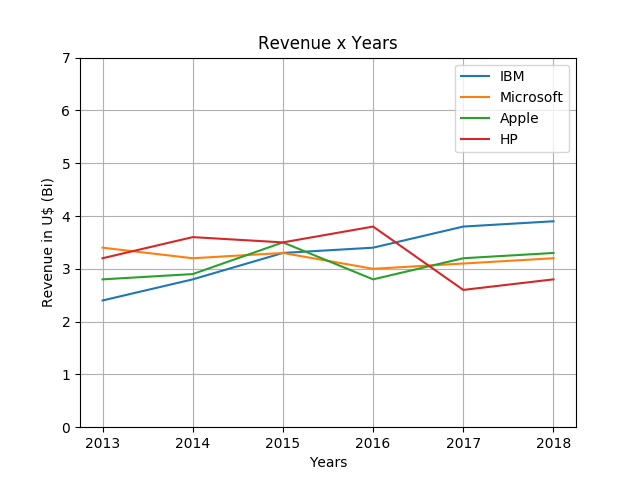
  import matplotlib.pyplot as plt
  import pandas as pd

  df = pd.read_csv("it_companies.csv", header=None)

  new_index = list(df[0])
  new_columns = [2013, 2014, 2015, 2016, 2017, 2018]
  del df[0]
  df.columns = new_columns
  df.index = new_index

  plt.plot(df.columns, df.iloc[0], label="IBM")
  plt.plot(df.columns, df.iloc[1], label="Microsoft")
  plt.plot(df.columns, df.iloc[2], label="Apple")
  plt.plot(df.columns, df.iloc[3], label="HP")

  plt.ylim(0, 7)
  plt.xlabel("Years")
  plt.ylabel("Revenue in U$ (Bi)")
  plt.title("Revenue x Years")
  plt.legend()
  plt.grid()

  plt.savefig('plot.png')
plt.show() Profile
https://xalapacode.com/directorio/ivanleoncz/
https://github.com/ivanlmj
https://stackoverflow.com/users/5780109/ivanleoncz?tab=profile
By Ivan Leon
Key concepts, techniques and importance of both tools.


