d3.js
data-driven documents
an introduction to
ivan loughman-pawelko
- A Javascript library for manipulating the DOM based on data
- Declarative and (usually) readable syntax
- Data is bound to DOM elements and used to control them
- Exceptional control over how the DOM transitions when the data changes
Data Driven Documents
<script src="//d3js.org/d3.v3.min.js" charset="utf-8"></script>d3 is not...
- good with old browsers and doesn't try to be
- a web map api
- the solution to uninformative data
(in some ways it may make it worse)
d3.selectAll('div')
    .text("Little we see in Nature that is ours")
    .style("color","magenta")
    .classed("thatClass", true)
    .on("click", function(){
        // do something
        console.log("now what?")
    });
var div = document.querySelector('div')
div.textContent = "Little we see in Nature that is ours";
div.style.color = "magenta";
div.classList.add("thatClass");
div.addEventListener('click', function(){
alert("now what?")
});Selections
d3
just Javascript
var poem = ["Once in a golden hour",
    "I cast to earth a seed.",
    "Up there came a flower,",
    "The people said, a weed."
];

d3.selectAll('.line')
   .data(poem)
   .text(function(d,i){
       return "Line (" + i + "): " + d;
   })
   .style("color", function(d,i){
       if(d.indexOf("flower") > -1){
           return "magenta";
       }
   });
<h2 class="line">Line</h2>
<h2 class="line">Line</h2>
<h2 class="line">Line</h2>
<h2 class="line">Line</h2>Data Binding
var poem = ["Once in a golden hour",
    "I cast to earth a seed.",
    "Up there came a flower,",
    "The people said, a weed."
];

d3.selectAll('.line')
var poem = ["Once in a golden hour",
"I cast to earth a seed.",
"Up there came a flower,",
"The people said, a weed."
];
d3.selectAll('.line')
.data(poem) Appending to the DOM
var width = 600;
var height = 300;

var svg = d3.select(".graphic")
            .append("svg")
            .attr("width", width)
            .attr("height", height);
<body>
<div class="graphic"></div>
</body>SVG
- specifications for creating two dimensional vector graphics
<div class="graphic">
    <svg>
        <rect></rect>
        <circle></circle>
        <elipse></elipse>
        <path></path>
        <g></g>
    </svg>
</div>
var dataset = [{letter:"A", value:1},
            {letter:"B", value:3},
            {letter:"C", value:3},
            {letter:"D", value:2},
            ...
            {letter:"Y", value:4},
            {letter:"Z", value:10}]
svg.selectAll('rect')
.data(dataset)
.enter().append('rect')
.attr('class','bar')
svg.selectAll("rect")
    .data(dataset)
    .enter().append("rect")
    .attr("class","bar")
    .attr("x", "20px")
    .attr("y", function(d,i) {
        return yScale(d.letter);
    })
    .attr("width", function(d,i){
        return xScale(d.value);
    })
    .attr("height", "10px")
    .attr("fill", function(d) {
        return "rgb(0,"+(d.value*30)+
                ", " + (d.value * 50) + ")";
    });

Appending with Data
var yScale = d3.scale.ordinal()
                .domain(dataset.map(function(d){return d.letter}))
                .rangeRoundBands([0, height], 0.2)
Scales
\{A, B, C, ... , Z\} \to \{0, 23, 46, ..., 574, 600\}
{A,B,C,...,Z}→{0,23,46,...,574,600}
var xScale = d3.scale.linear()
                .domain([0, d3.max(dataset,function(d){return d.value})])
                .range([0,width])
\text{width} = 60*\text{d.letter}
width=60∗d.letter
Linear
Ordinal
Transitions
- selections where the operators apply smoothly over time
- attributes and styles are interpolated between values
- easing functions, durations, and delays control interpolation
    var circle = svg.append('circle')
        .attr('cx', 20)
        .attr('cy', 20)
        .attr('r', 10)

    circle.on('click', function(){
        d3.select(this)
        .transition()
        .duration(3000)
        .delay(1000)
        .ease('linear')
        .attr('cx', 150)
        .attr('cy', 150)
        .attr('r', 20)
        .style('fill', 'red')
    })


    var x = 4;
Selections and Filtering
var subset = dataset.filter(
    function(datum){return vowels.indexOf(datum.letter) > -1}
);
// update subset
selection.transition()
.duration(2000)
.attr('width', function(d,i){
return xScale(d.value);
})
.attr('y', function(d,i){
return yScale(d.letter);
});// remove unwanted elements
selection.exit()
.transition()
.duration(2000)
.attr('width', '0px')
.remove();// selection from subset
var selection = svg.selectAll('rect')
.data(subset, function(d){
return d.letter;
});
selection.transition();yScale.domain(
dataset.sort(function(a,b){return b.value-a.value})
.map(function(d){return d.letter})
)
svg.selectAll('rect')
    .transition()
    .duration(2000)
    .delay(function(d,i){
        return i*100
    })
    .attr('y', function(d,i){
        return yScale(d.letter)
    })
Sorting
d3 + angular
angular.module('d3Angular').directive('barChart', function(){
	return {
		restrict: 'E',
		template: '<svg></svg>',
		scope: {data: '=chartData'},
		link: function(scope,elem,attr){
                    // d3 stuff here
		}
	}
});
angular.module('d3Angular', [])<!DOCTYPE html>
<html>
<head>
<script src="angular.min.js"></script>
<script src="d3.min.js"></script>
<script src="app.js"></script>
</head>
<body ng-app="d3Angular">
<div ng-controller='data'>
<bar-chart chart-data="chartData"></bar-chart>
</div>
</body>
</html>d3 directives
//d3 stuff here
// define svg + scales
...

// create chart
svg.selectAll("rect")
    .data(scope.data)
    .enter()
    .append("rect")
    .attr('class','bar')
    .attr("x", function(d, i) {
        return xScale(i);
    })
    .attr("y", function(d) {
        return height - yScale(d);
    })
    .attr("width", xScale.rangeBand())
    .attr("height", function(d) {
        return yScale(d);
    })
    .attr("fill", function(d) {
        return "rgb(" + (d * 10) + ",0,0)";
    });
angular.module('d3Angular').controller('data', function($scope) {
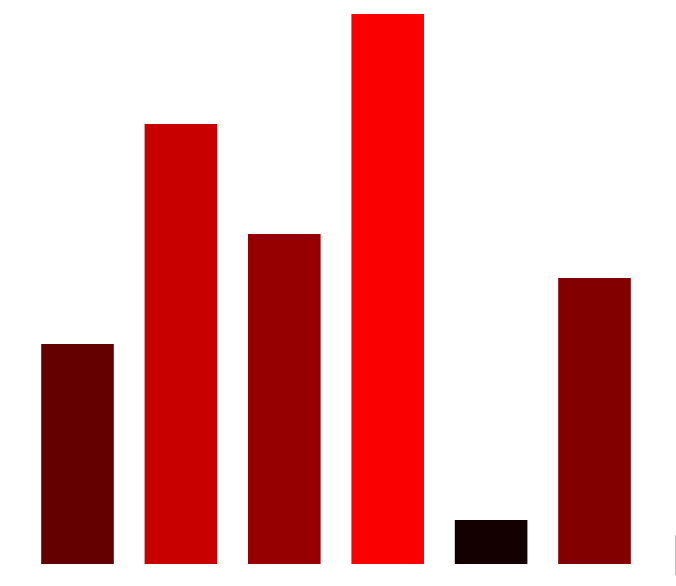
$scope.chartData = [5,9,7,12,2,6];
});
<!DOCTYPE html>
<html>
    <head>
        <script src="/bower_components/angular/angular.min.js"></script>
        <script src="d3.min.js"></script>
        <script src="app.js"></script>
    </head>
    <body ng-app="d3Angular">
      <div ng-controller='data'>
        <bar-chart chart-data="chartData"></bar-chart>
        <input type="text" ng-model="newChartData">
        <button ng-click="update()">Draw Chart</button>
      </div>
    </body>
</html>
angular.module('d3Angular').controller('data', function($scope) {
$scope.chartData = [0]; // this could be avoided but I'm lazy
$scope.update = function(){
$scope.chartData = $scope.newChartData.split(',')
.map(function(e){return +e})
}
});updating
var drawChart = function(){
	xScale.domain(d3.range(scope.data.length));
	yScale.domain([0,d3.max(scope.data)]);
        // update existing data
	var bars = svg.selectAll('rect')
	    .data(scope.data);
        // remove old data
	bars.exit().remove();
        // append new data
	bars.enter().append('rect')
	        .attr("x", width)
	        .attr("y", function(d) {
	            return height - yScale(d);
	        })
	        .attr("width", xScale.rangeBand())
	        .attr("height", function(d) {
	            return yScale(d);
	        })
	        .attr("fill", function(d) {
	            return "rgb(" + (d * 10) + ",0,0)";
	        });
        // define transition
        // ...
}
scope.$watch('data', function(newValue,oldValue){
scope.data = newValue;
drawChart()
})thanks
deck
By Ivan Loughman-Pawelko
deck
- 1,679


