Minor Rants and Advice on Monitoring
Ivan Topolnjak | @ivantopo | Core Team @ Kamon | Co-Founder @ Kamino

Typical Conversation
Questions I ask to people when they brag about their systems:
What volume are we talking about?
What response times are you seeing there?
Is it like that all the time?
Do you even monitor?
The Monitoring Tripod Trinity
- Logs
- Metrics
- Tracing
Create a small plan
What is important for you?
(Uptime, Latency, Error Rates)
Keep it simple
Express your Service Level Objectives Properly
Use 9's for availability
Use percentiles for Latency
Example SLO for Uptime
98 % => 28 minutes / day
99 % => 14 minutes / day
99.9 % => 1 minute, 26 seconds / day
99.99 % => 8.6 seconds / day
Example SLO for Latency
50th Percentile <= 50ms
90th Percentile <= 100ms
99th Percentile <= 300ms
Max <= 1 second.
At least read chapters 4 and 6
Never use averages. Never. No. Nope. Nein. Negativo. You'll burn in monitoring hell if you do.
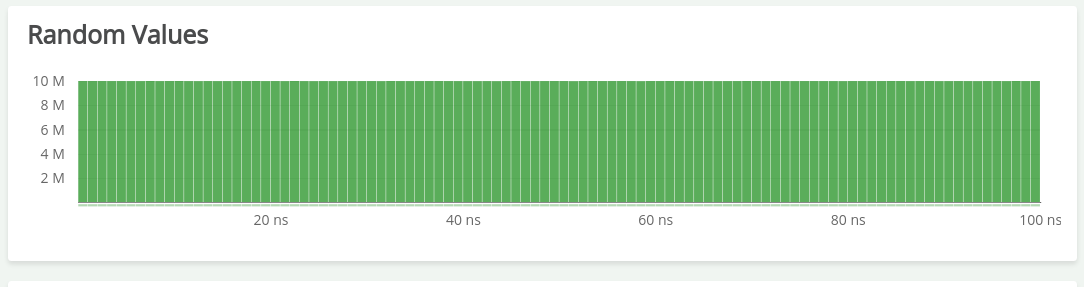
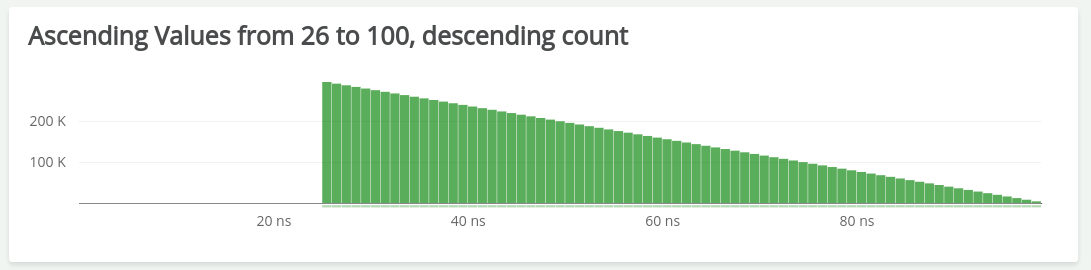
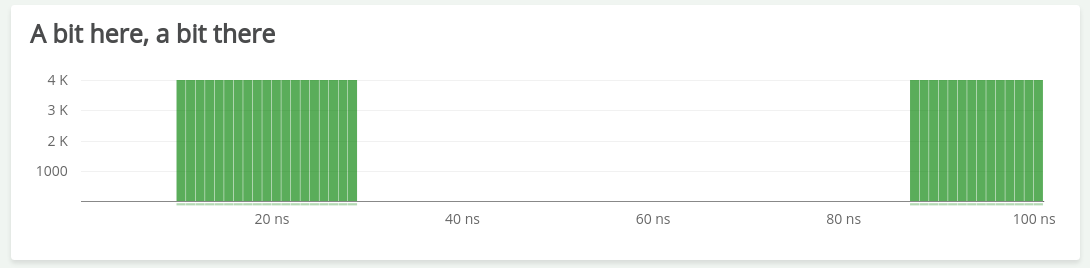
What do they have in common?
What do they have in common?
What do they have in common?
What do they have in common?
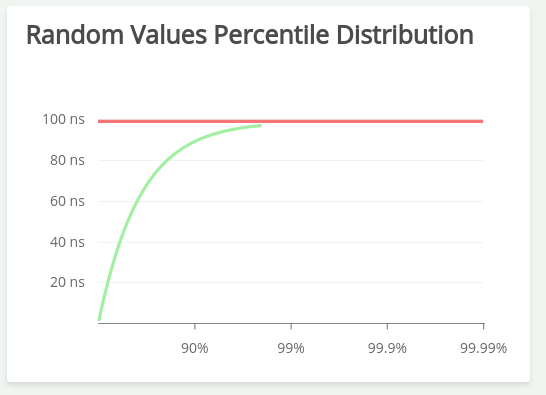
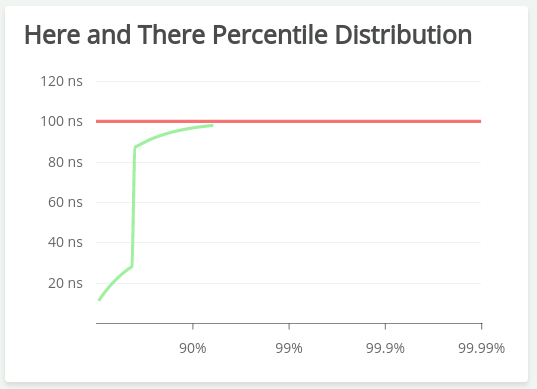
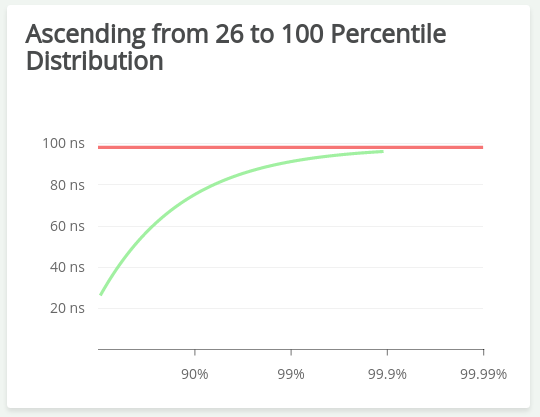
For all of them, the average is ~50 ns
Latency in Real Life
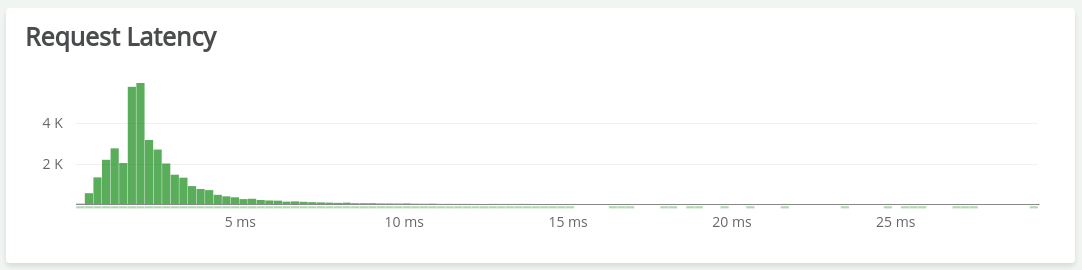
Latency in Real Life
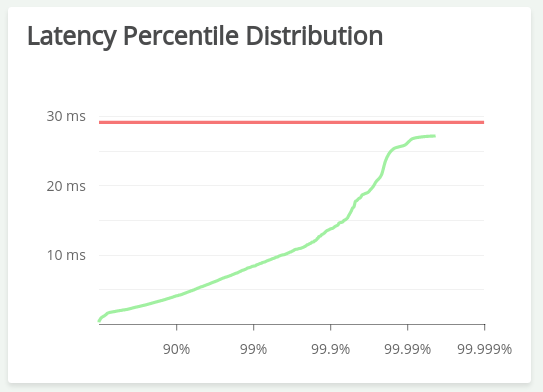
90th Percentile: ~4 ms
99th Percentile: ~8.5 ms
Don't average summaries. Don't lie to yourself. This hell is even worse!
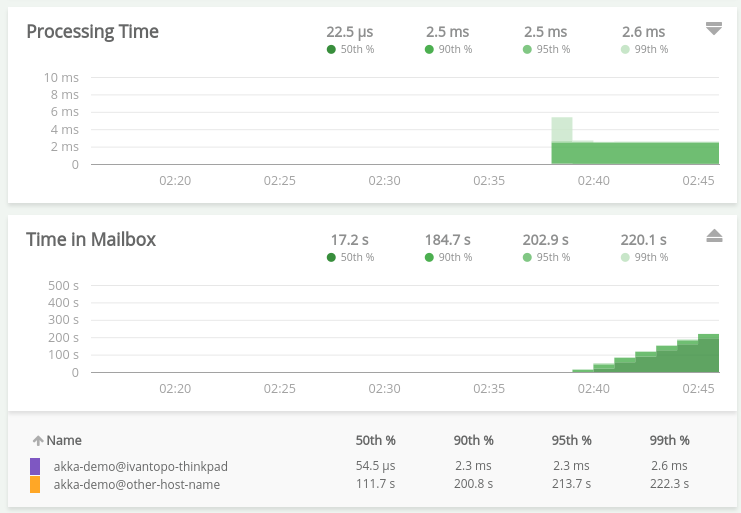
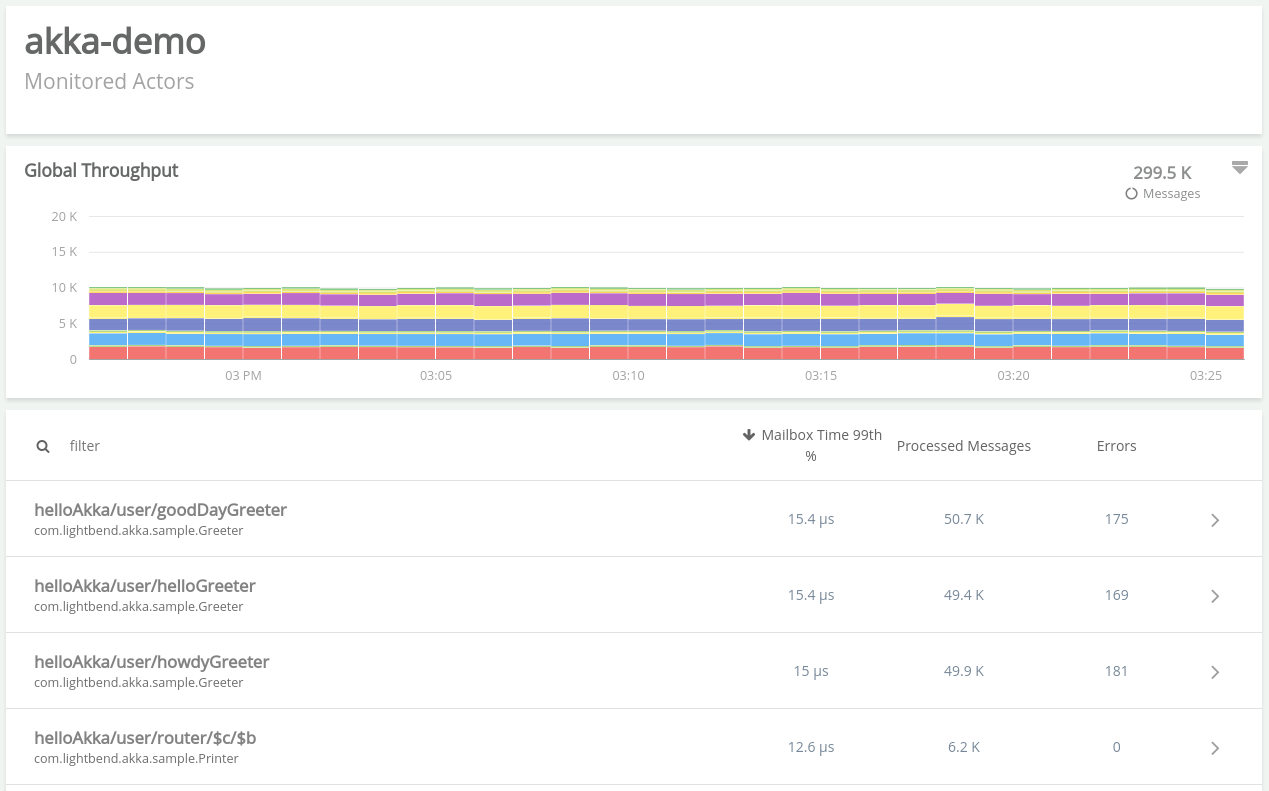
Don't get obsessed about throughput and latency, there is more to see about your app.
Throughput and Latency
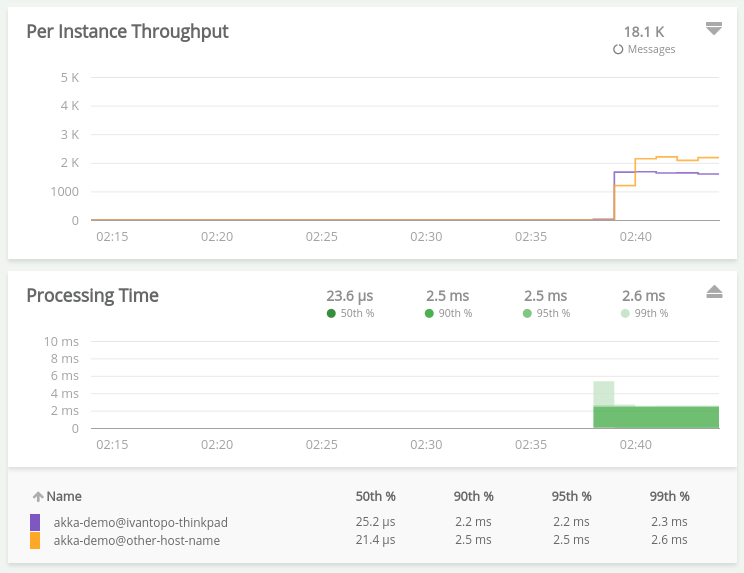
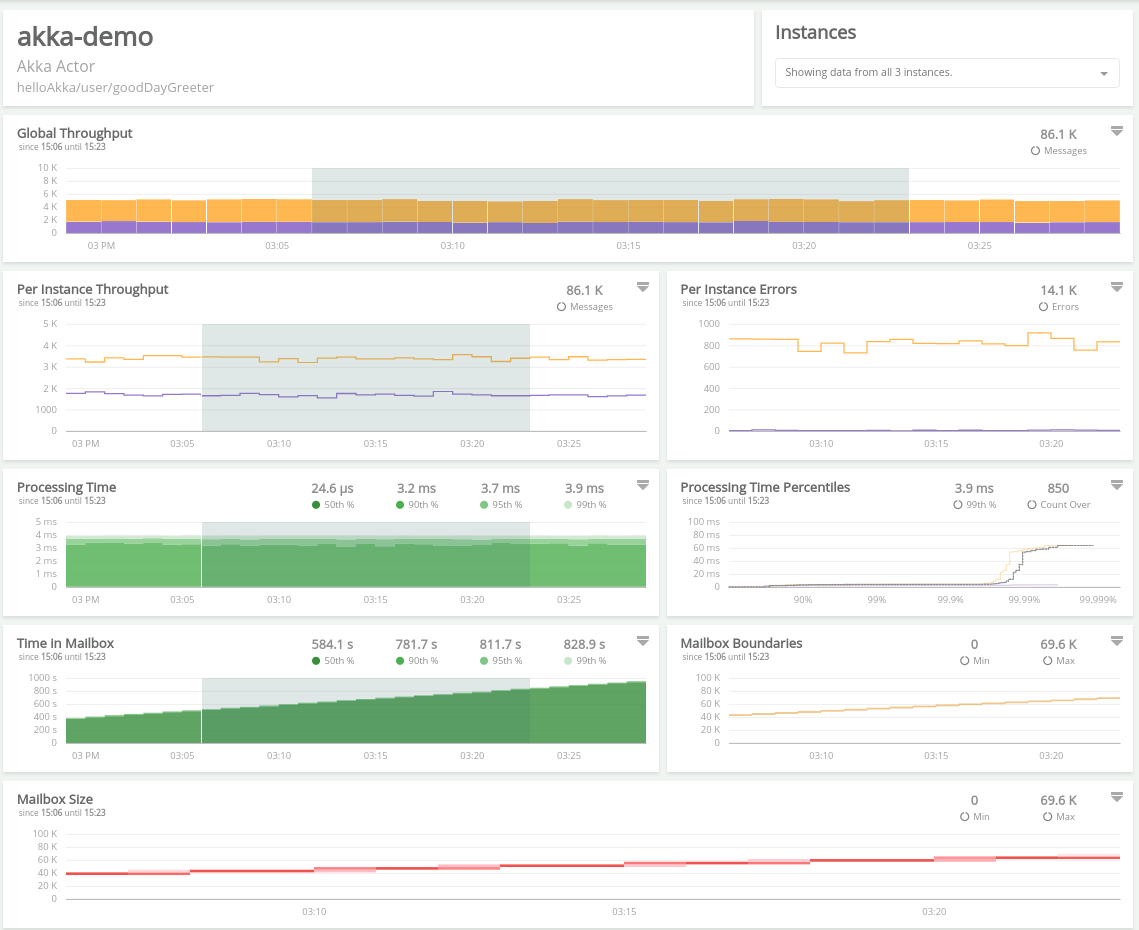
What about Time in Mailbox?
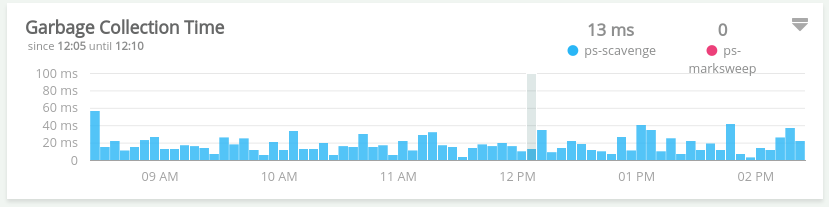
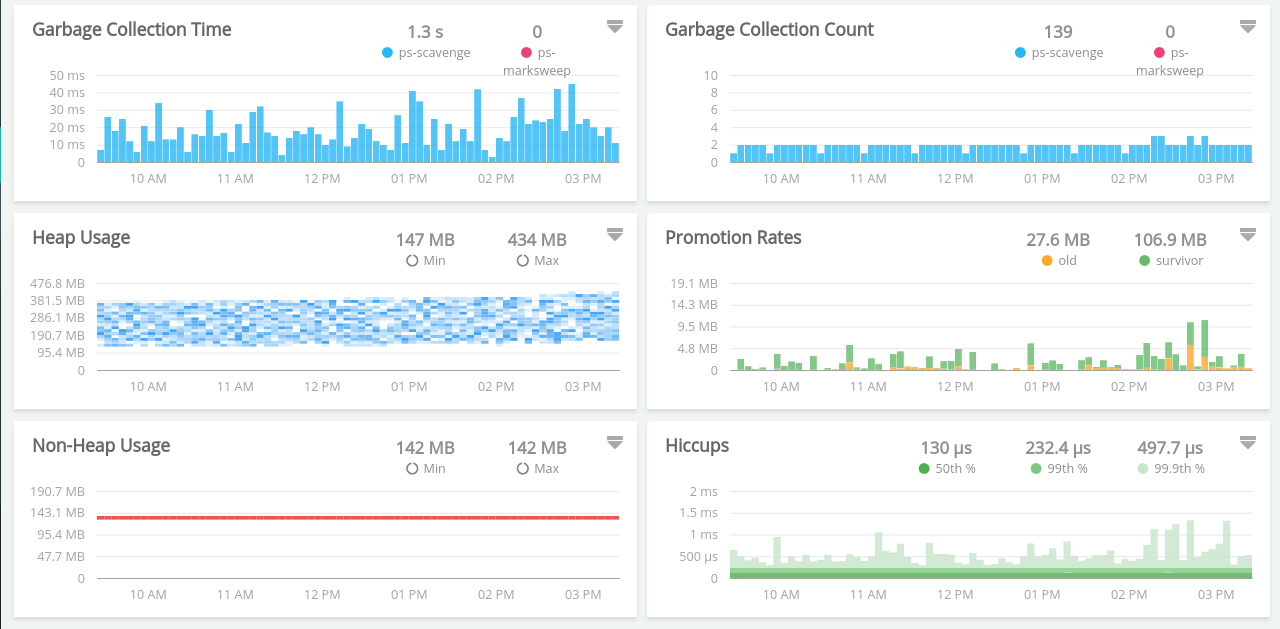
Garbage Collection
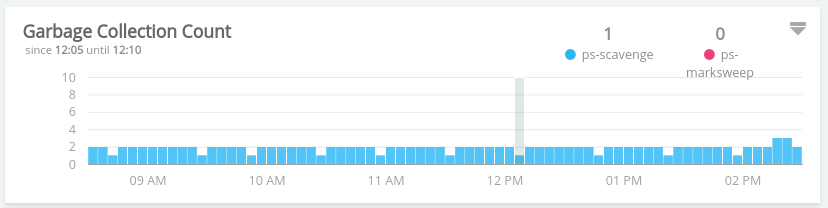
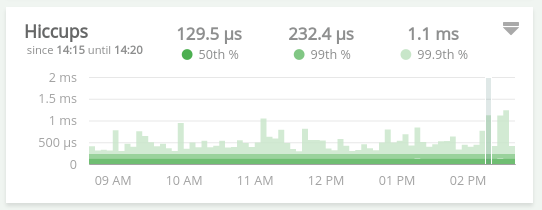
Hiccups
Get to know your tools and be aware of their advantages and limitations.
Take informed decisions, don't just follow the buzz.
Know your tools
  Dropwizard Metric Values
  - min: 0.297 ms
  - median: 2.007 ms
  - 75th percentile: 2.818 ms
  - 95th percentile: 5.308 ms
  - 98th percentile: 7.078 ms
  - 99th percentile: 8.389 ms
  - 99.9th percentile: 11.534 ms
  - 99.99th percentile: 14.156 ms
  - Max: 14.156 ms
Kamon Metric Values
  - min: 0.234 ms
  - median: 2.04 ms
  - 75th percentile: 2.851 ms
  - 95th percentile: 5.439 ms
  - 98th percentile: 7.209 ms
  - 99th percentile: 8.651 ms
  - 99.9th percentile: 14.156 ms
  - 99.99th percentile: 25.821 ms
  - Max: 29.098 ms
Know your tools
Dropwizard Metric Values
  - min: 0.252 ms
  - median: 2.04 ms
  - 75th percentile: 2.867 ms
  - 95th percentile: 4.882 ms
  - 98th percentile: 6.095 ms
  - 99th percentile: 7.209 ms
  - 99.9th percentile: 9.11 ms
  - 99.99th percentile: 9.83 ms
  - Max: 9.83 ms
Kamon Metric Values
  - min: 0.234 ms
  - median: 2.04 ms
  - 75th percentile: 2.851 ms
  - 95th percentile: 5.439 ms
  - 98th percentile: 7.209 ms
  - 99th percentile: 8.651 ms
  - 99.9th percentile: 14.156 ms
  - 99.99th percentile: 25.821 ms
  - Max: 29.098 ms
Accept that your performance intuition sucks. Most of the time.
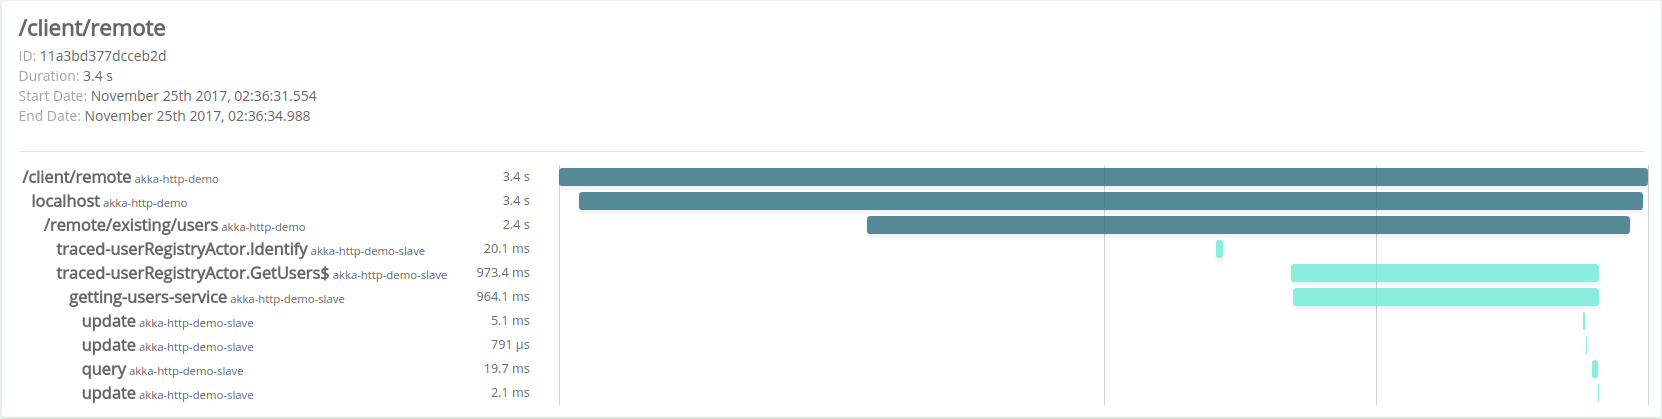
Log with context. Make sure that all logs related to a single request can be identified.
Understand the platform you are running on, specially in the reactive world.
Traditional vs Reactive Model
In the traditional world (looking at you, servlets)
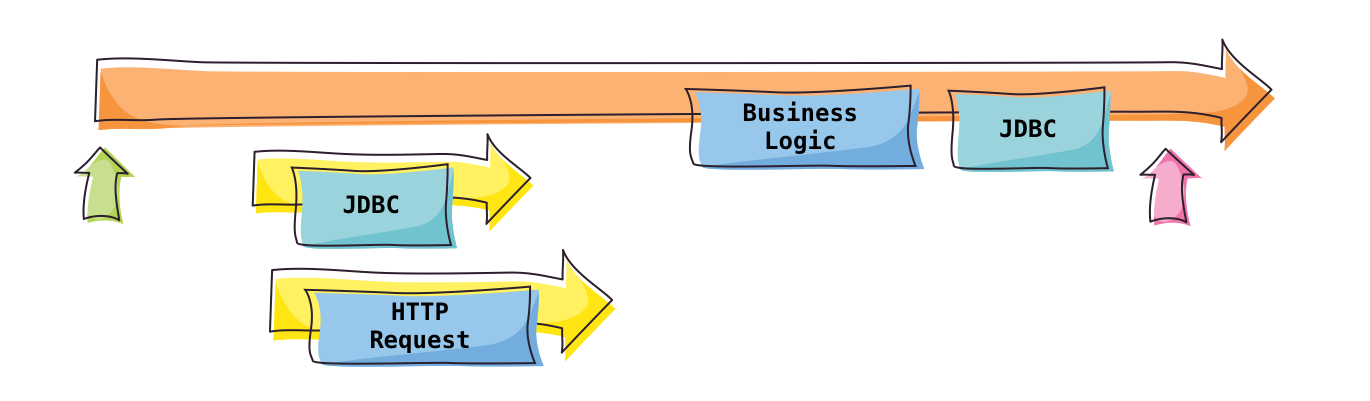
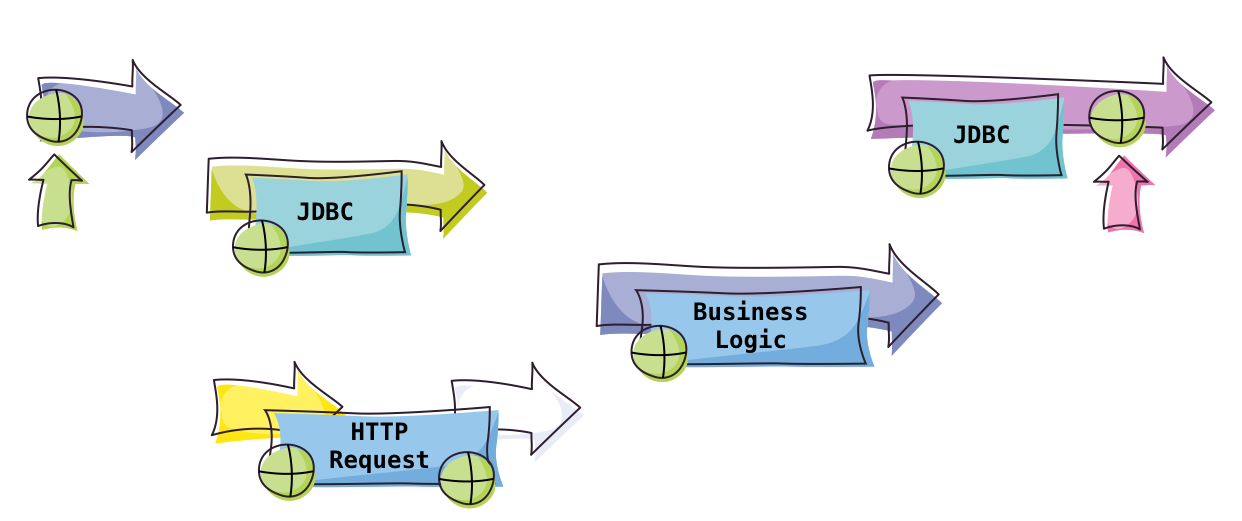
Traditional vs Reactive Model
In the Reactive World
So, How do I Kamon?
Kamon 1.0.0-RC4 is out!
Add Dependencies
// build.sbt

resolvers += Resolver.bintrayRepo("kamon-io", "snapshots")

libraryDependencies ++= Seq(
  "io.kamon" %% "kamon-core" % "1.0.0-RC4",
  "io.kamon" %% "kamon-akka-2.4" % "1.0.0-RC4",
  "io.kamon" %% "kamon-prometheus" % "1.0.0-RC4",
  "io.kamon" %% "kamon-zipkin" % "1.0.0-RC4",
  "io.kamon" %% "kamon-jaeger" % "1.0.0-RC4"
)
Add Configuration
// application.conf
kamon {
  environment {
    service = "kamon-showcase"
  }

  util.filters {
    "akka.tracked-actor" {
      includes = ["application/user/slow*"]
    }

    "akka.tracked-dispatcher" {
      includes = ["**"]
    }

    "akka.traced-actor" {
      includes = ["**"]
    }
  }
}
Start the Reporters
Kamon.addReporter(new PrometheusReporter())
Kamon.addReporter(new ZipkinReporter())

// OR

Kamon.loadReportersFromConfig()
SBT Plugin
// project/plugins.sbt

resolvers += Resolver.bintrayIvyRepo("kamon-io", "sbt-plugins")
addSbtPlugin("io.kamon" % "sbt-aspectj-play-runner" % "1.0.1")
Optional Step
Configure Logback
<configuration>

    <conversionRule conversionWord="traceID" converterClass="kamon.logback.LogbackTraceIDConverter" />


    <appender name="STDOUT" class="ch.qos.logback.core.ConsoleAppender">
        <encoder>
            <pattern>%d{HH:mm:ss.SSS} [%thread] [%traceID] %-5level %logger{36} - %msg%n</pattern>
        </encoder>
    </appender>

    <root level="info">
        <appender-ref ref="STDOUT" />
    </root>
</configuration>
Optional Step
Configure your Prometheus, Grafana, Zipkin/Jaeger
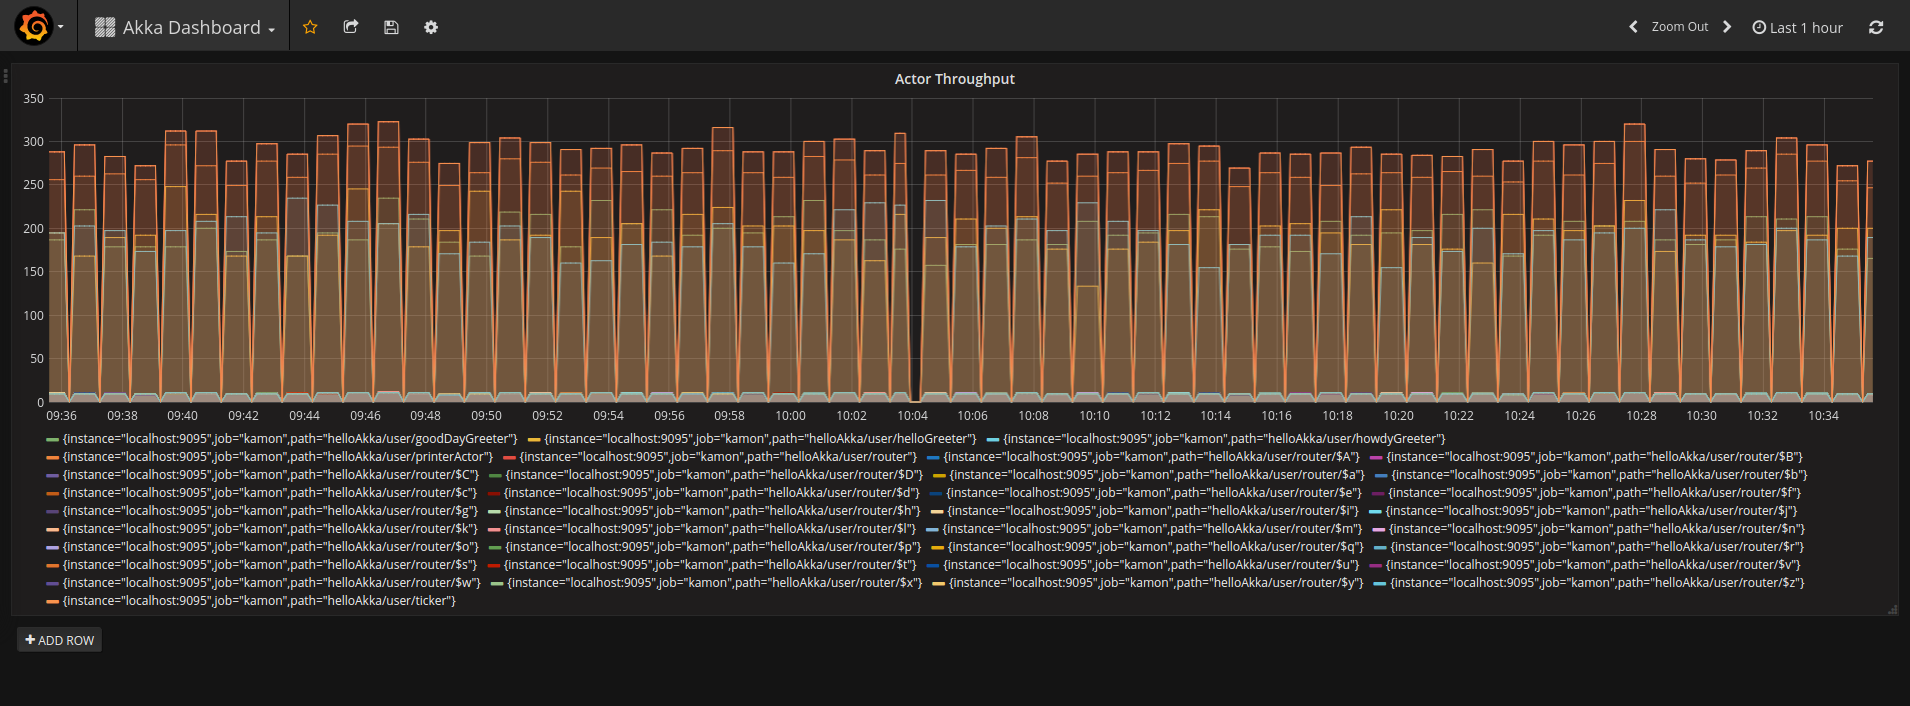
Look at Prometheus
Look at your logs
[info] [3cace0e8c5a4f13d][akka.actor.default-dispatcher-5] c.NonBlockingActor - done at the non-blocking actor.
[info] [7665825824d90893][akka.actor.default-dispatcher-5] HomeController - In the Controller
[info] [7665825824d90893][akka.actor.default-dispatcher-3] HomeController - In the future.map
[info] [0fabed64a3a78776][akka.actor.default-dispatcher-3] HomeController - In the Controller
[info] [0fabed64a3a78776][akka.actor.default-dispatcher-5] HomeController - In the future.map
[info] [26a67a44e184349b][akka.actor.default-dispatcher-3] HomeController - In the Controller
[info] [0fabed64a3a78776][akka.actor.default-dispatcher-2] c.NonBlockingActor - done at the non-blocking actor.
[info] [26a67a44e184349b][akka.actor.default-dispatcher-3] HomeController - In the future.map
[info] [26a67a44e184349b][akka.actor.default-dispatcher-2] c.NonBlockingActor - done at the non-blocking actor.
[info] [7665825824d90893][akka.actor.default-dispatcher-12] c.NonBlockingActor - done at the non-blocking actor.
[info] [96c77b462855dae1][akka.actor.default-dispatcher-2] HomeController - In the Controller
[info] [96c77b462855dae1][akka.actor.default-dispatcher-5] HomeController - In the future.map
[info] [7d4544d88b5f90b2][akka.actor.default-dispatcher-2] HomeController - In the Controller
[info] [96c77b462855dae1][akka.actor.default-dispatcher-2] c.NonBlockingActor - done at the non-blocking actor.
[info] [7d4544d88b5f90b2][akka.actor.default-dispatcher-5] HomeController - In the future.map
[info] [7d4544d88b5f90b2][akka.actor.default-dispatcher-12] c.NonBlockingActor - done at the non-blocking actor.
[info] [0dd690ff92e54334][akka.actor.default-dispatcher-6] HomeController - In the Controller
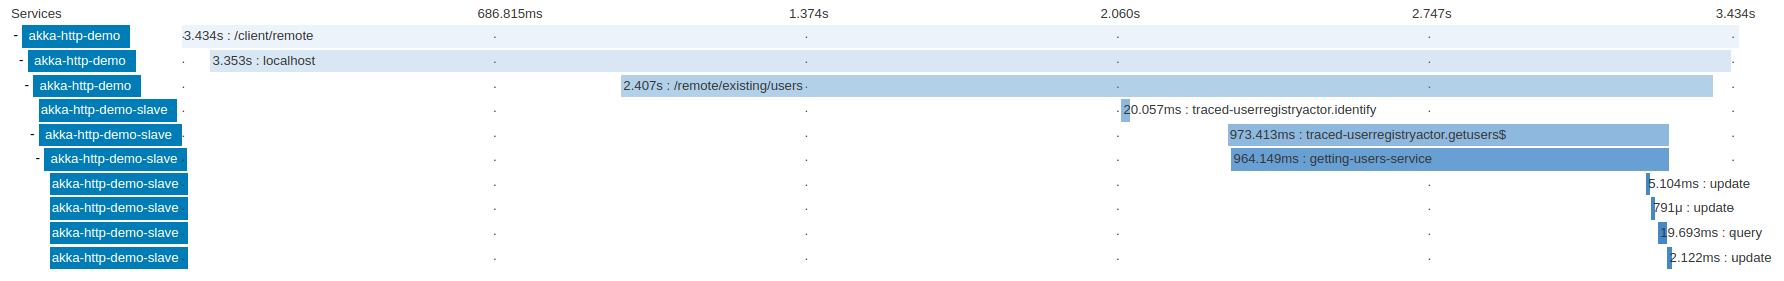
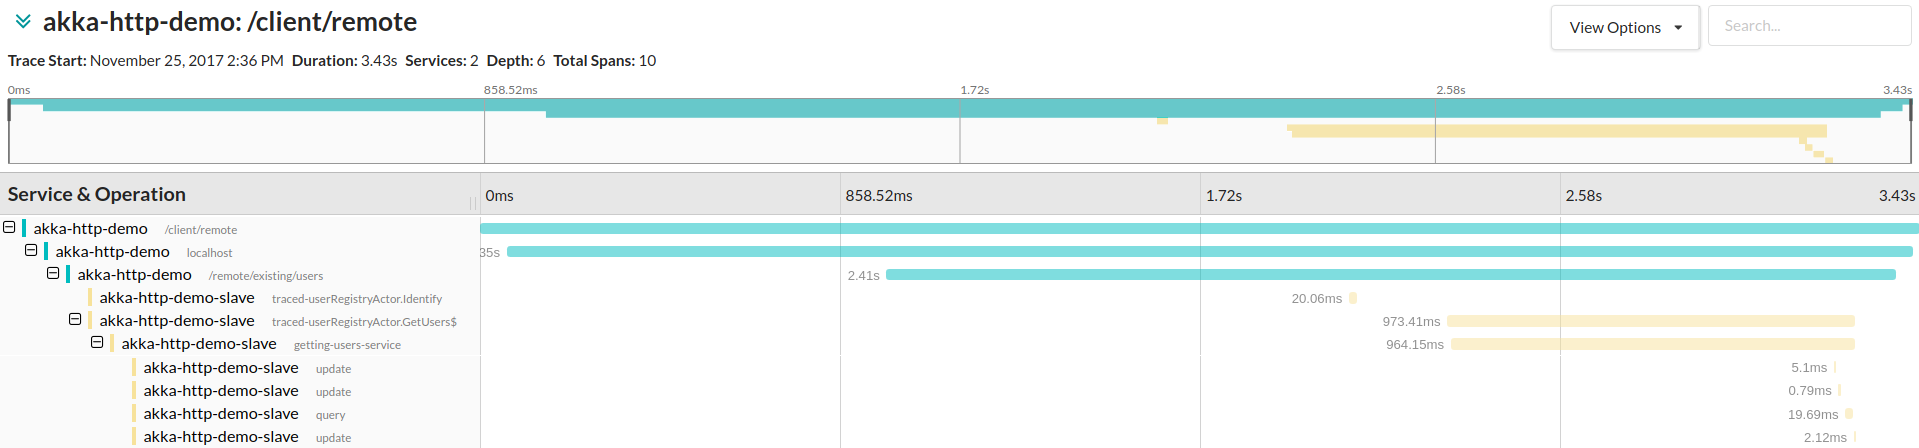
Look at Zipkin
Look at Jaeger
Metrics
Recording Metrics
val processingTime = Kamon.histogram("app.service.processing-time")
processingTime.record(42)


val httpStatusCodes = Kamon.counter("http.response.status")
val serverErrors = httpStatusCodes.refine("code" -> "500")
val clientErrors = httpStatusCodes.refine("code" -> "400")

serverErrors.increment()
clientErrors.increment(100)


// This is the same Histogram, everywhere.
Kamon.histogram("app.service.processing-time").record(42)
Tracing
True Distributed Tracing, finally.
val span = Kamon.buildSpan("my-operation")
    .withTag("span.kind", "server")
    .start()


// Do your stuff here

span.finish()
// You got traces, you got metrics!
Instrument once, report anywhere.
Creating Reporters
// Create your own reporter by implementing MetricReporter or SpanReporter

sealed trait Reporter {
  def start(): Unit
  def stop(): Unit
  def reconfigure(config: Config): Unit
}

trait MetricReporter extends Reporter {
  def reportTickSnapshot(snapshot: TickSnapshot): Unit
}

trait SpanReporter extends Reporter {
  def reportSpans(spans: Seq[FinishedSpan]): Unit
}
Available in 1.0.0-RC4
Akka, Akka HTTP, Akka Remote, Scala, Play, JDBC, System Metrics, Zipkin, Jaeger, Executors, Logback, StackDriver Prometheus and Kamino
Coming soon
Documentation, a lot of it.
More updated modules from 0.6.x Series
a small shameless plug...
https://kamino.io
https://kamino.io
Thanks for Coming!
Get more info at http://kamon.io/
https://github.com/kamon-io
@kamonteam
Minor Rants and Advice on Monitoring
By Ivan Topolnjak
Minor Rants and Advice on Monitoring
BeeScala 2017


