Opencast Analytics @ DCE
Jay Luker - Senior Software Engineer, Harvard DCE
Using Opencast API data to...
- track workflow performance
- understand workflow performance
- (nearly) real-time user activity monitoring
- provide user insight to instructors & researchers (future)
Workflow Browser
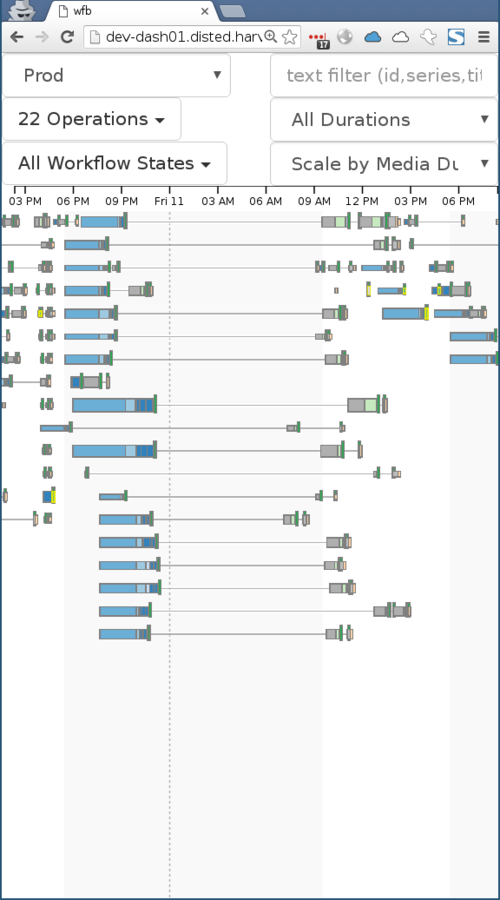
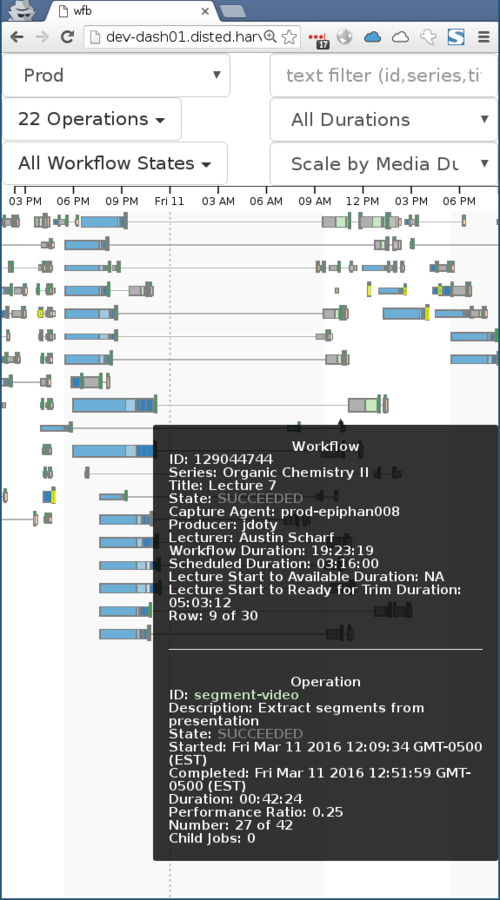
- d3-based workflow visualization
- Each workflow rendered as a timeline showing duration of individual operations
- Pan, zoom and filter
- Mouse-over operations to display details
- Goal was to allow visual id of problem workflows and/or operations
WPI Dashboard
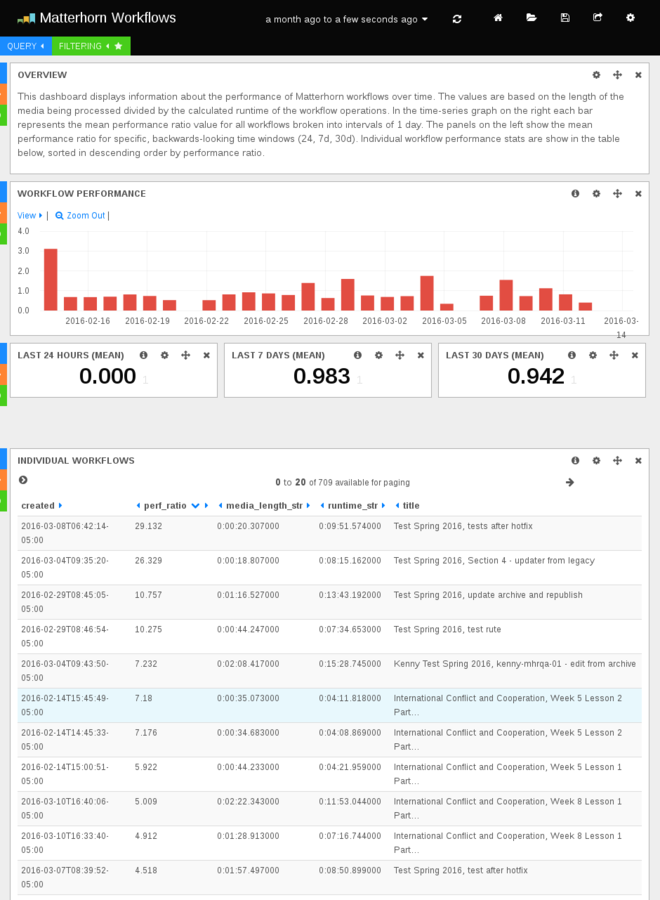
- Workflow Performance Index
- WPI = media length divided by workflow run time
- run time calculation excludes operations not related to actual video production
- Time-series graphs of active user sessions
- Filter by live vs on demand, identified vs anonymous
- Top terms: course, IP address, browser, device, OS
- User location mapping based on geoip lookups
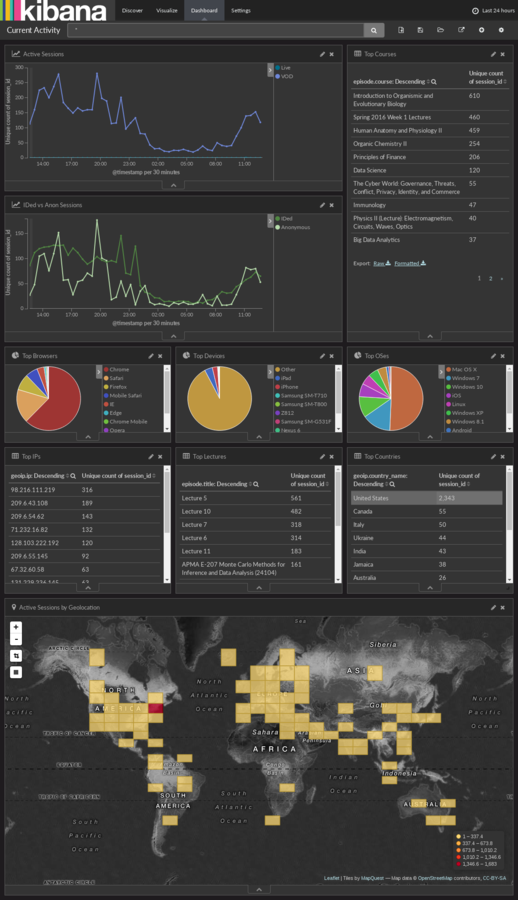
User Activity
Dashboard
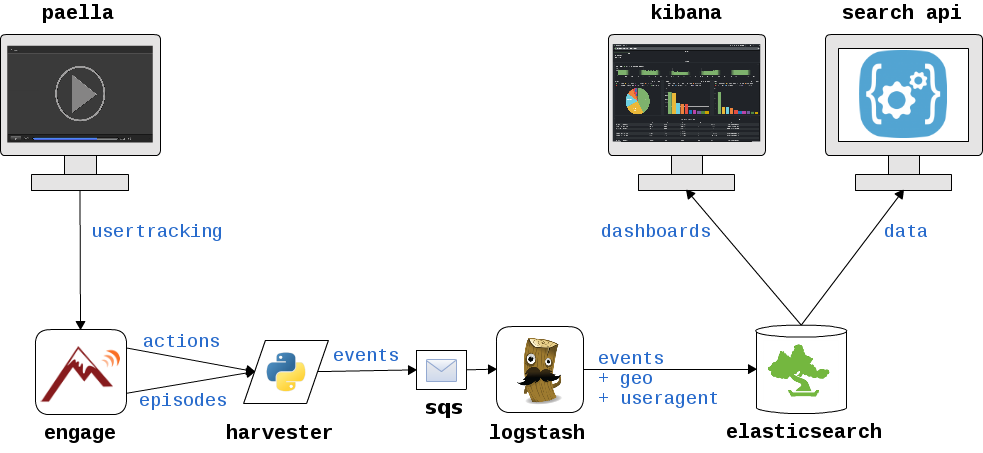
Usertracking Event Pipeline
Paella
- Standard event types: PLAY, PAUSE, SEEK, etc
- HEARTBEAT events every 30s
- Custom param: playing=<true|false>
- Additional interesting event types:
- setVolume
- enterFullscreen
- setplaybackrate
- caption:enabled
Usertracking Service
- Usertracking service adds user id based on auth
- Current DB size: ~73G
- Mostly mh_user_action: 131m records
- This is a problem
- We are exploring solutions
Harvester
- Runs */2 minutes
- Fetches actions in batches using start/end params
- Builds event record from action + episode metadata
- Publishes to SQS
ELK Elastic Stack
- Logstash - multi-purpose data pipeline component
- geoip lookups
- browser useragent parsing
- Elasticsearch - data store for search & analytics
- automated snapshots to s3
- indexes older than x days: archive & delete (future)
- Kibana - analytics & visualization platform
- internal dashboards
- embed graphs in LMS course pages (future)
{
  "mpid": "f21fcc8f-93...",
  "ip": "12.34.56.78",
  "huid": "12346789",
  "is_live": 0,
  "ua": {...},
  "session_id": "15fe8z...",
  "action_id": 72922555,
  "@version": "1",
  "@timestamp": "2016-01-01...",
  "episode": {...},
  "host": "127.0.0.1",
  "geoip": {...},
  "ua": {...}
}
{
"inpoint": 4790,
"type": "HEARTBEAT",
"is_playing": true
}{
"series": "20160114328",
"course": "Data Science",
"type": "L10",
"title": "Lecture 10",
"year": "2016",
"term": "01",
"cdn": "14328",
"duration": 5978537,
"start": "2017-04-03T21:29:00Z"
}{
"ip": "12.34.56.78",
"country_code2": "SA",
"country_code3": "SAU",
"country_name": "Saudi Arabia",
"continent_code": "AS",
"timezone": "Asia/Riyadh",
"location": [45,25]
}{
"name": "Chrome",
"os": "Windows 7",
"os_name": "Windows 7",
"device": "Other",
"major": "47",
"minor": "0",
"patch": "2526"
}Next Steps (in no particular order)
- Convert Workflow Browser & WPI Dashboard to new Elastic Stack deployment
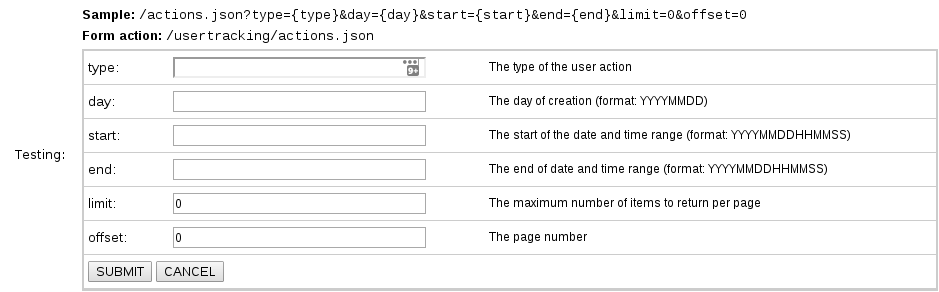
- Query API for user event data
- Embeddable visualizations
- Separate usertracking collection from engage
Thanks!
Here's some links!
- These slides: http://bit.ly/dce-analytics
- DCE @ Github: https://github.com/harvard-dce
- mh-opsworks-recipes (jluker-elk branch)
- mh-user-action-harvester
- dce-paella-extensions
- mh-workflowbrowser
- Elastic Stack: https://www.elastic.co/
Opencast Analytics @ DCE
By James Luker


