Mastering Chrome DevTools
I'm Jon Kuperman
I work at Adobe
I'm @jkup on Twitter
https://github.com/jkup/ama
We'll learn how to
- Use the DevTools as an IDE
- Debug complex applications
- Analyze network traffic
- Audit a website
- Monitor real user performance
- Profile CPU usage
- Analyze Node.js performance
- Find and fix memory leaks
- Tips and tricks!
A brief history
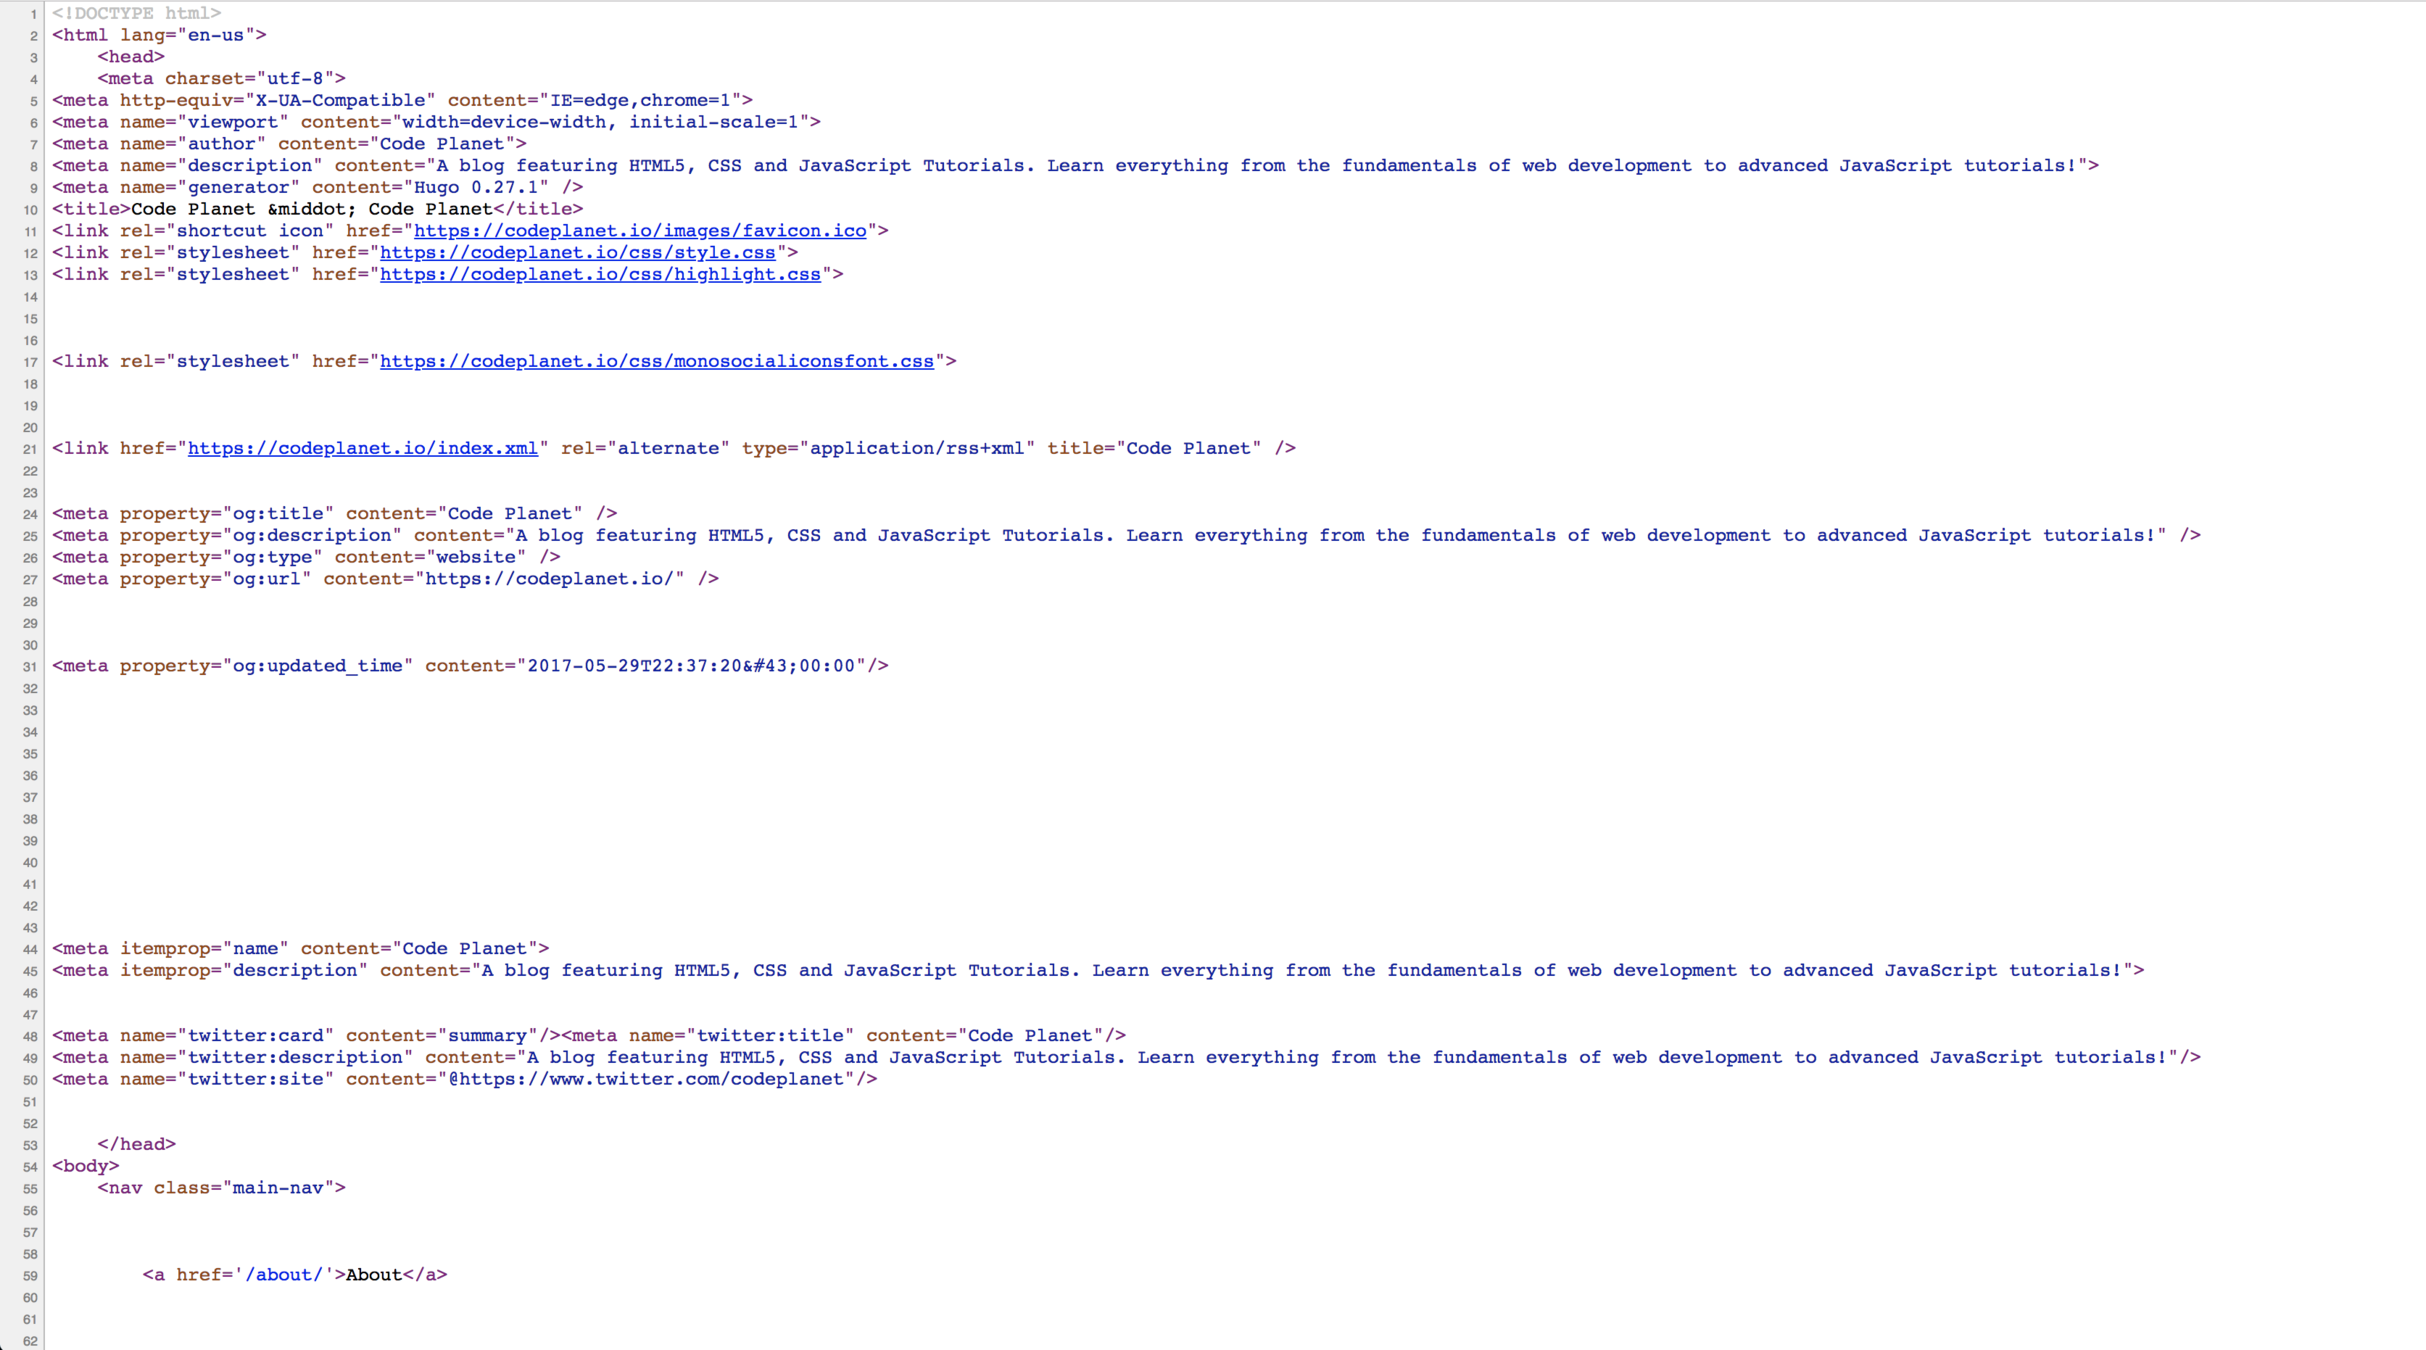
In the beginning...
Advanced Debugging

The Live DOM Viewer
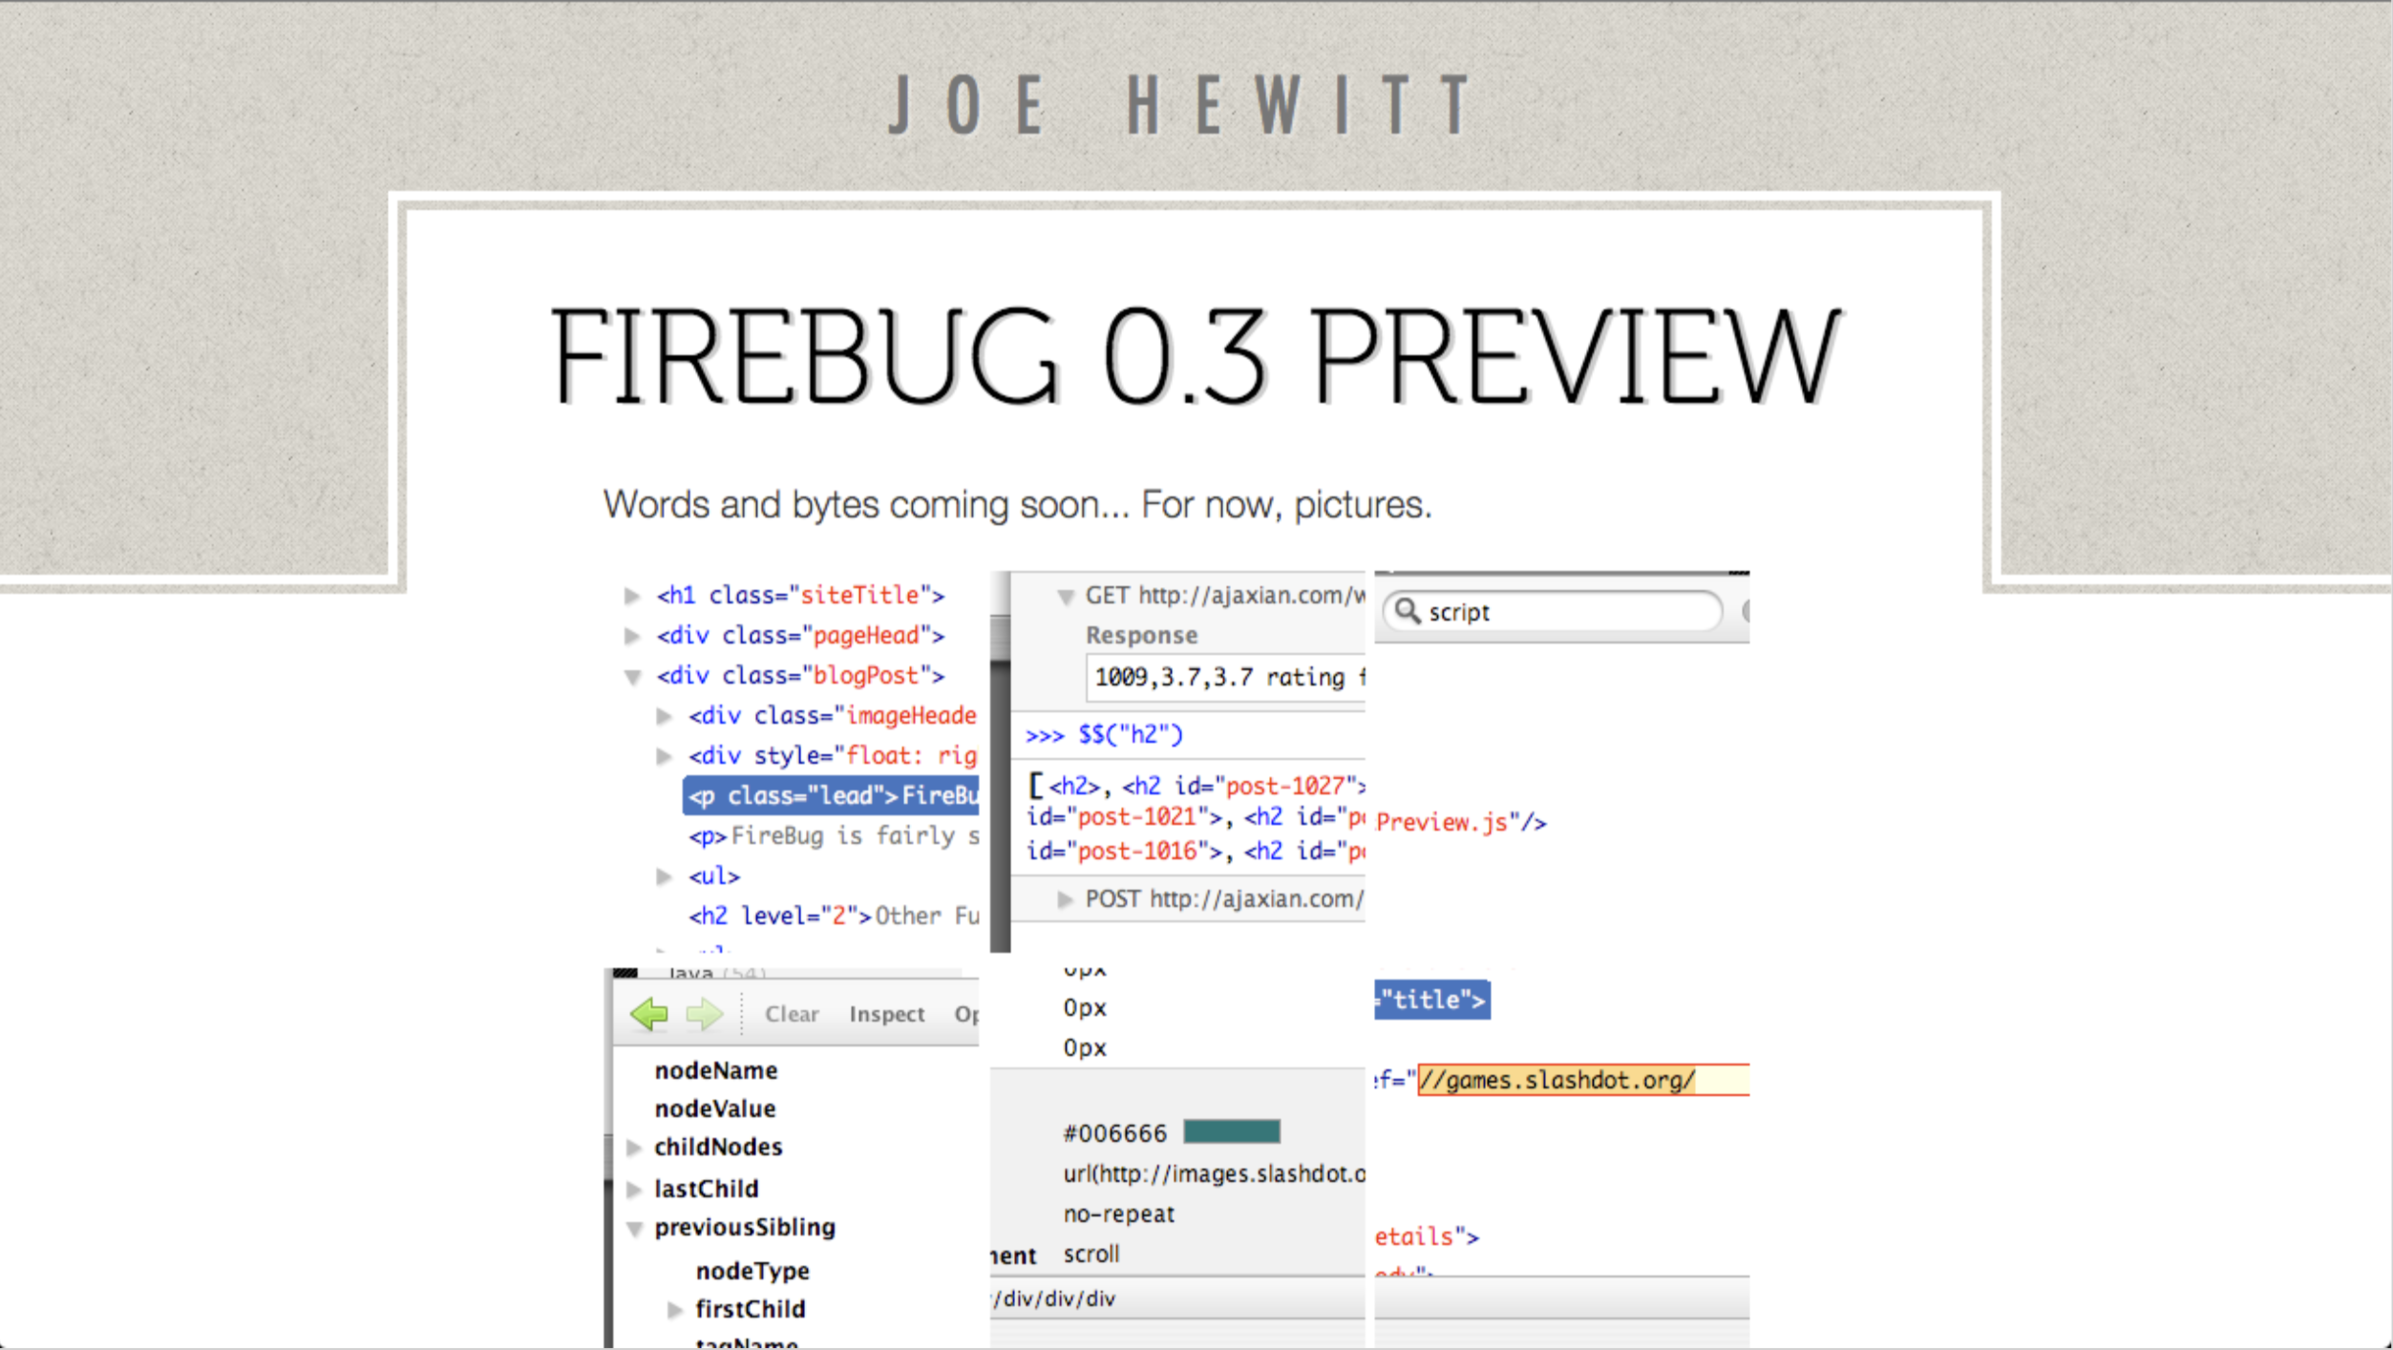
Firebug
Official Documentation
Our Sample App
These Slides

A walk through the panels
Editing
Debugging
Networking
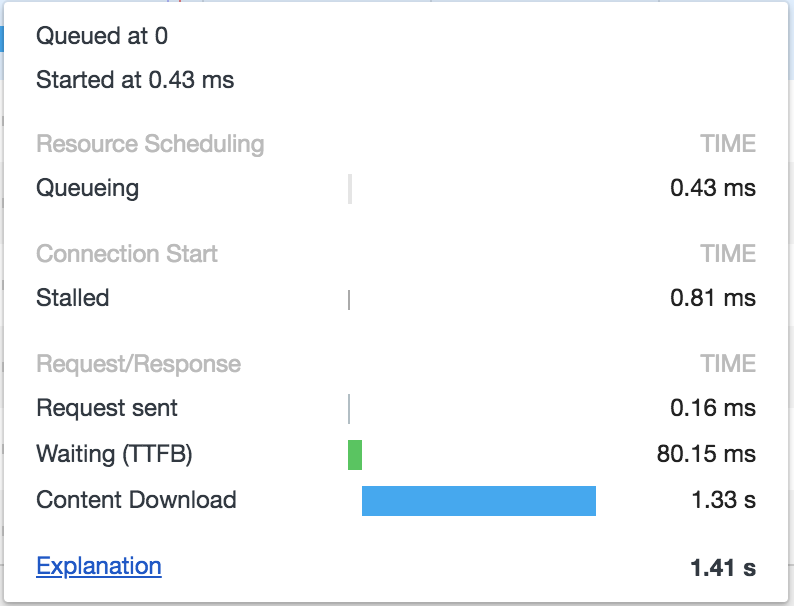
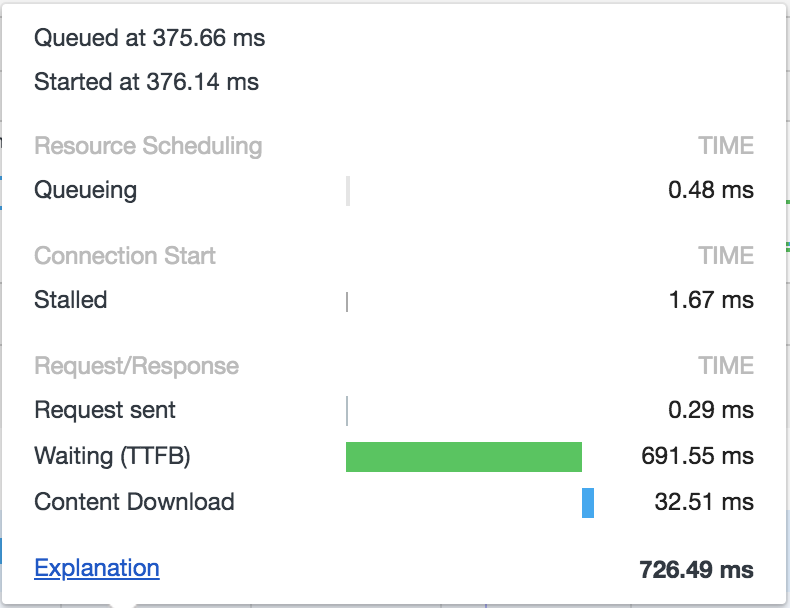
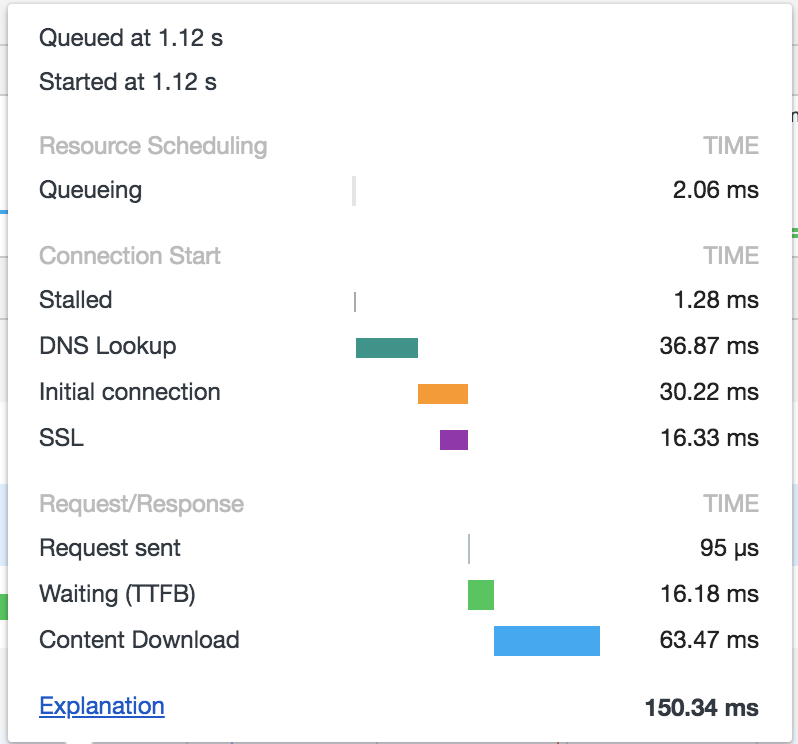
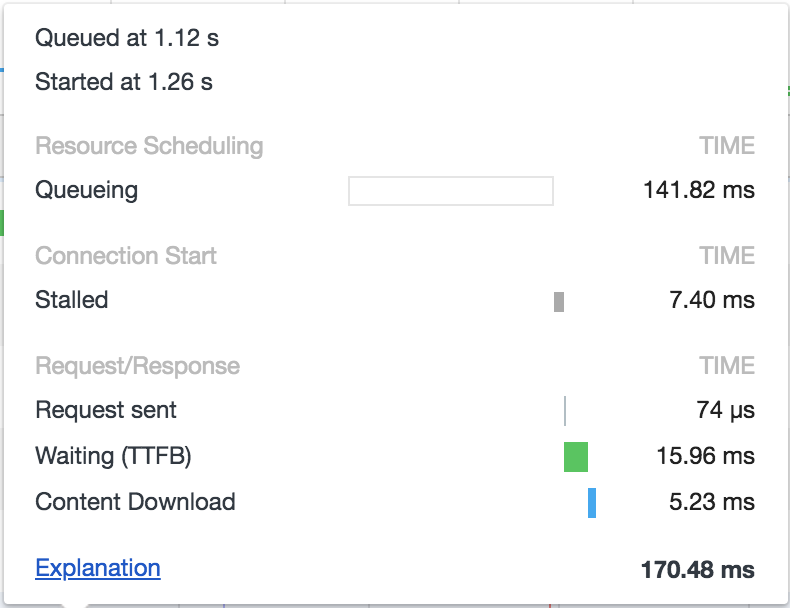
Queuing
A request being queued indicates that:
- The request was postponed by the rendering engine because it's considered lower priority than critical resources (such as scripts/styles). This often happens with images.
- The request was put on hold to wait for an unavailable TCP socket that's about to free up.
- The request was put on hold because the browser only allows six TCP connections per origin on HTTP 1.
- Time spent making disk cache entries (typically very quick.)
Stalled / Blocking
Time the request spent waiting before it could be sent. It can be waiting for any of the reasons described for Queueing. Additionally, this time is inclusive of any time spent in proxy negotiation.
Proxy Negotiation
Time spent negotiating with a proxy server connection.
DNS Lookup
Time spent performing the DNS lookup. Every new domain on a page requires a full roundtrip to do the DNS lookup.
Initial Connection / Connecting
Time it took to establish a connection, including TCP handshakes/retries and negotiating a SSL.
SSL
Time spent completing a SSL handshake.
Request Sent / Sending
Time spent issuing the network request. Typically a fraction of a millisecond.
Waiting (TTFB)
Time spent waiting for the initial response, also known as the Time To First Byte. This time captures the latency of a round trip to the server in addition to the time spent waiting for the server to deliver the response.
Content Download / Downloading
Time spent receiving the response data.
Auditing
-
Google.com: +500 ms (speed decrease) -> -20% traffic loss
-
Yahoo.com: +400 ms (speed decrease) -> -5-9% full-page traffic loss (visitor left before the page finished loading)
-
Amazon.com: +100 ms (speed decrease) -> -1% sales loss

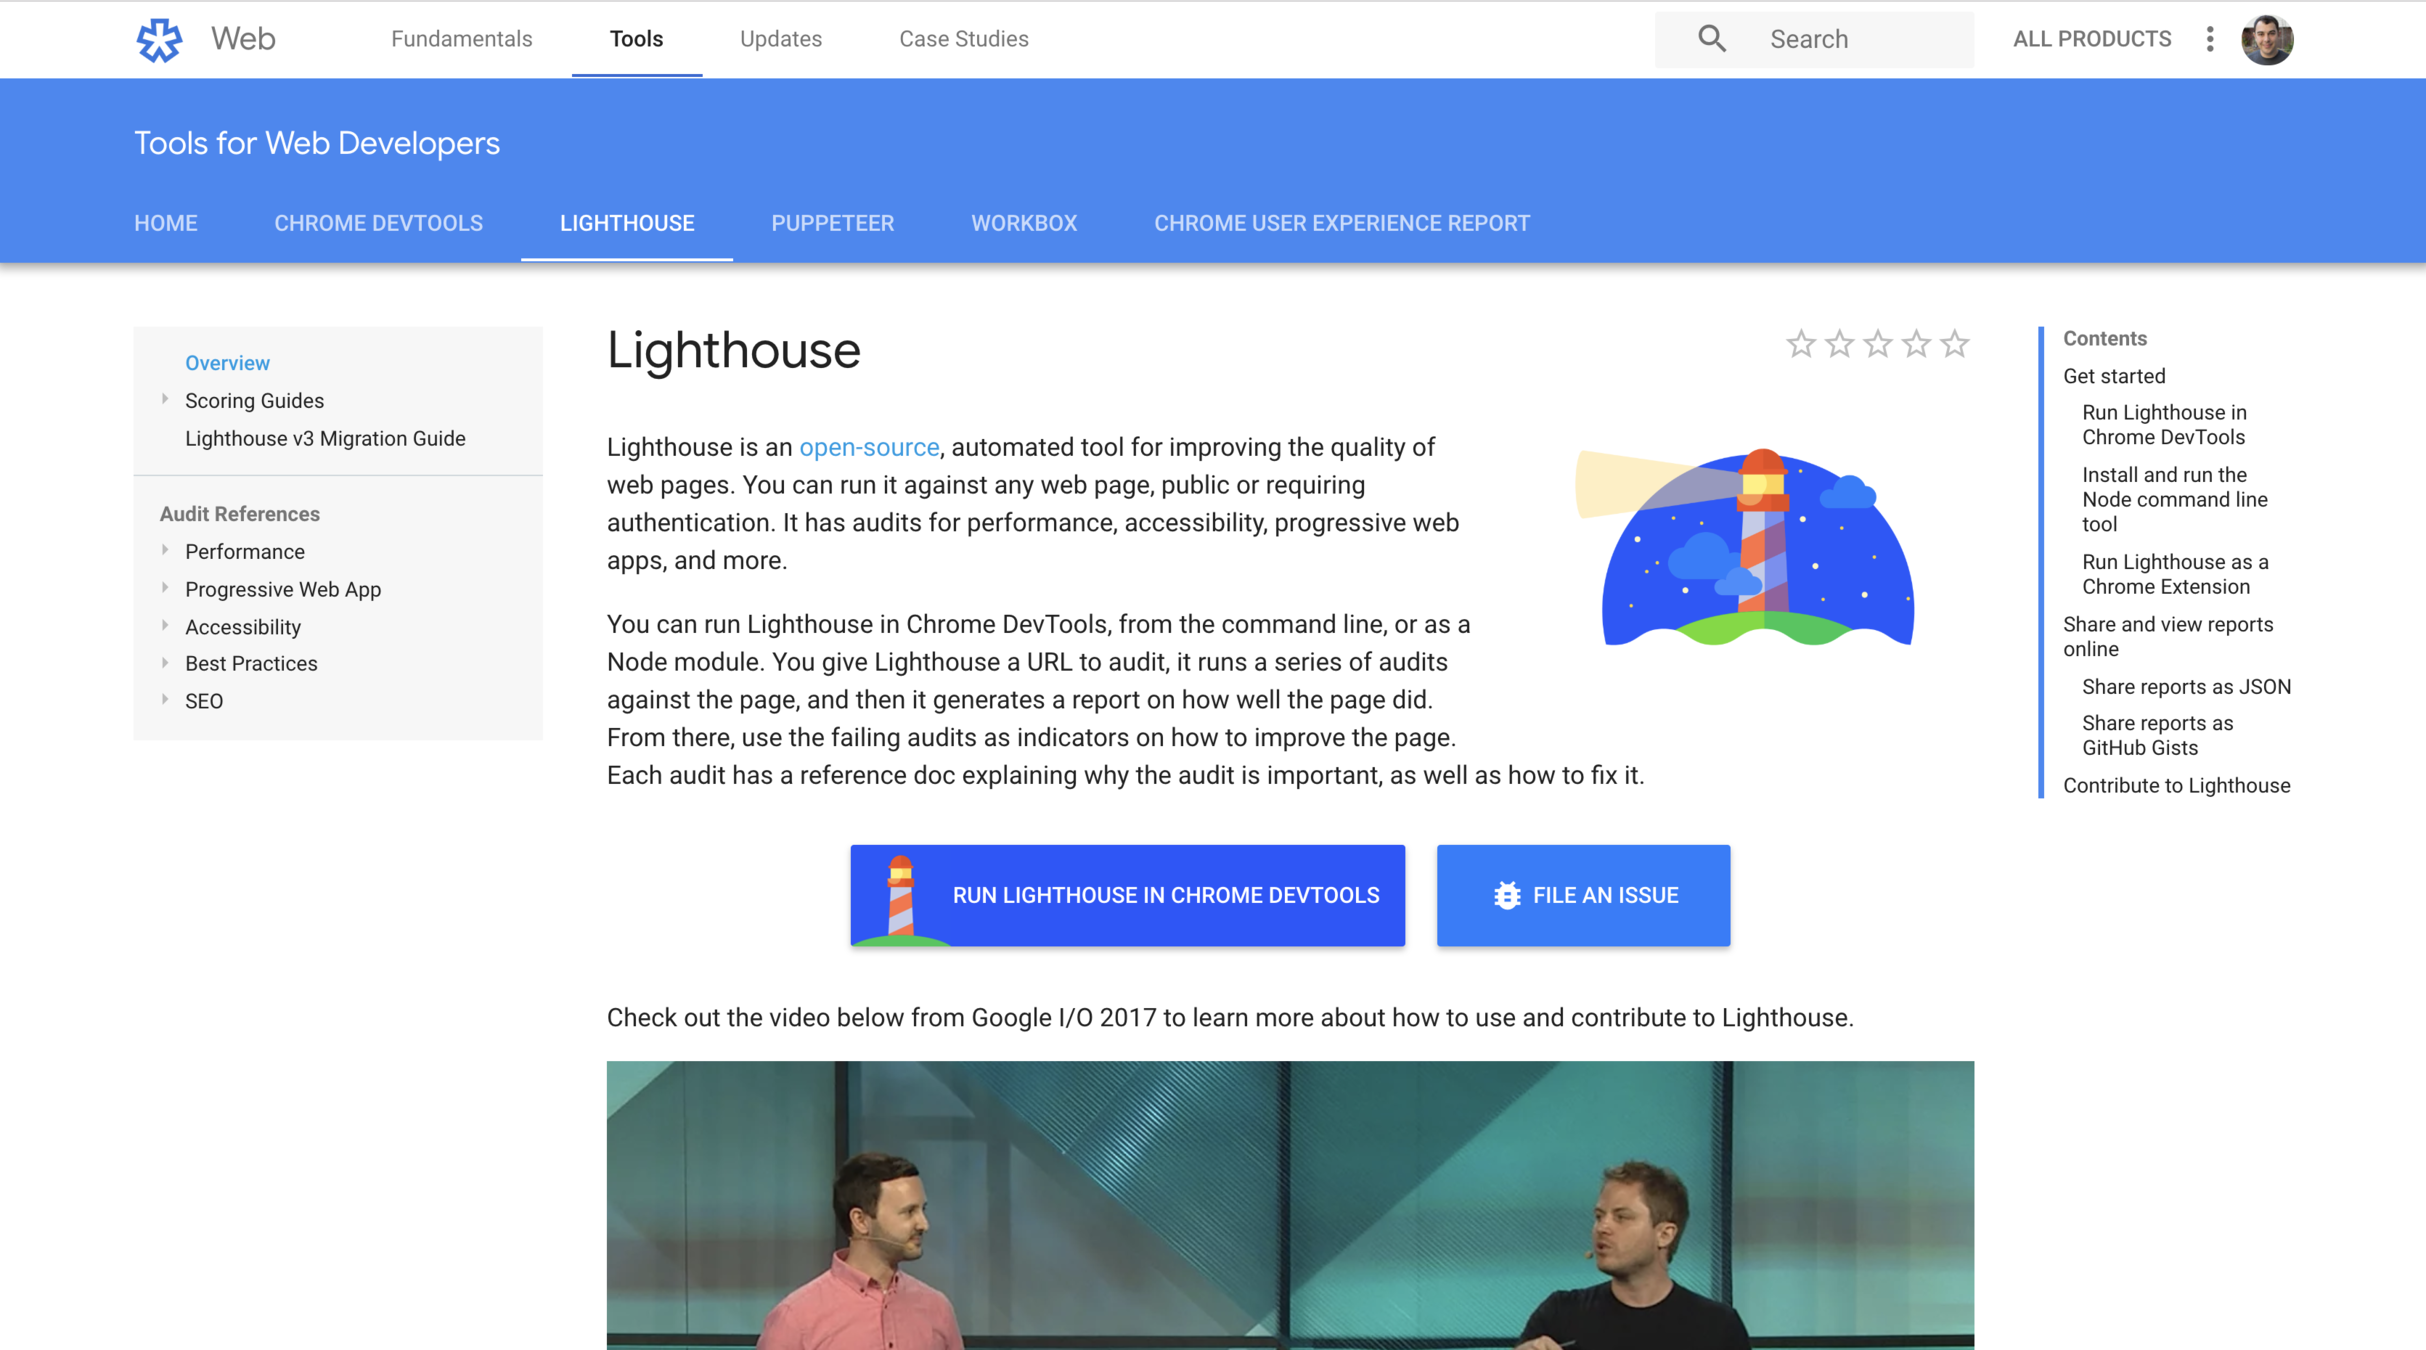

The Audit Panel
Common Audit Problems
-
Combine external CSS and JS
-
Enable gzip compression ( Apache, Node, WordPress )
-
Compress images
-
Leverage Browser Caching
-
Put CSS in document head
-
Unused CSS rules ( Old CSS that can be pruned )
Node.js Debugging
Performance Monitoring
Controlled vs. User Monitoring
The Performance API
const start = new Date().getTime();

// Do some work...

const end = new Date().getTime();

const time = end - start;
The old approach
performance.mark('start');

// Do some work...

performance.mark('end');

performance.measure('Our Measurement', 'start', 'end');

performance.getEntriesByType('measure');
Using Performance
Image Performance
A basic image
<img src="large.jpg" />Image srcset
<img srcset="large.jpg, 800w" />Image srcset
<img
  srcset="small.jpg 300w,
  medium.jpg 800w,
  large.jpg, 1200w"
/>
Image srcset
(with fallback)
<img
  src="large.jpg"
  srcset="small.jpg 300w,
  medium.jpg 800w,
  large.jpg, 1200w"
/>
Profiling
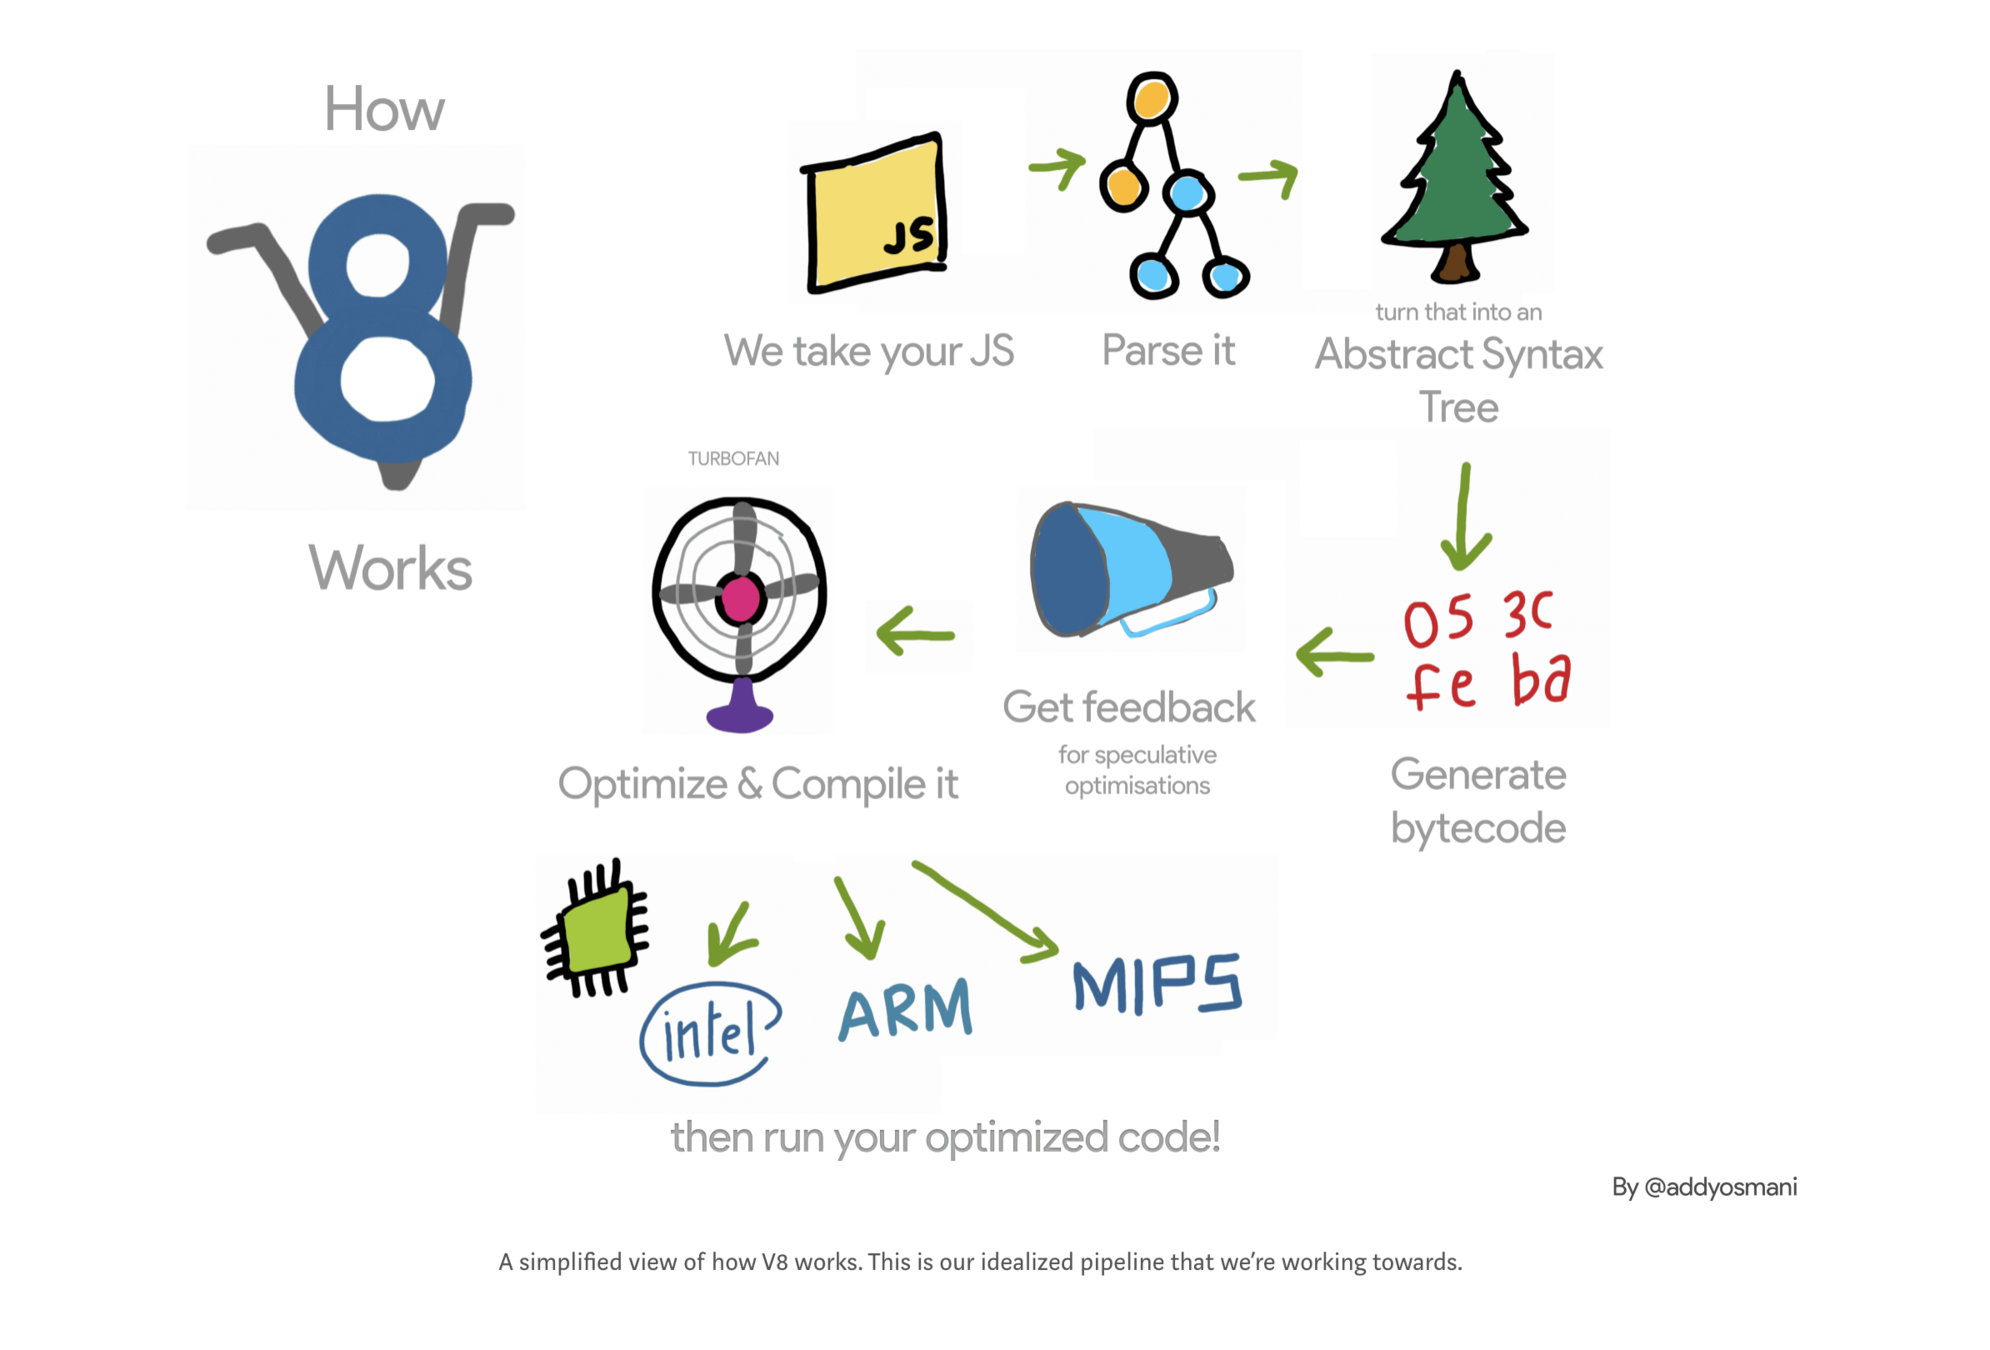
How browsers work
Page Jank
60
Frames Per Second
Most devices today refresh their screens 60 times a second. The browser needs to match the device’s refresh rate and put up 1 new picture, or frame, for each of those screen refreshes.
Each of those frames has a budget of just over 16ms (1 second / 60 = 16.66ms). In reality, however, the browser has housekeeping work to do, so all of your work needs to be completed inside 10ms.
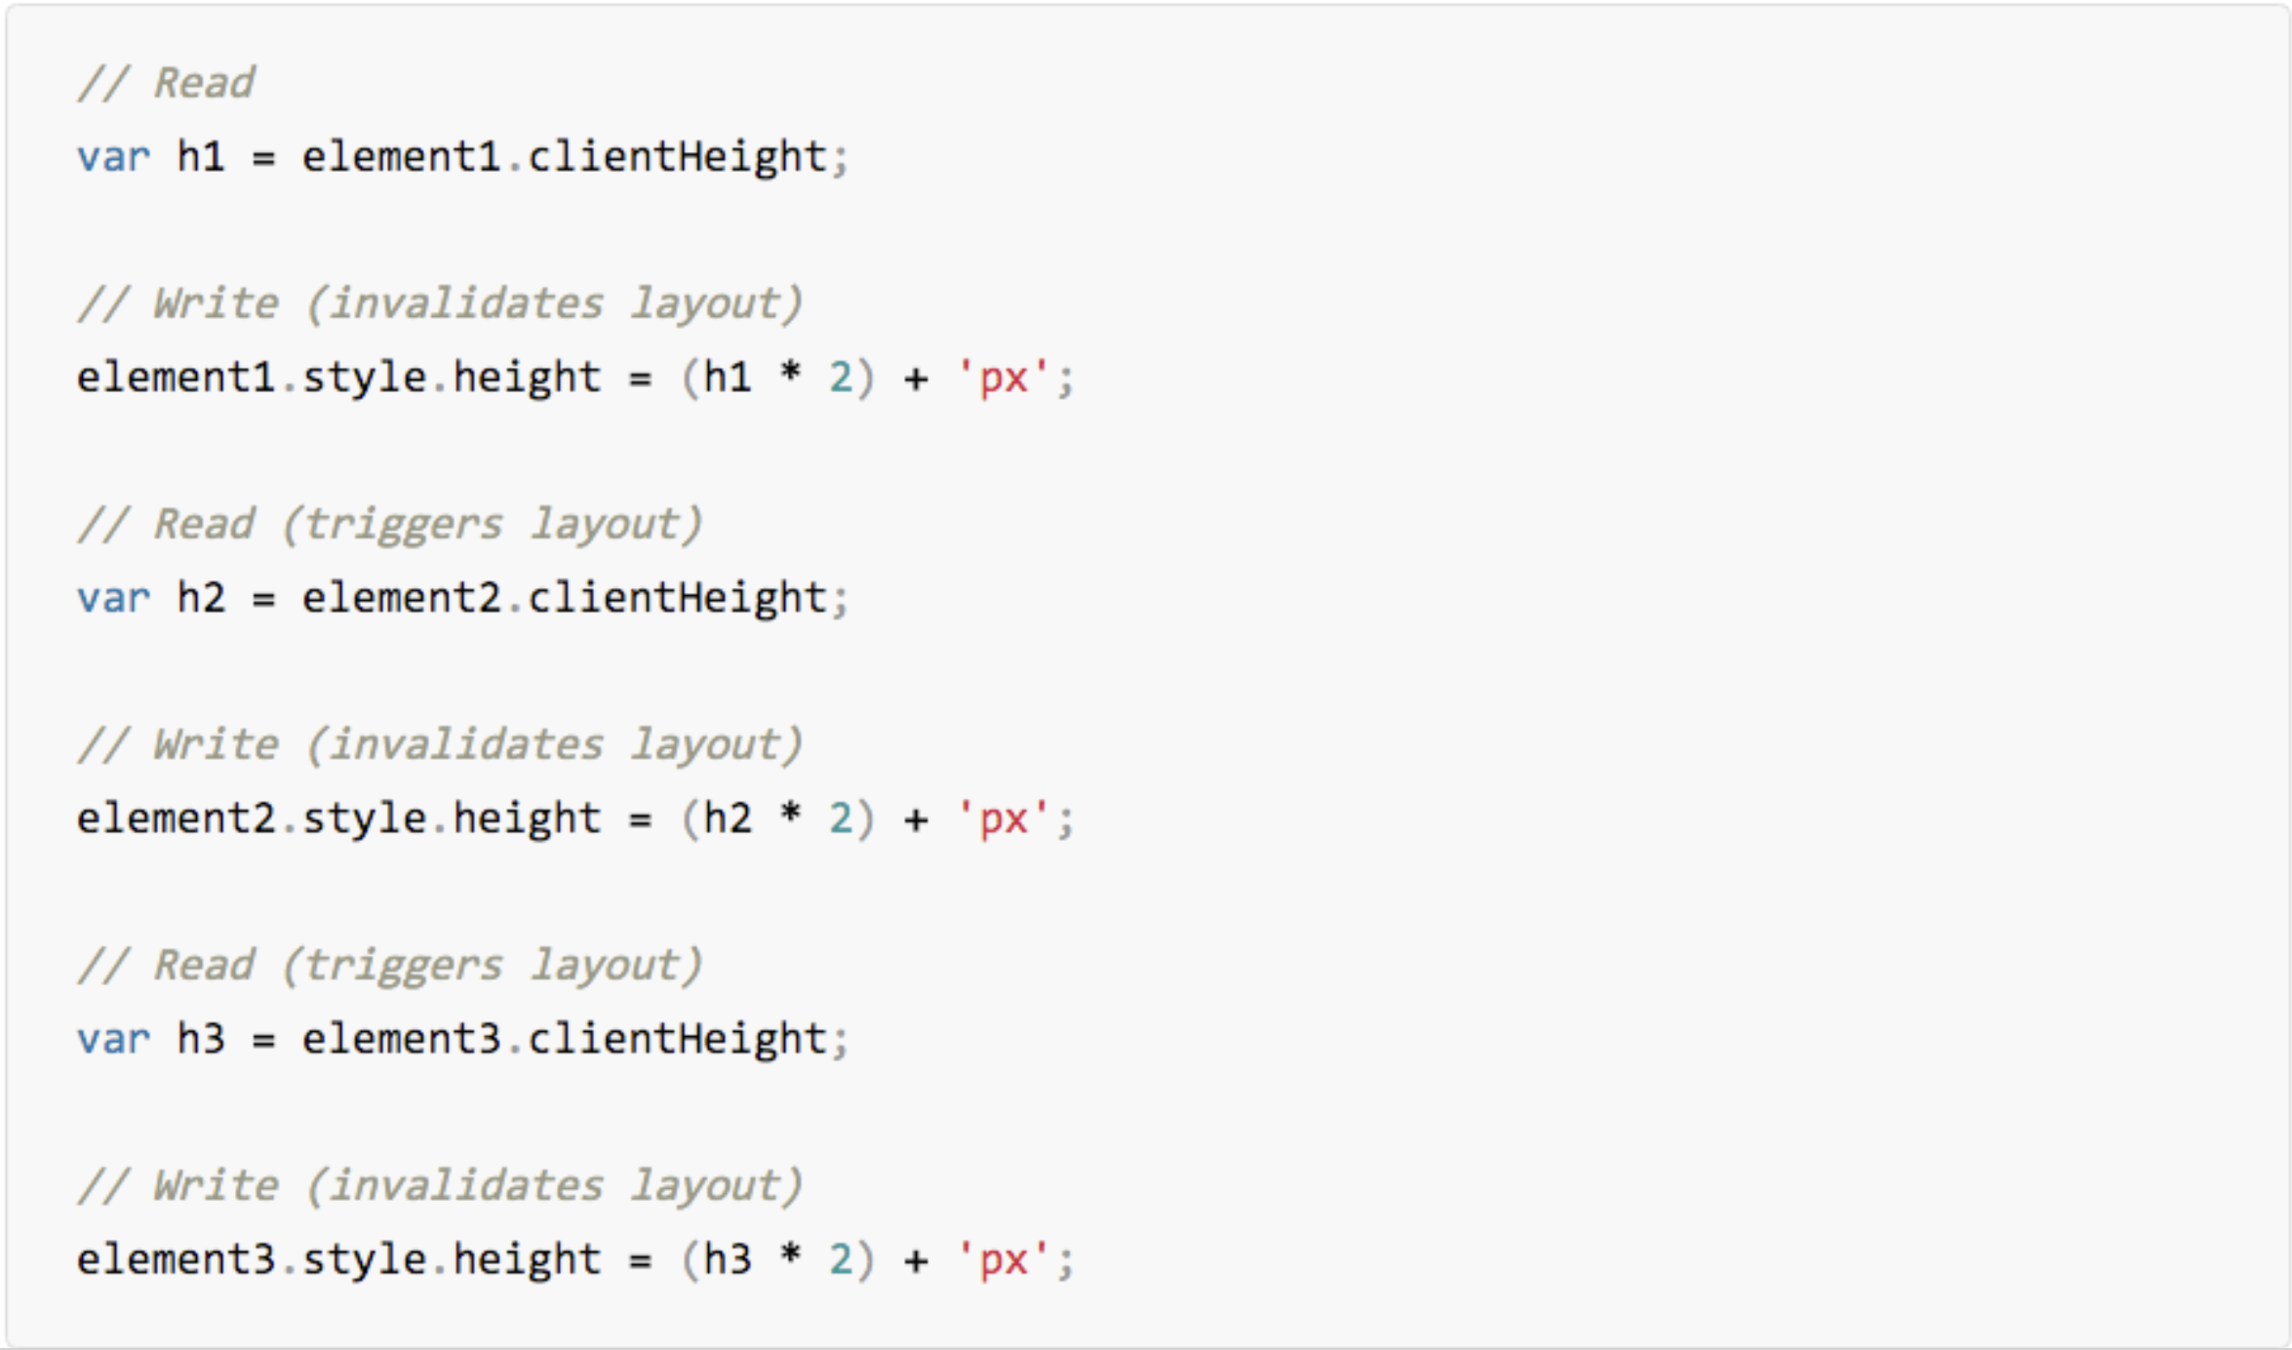
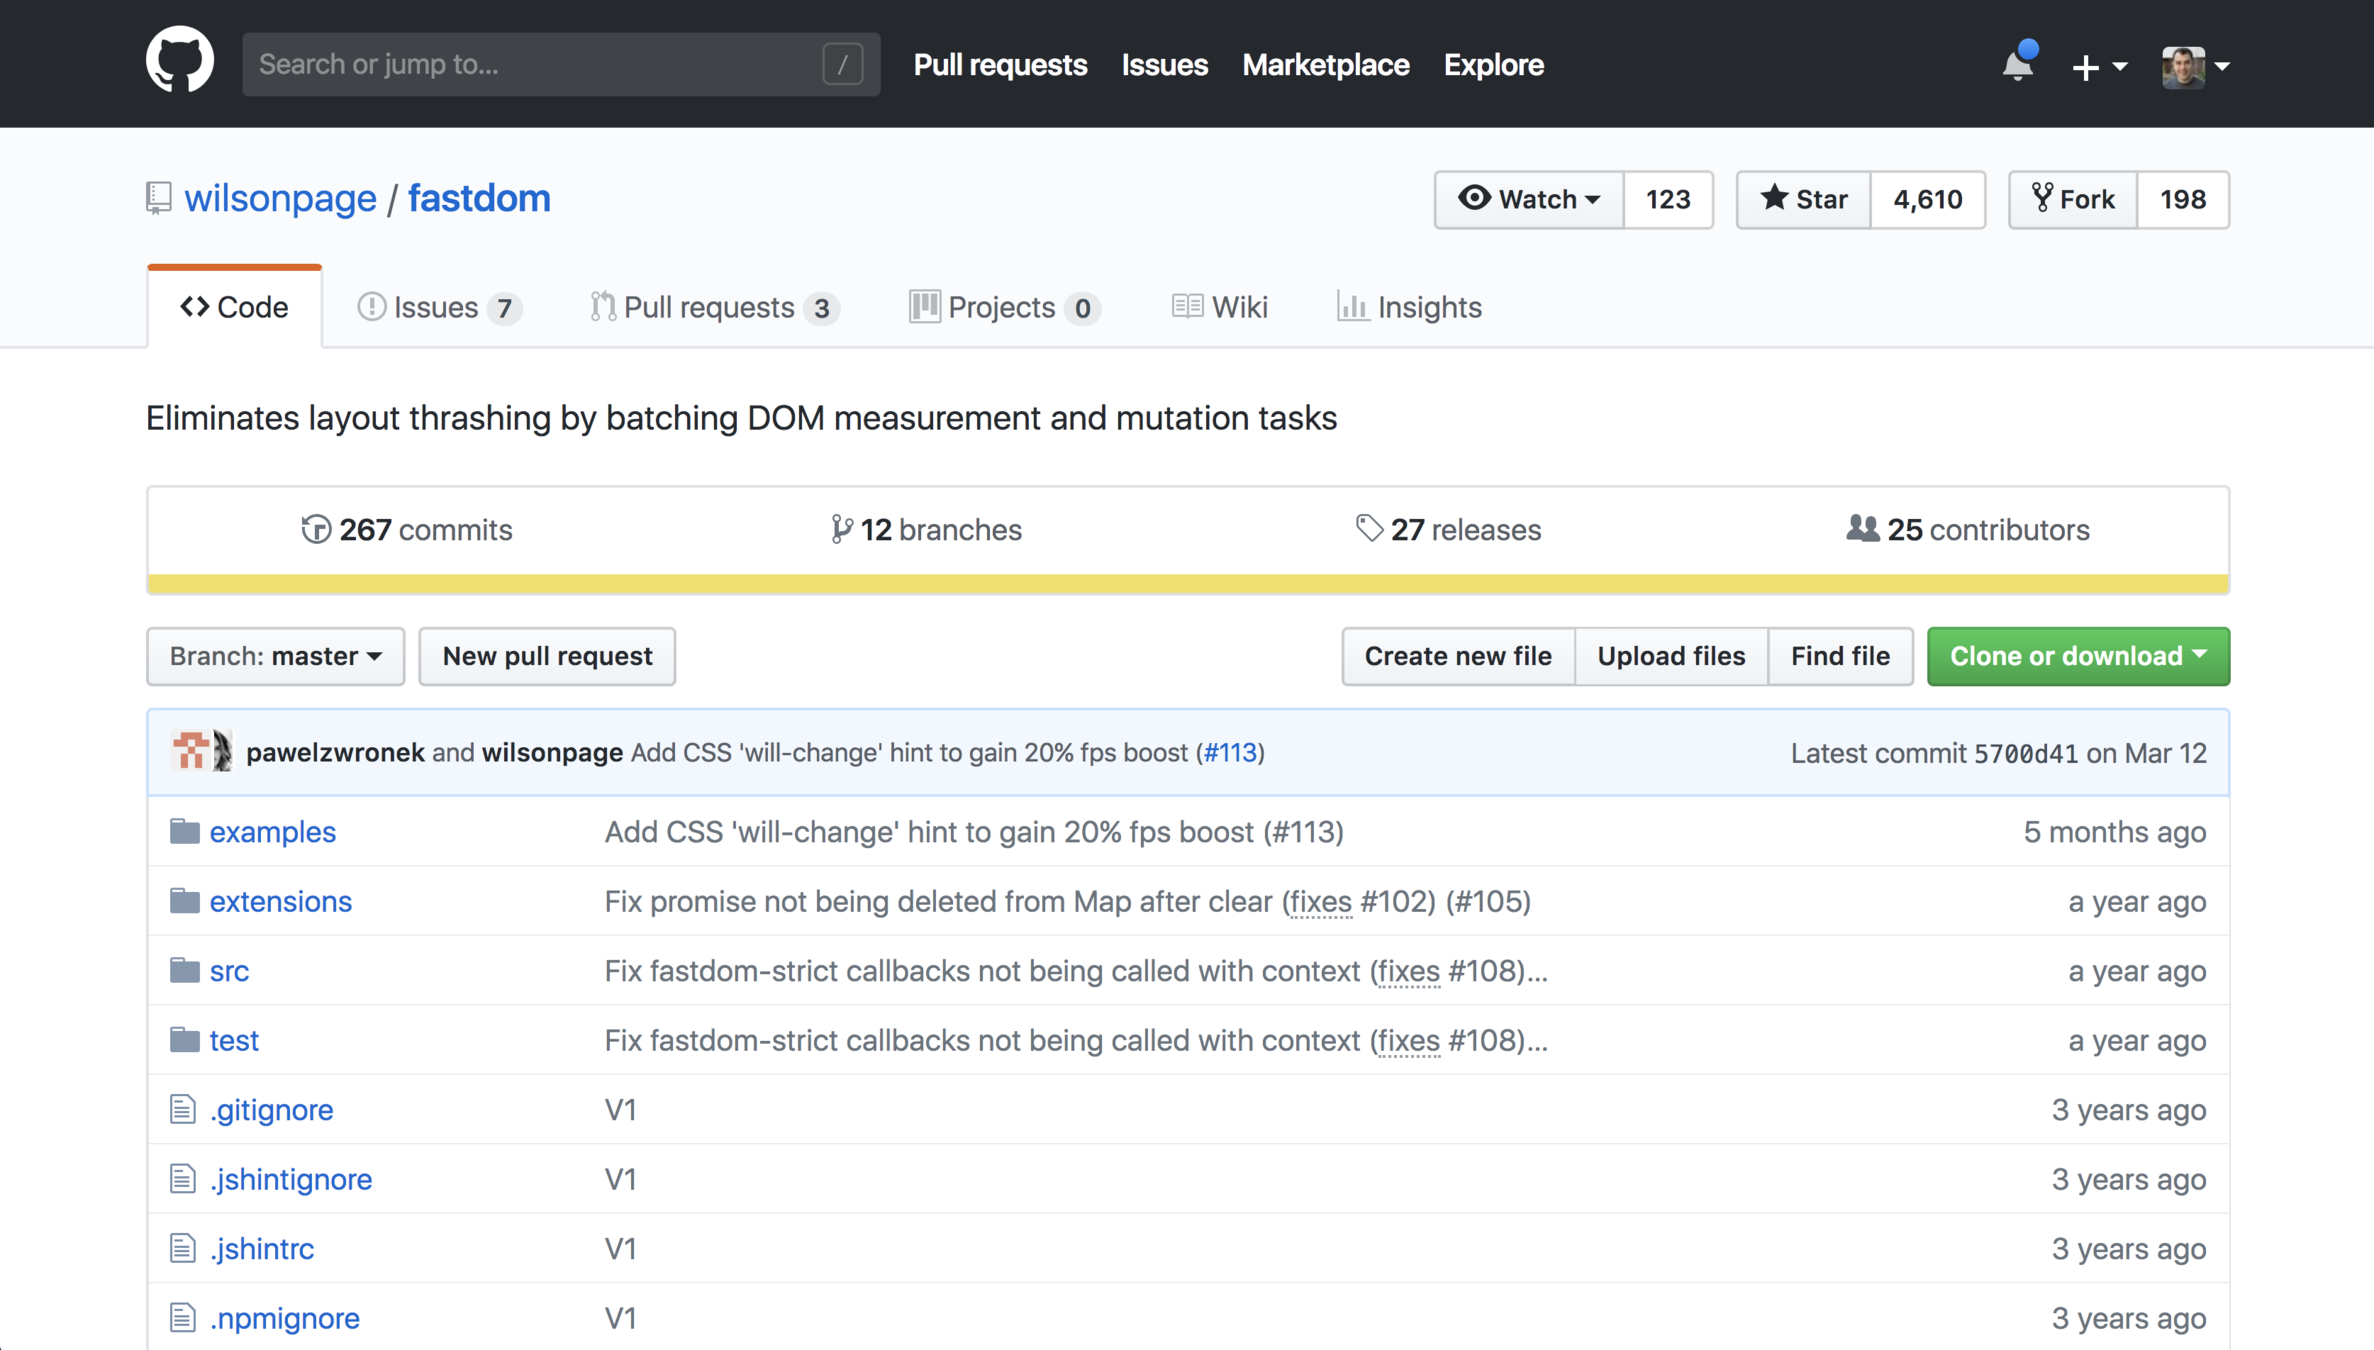
window.requestAnimationFrame()
Memory Leaks
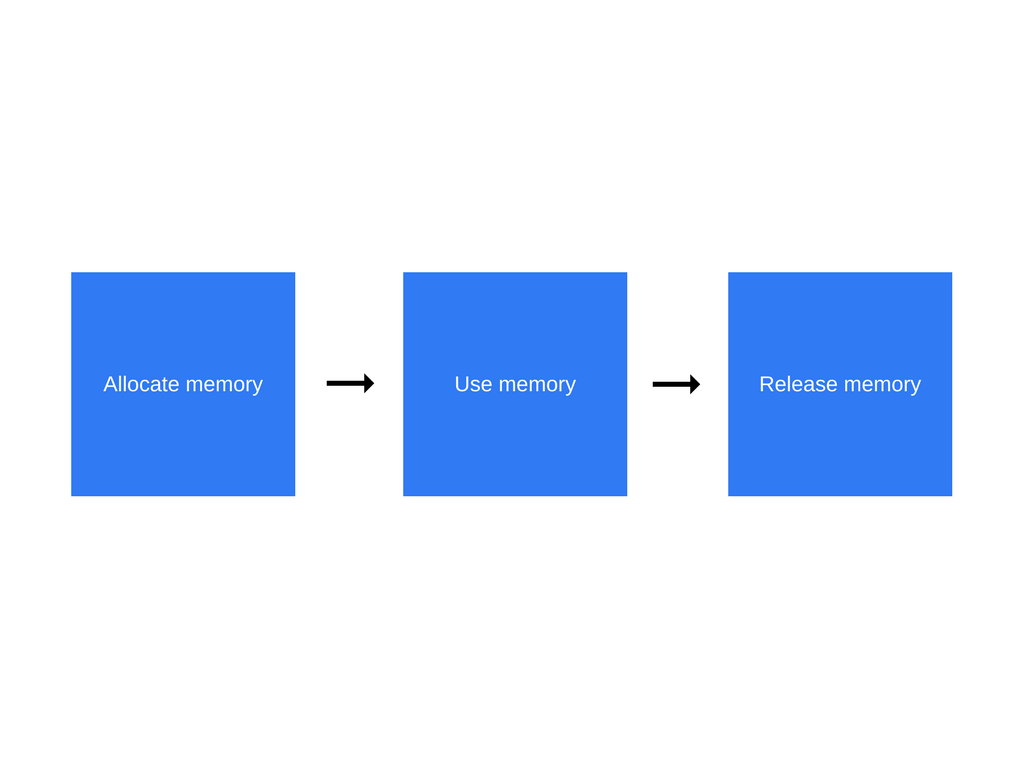
Common Causes
of JavaScript Memory Leaks
The Accidental Global
function foo() {
  bar = "This is probably not what you meant";
}
The Forgotten Timer
const data = getData();
setInterval(() => {
  document.body.innerHTML = JSON.stringify(data);
}, 1000);
The DOM and not the DOM
const button = document.getElementById("button");
// Then Later
function removeButton() {
  document.body.removeChild(
    document.getElementById("button")
  );
}
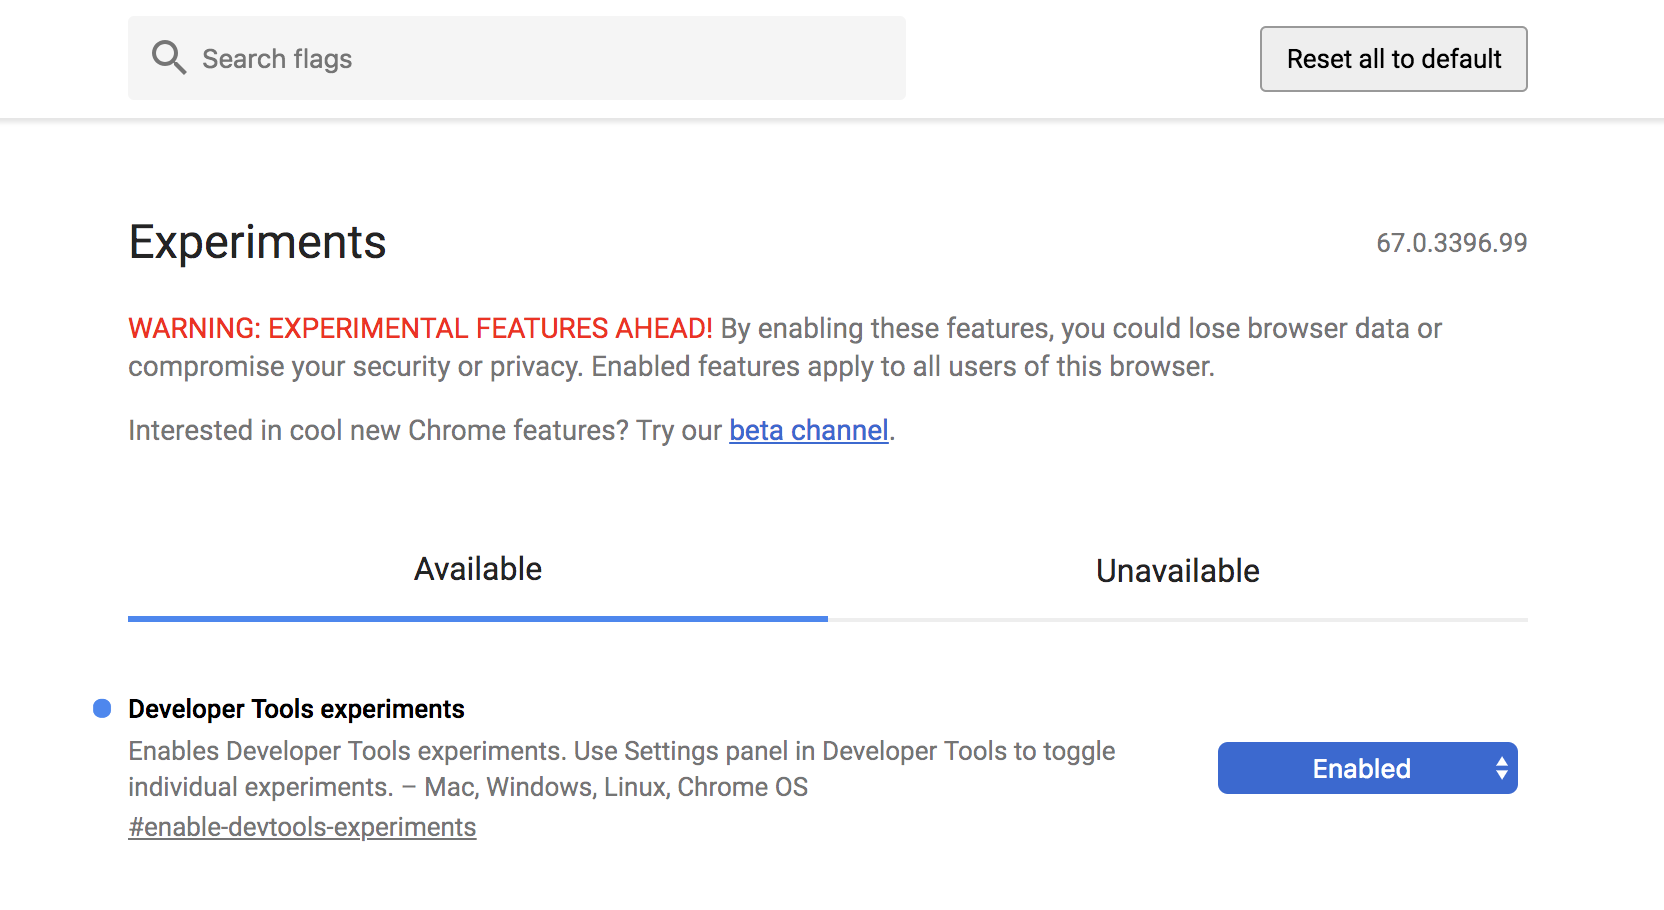
Experiments!
Where do we go from here?
Let's Audit Some Websites!
Mastering Chrome DevTools
By Jon Kuperman
Mastering Chrome DevTools
- 9,110

