Felix Wiegand¹, David Lähnemann¹², Felix Mölder¹³, Hamdiye Uzuner¹, Adrian Prinz¹ Alexander Schramm²⁴, Johannes Köster¹²
¹Bioinformatics and Computational Oncology, Institute for AI in Medicine, University Hospital Essen, University of Duisburg-Essen
²German Cancer Consortium (DKTK). Partner Site University Hospital Essen
³Institute of Pathology, University Medical Center Essen
⁴Laboratory of Molecular Oncology, West German Cancer Center, Department of Medical Oncology, University Hospital Essen
https://koesterlab.github.io

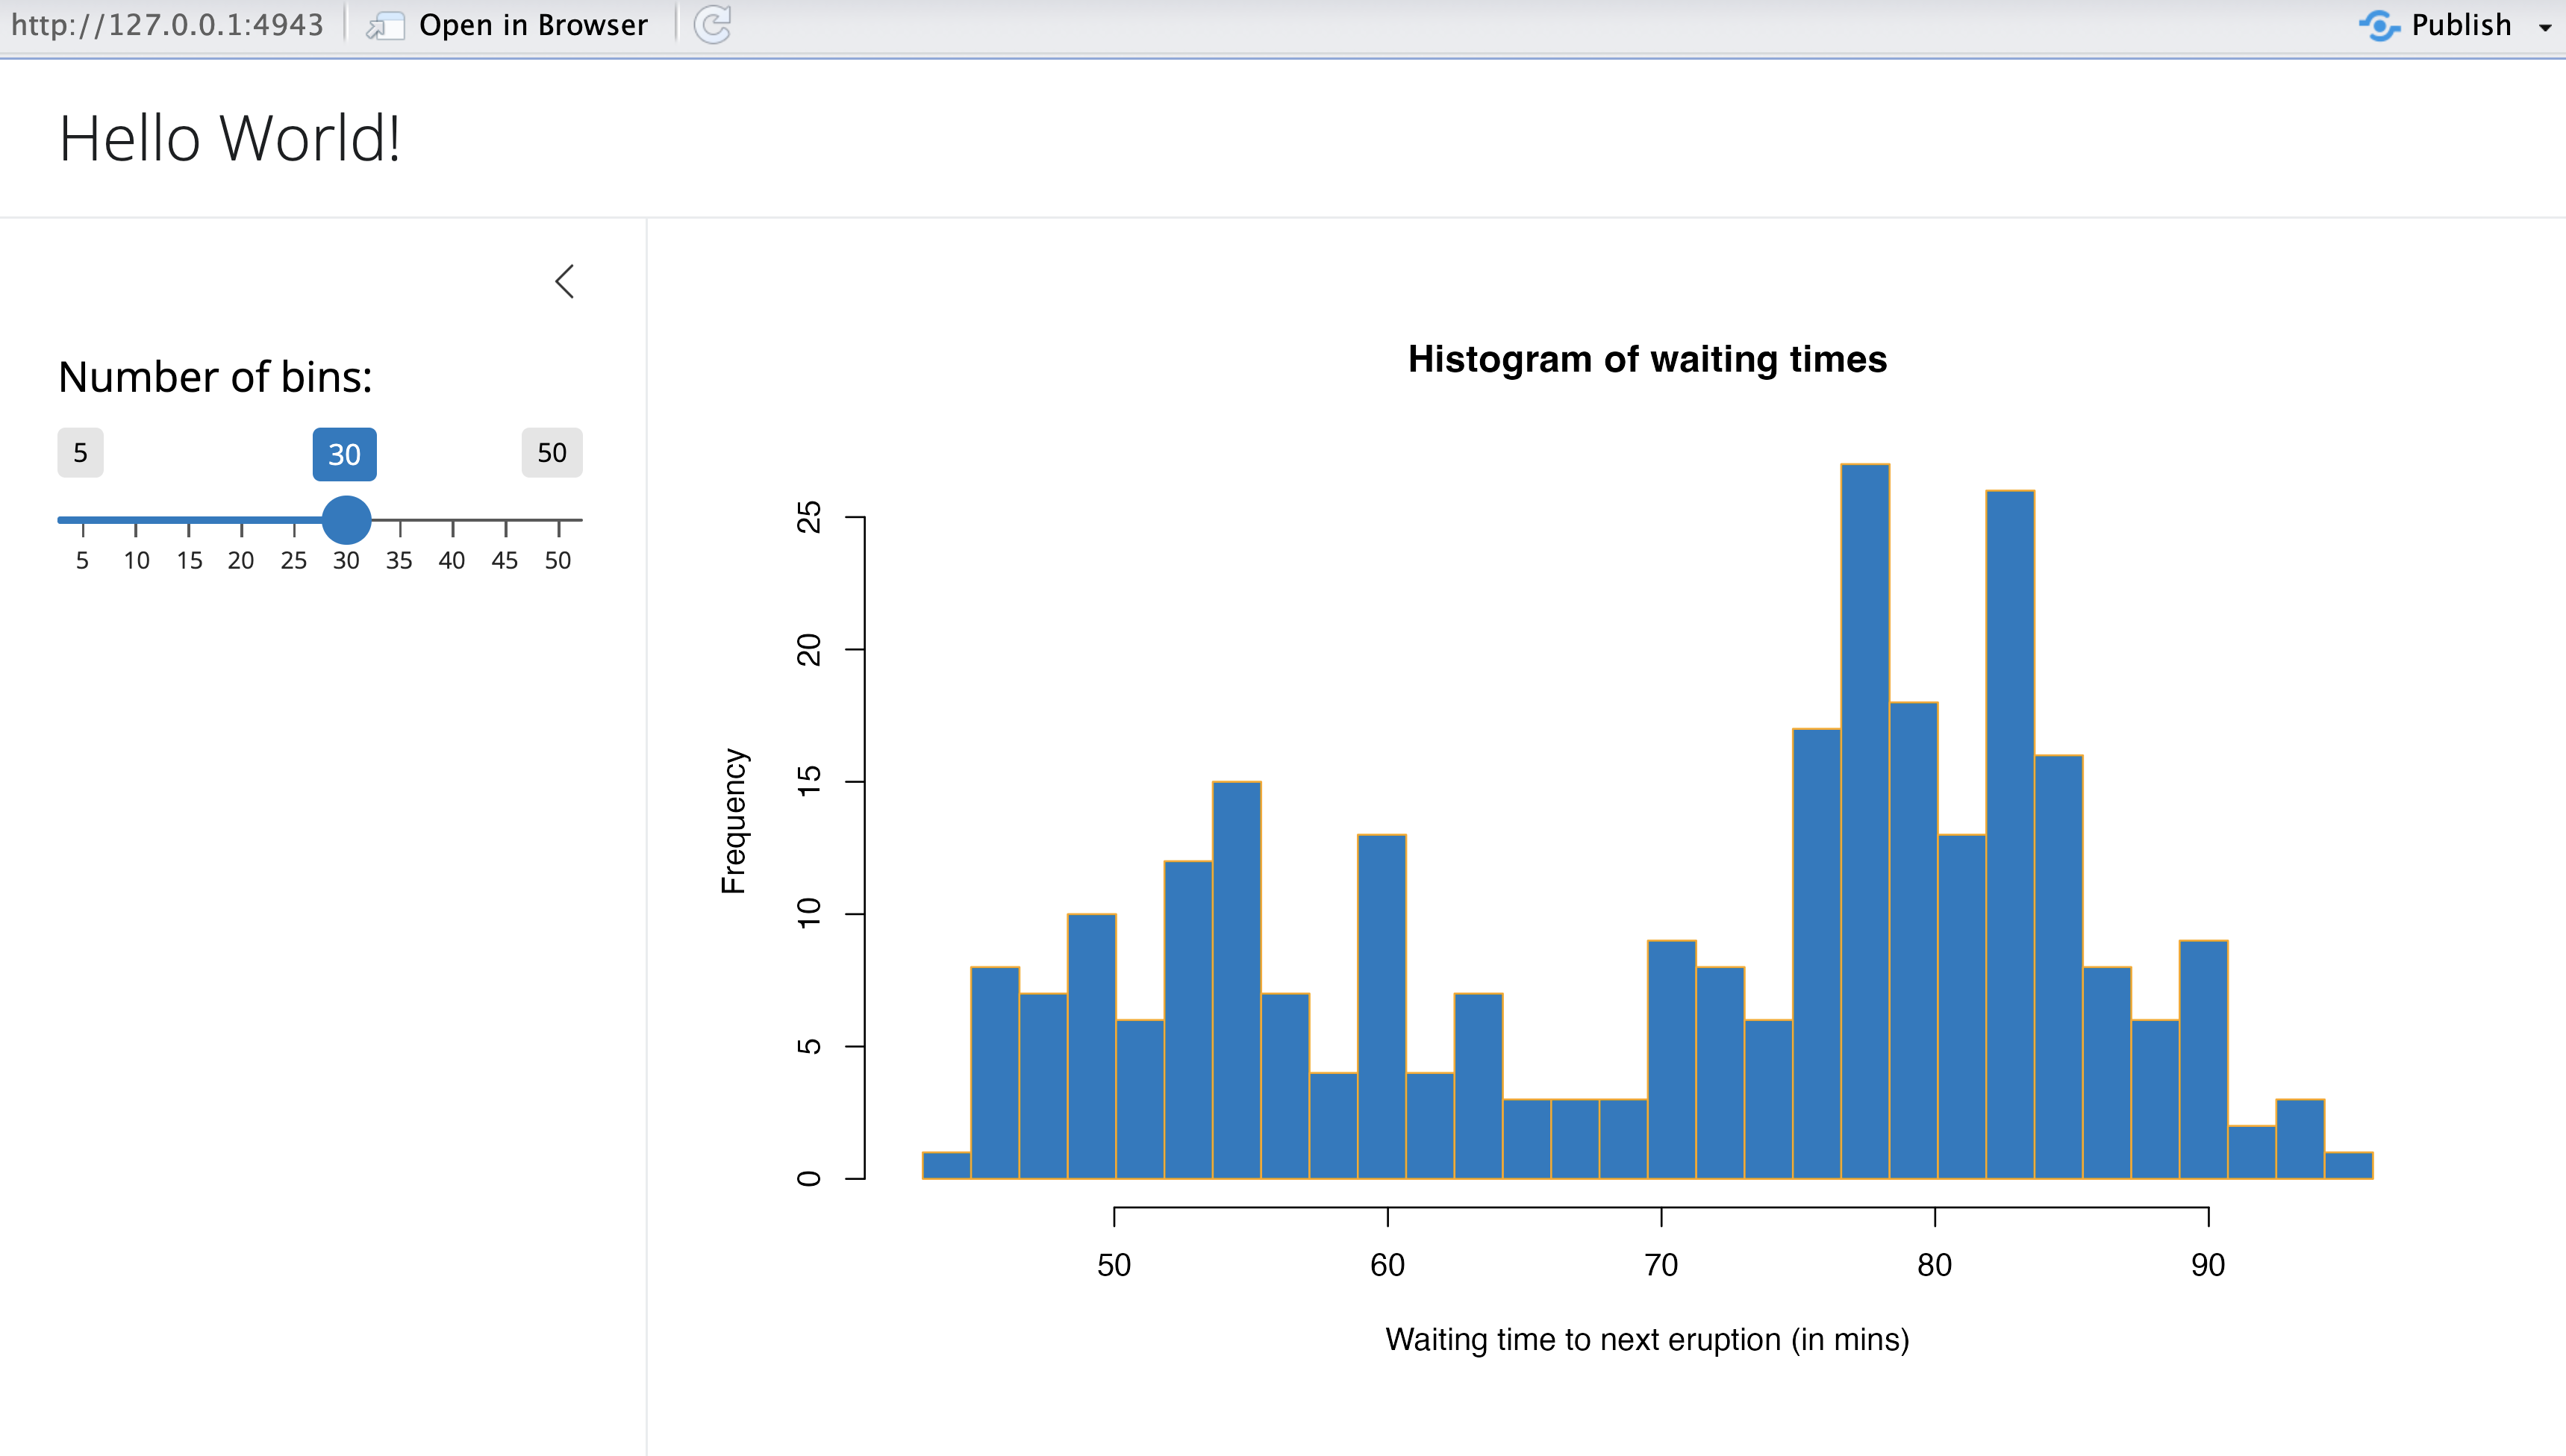
¹ https://shiny.rstudio.com
² https://bioinformaticsworkbook.org


Excel/CSV:
- non-interactive
- non-visual
Interactive visual document
- browser based
- portable, server-free
- publishable as supplementary file
- can handle big data
The problem
The solutions so far


²

Plots:
- can only highlight certain aspects

Webservice/R Shiny:
- development overhead
- not portable (needs server or local deployment)
¹
The datavzrd solution
datasets:
  diffexp:
    path: results/diffexp.csv
    separator: "\t"

  differential_expression:
    dataset: diffexp
    render-table:
      columns:
        accession:
          display-mode: hidden
        name:
          link-to-url: "https://www.genecards.org/{name}"
        type:
          plot:
            heatmap:
              scale: ordinal
              color-scheme: category10
        F:
          plot:
            ticks:
              scale: linear
?
How to communicate derived information
Rapid text based declaration of
- datasets (n)
- views (m≥n)

Declare
- linkouts
- heatmaps
- tickplots
Define custom plots
- for individual table cells
- for entire datasets
Jump around between corresponding elements in different views
Export views to
- publication-ready figures
- Excel
filter rows and display column stats
show and hide row details
Share rows
- with mobile devices using QR codes
- via mail using data URLs

Introducing

https://datavzrd.github.io
Datavzrd Poster
By Johannes Köster
Datavzrd Poster
- 806


