


Julián Duque
Developer and Educator
Julián Duque
Lead Developer Advocate - Salesforce Heroku
node --inspect <script>
node --inspect-brk <script>
Go to
chrome://inspect
From Chrome DevTools you can debug your Node.js application by adding breakpoints, controlling the step-by-step execution, and explore variables and call stack
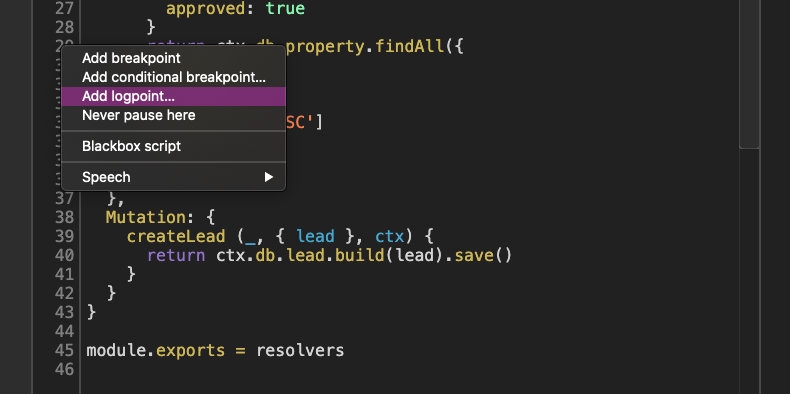
Instead of adding console.log you can add Logpoints as if they were breakpoints and they will be logged during debugging.
From DevTools you can also profile the memory of your application to learn more about allocation, and hunt down memory leaks.
kill -USR1 <pid>
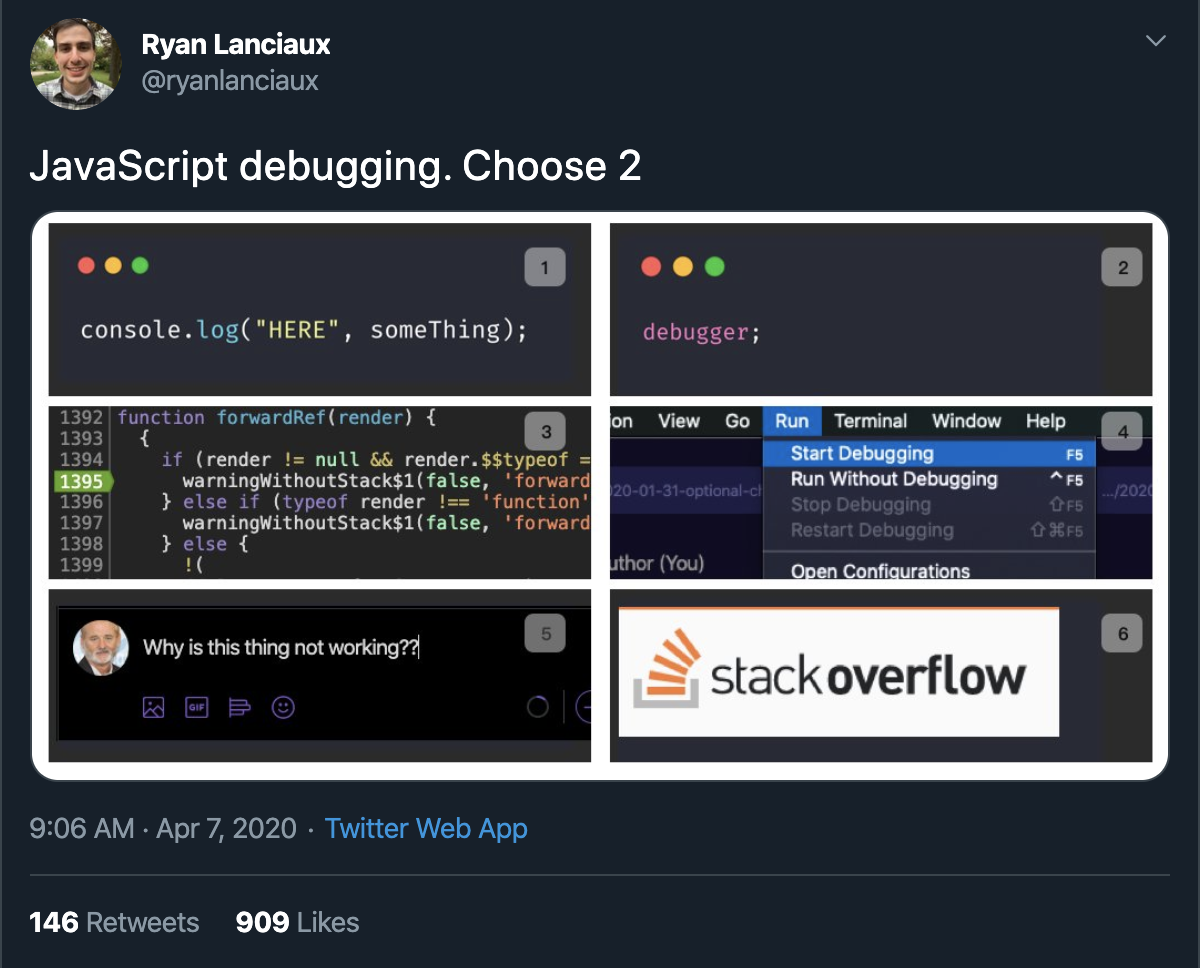
debugger;
Visual Studio Code supports the V8 inspector protocol and it is a great tool for local and remote debugging.
Other IDEs like WebStorm and Atom also support this protocol, use the tool you are most used to.
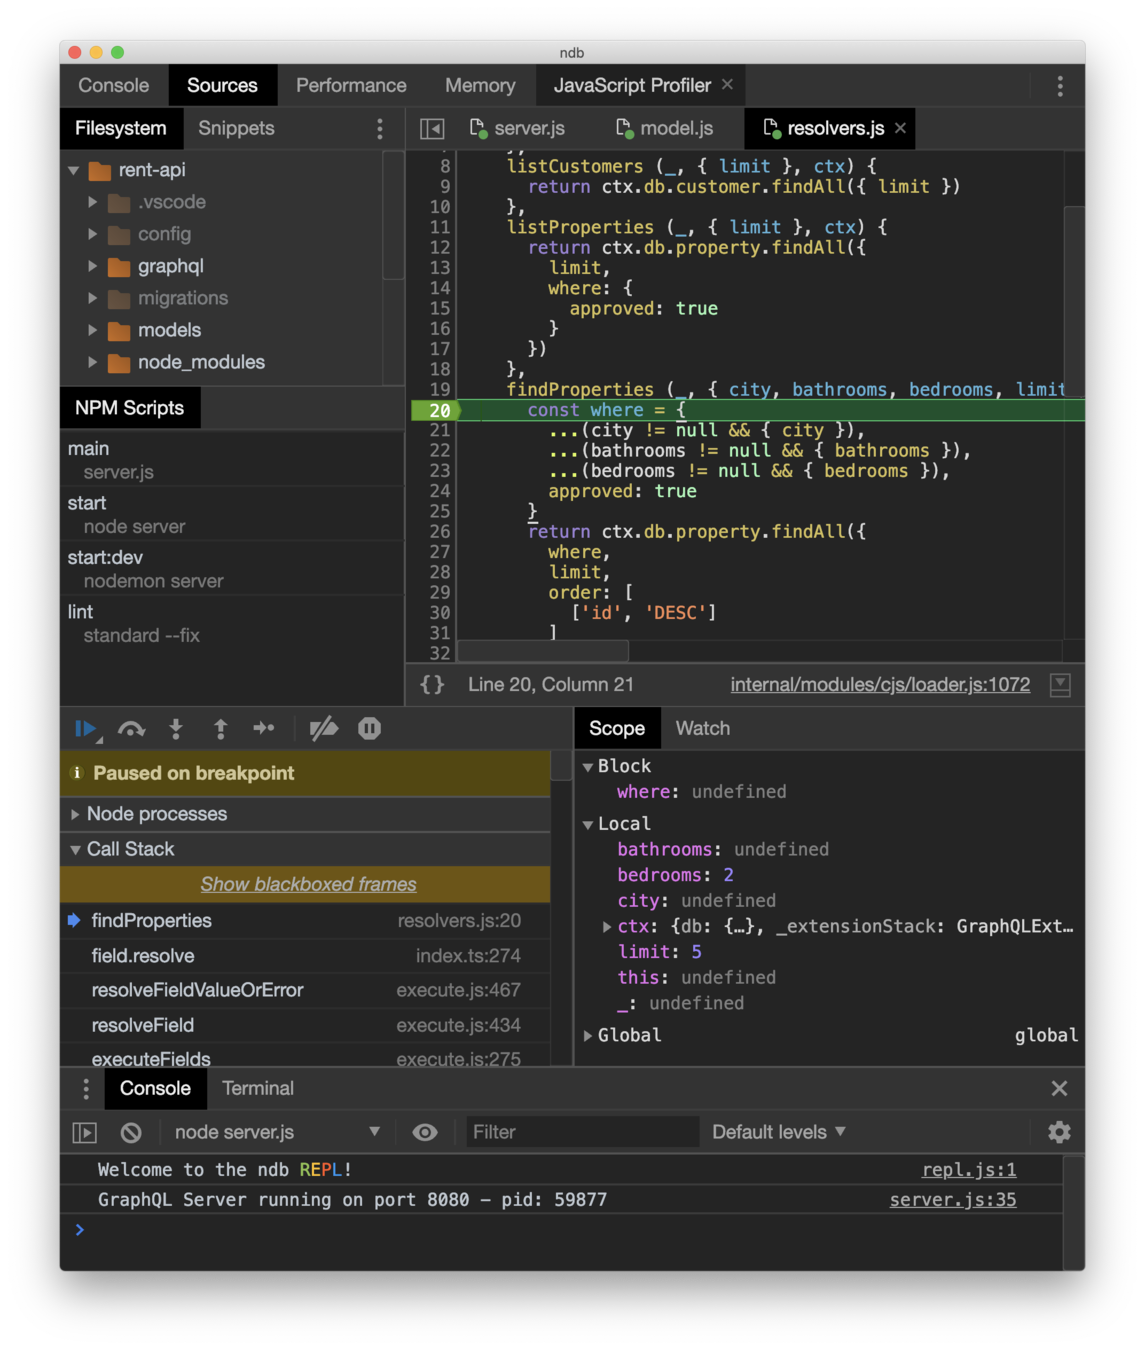
It is a Chromium-based, standalone Node.js debugger by the ChromeLabs team with extra features that Chrome Inspector doesn't support out of the box
$ npm install -g ndb
npm install -g llnode
llnode `which node` -c core.dump
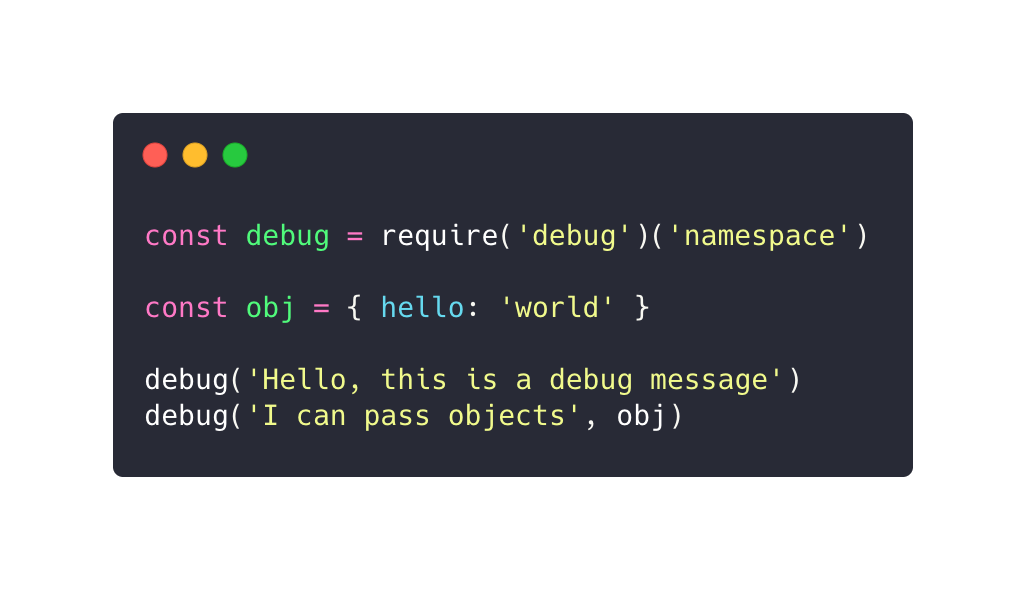
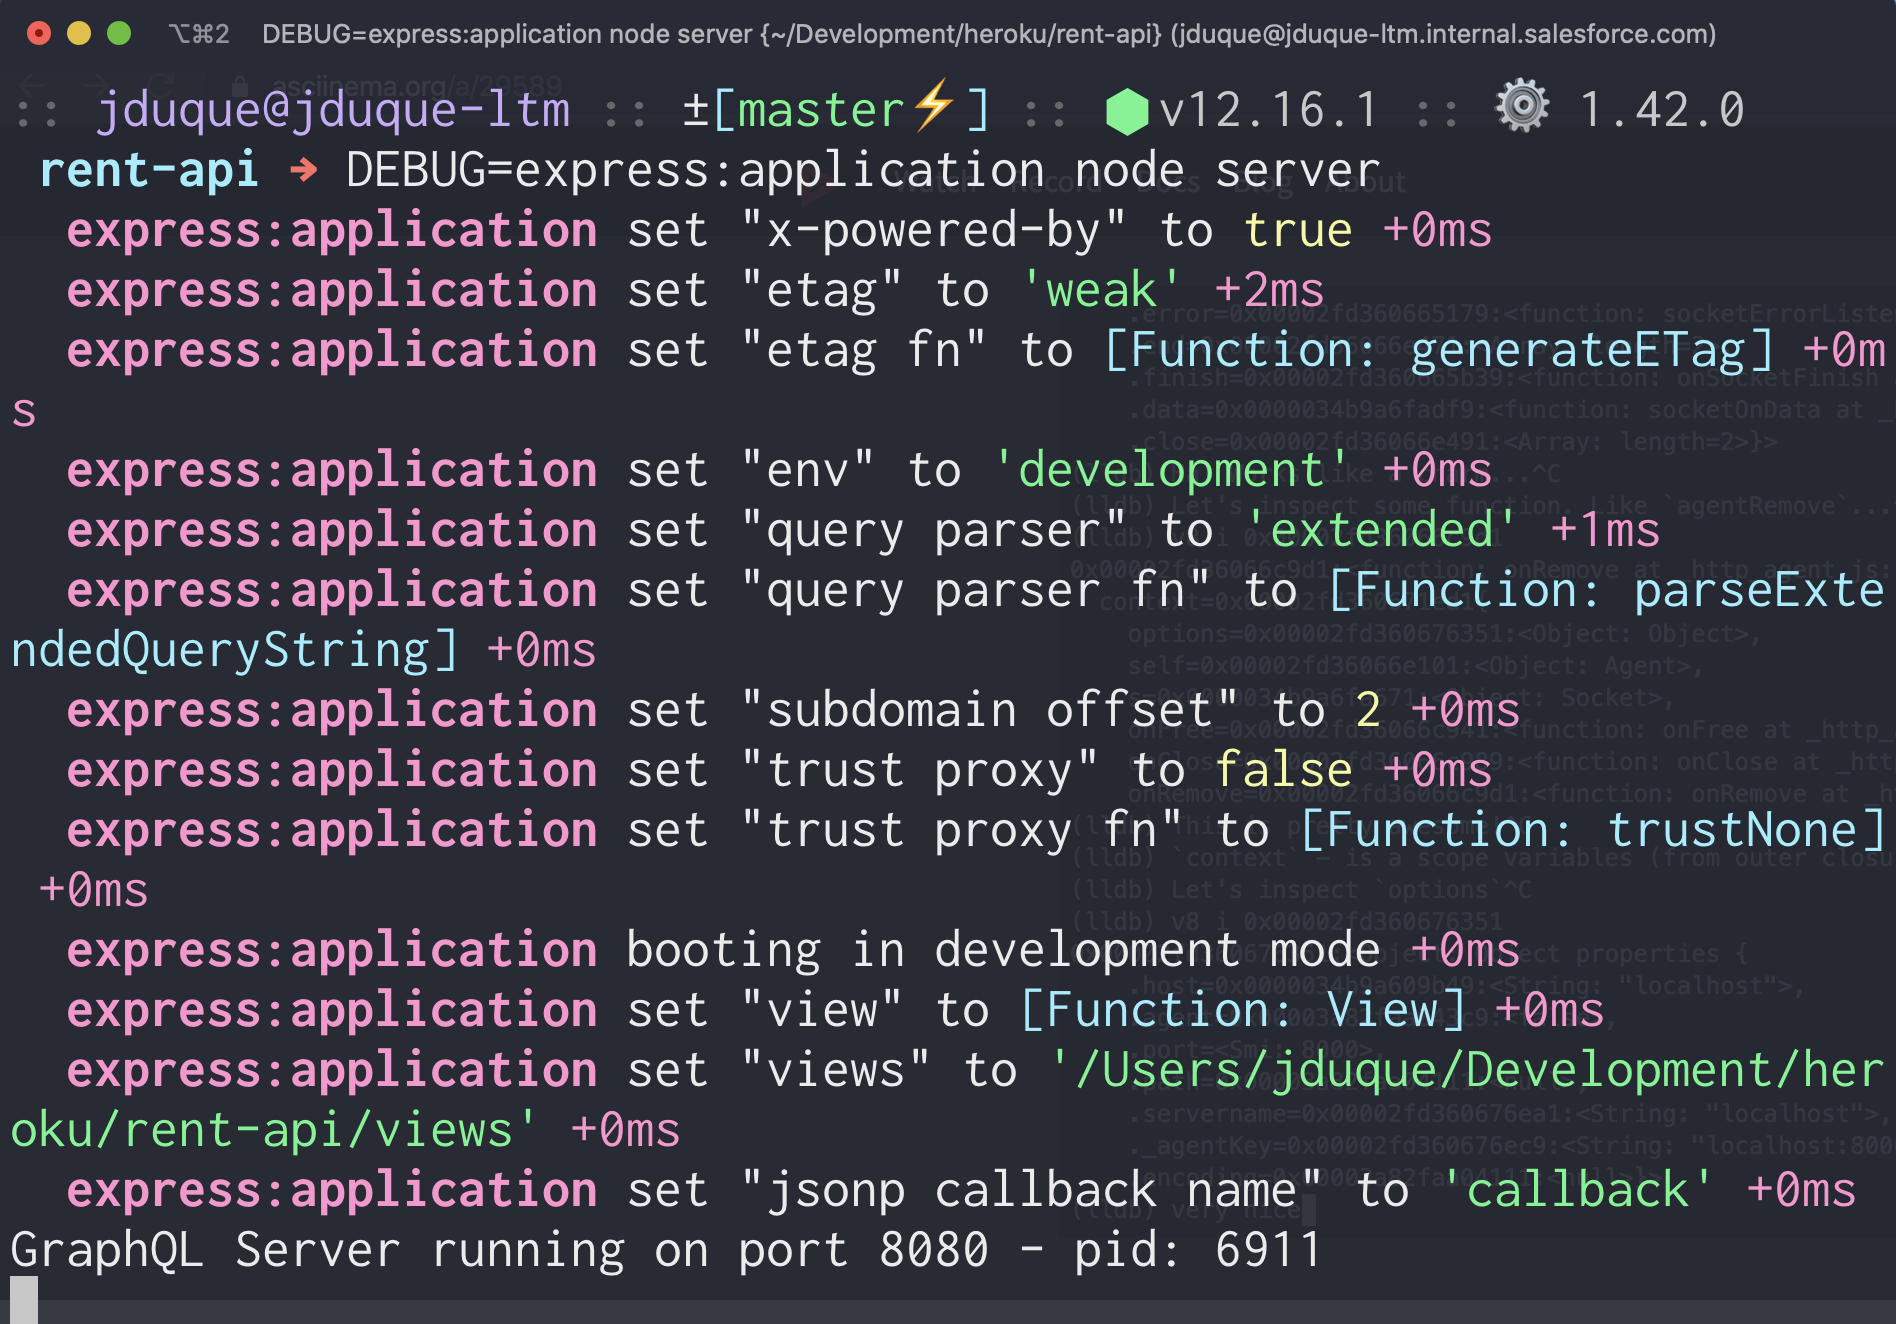
Allows you to have a console-based debugger that can be enabled by using an environment variable
$ npm install debug
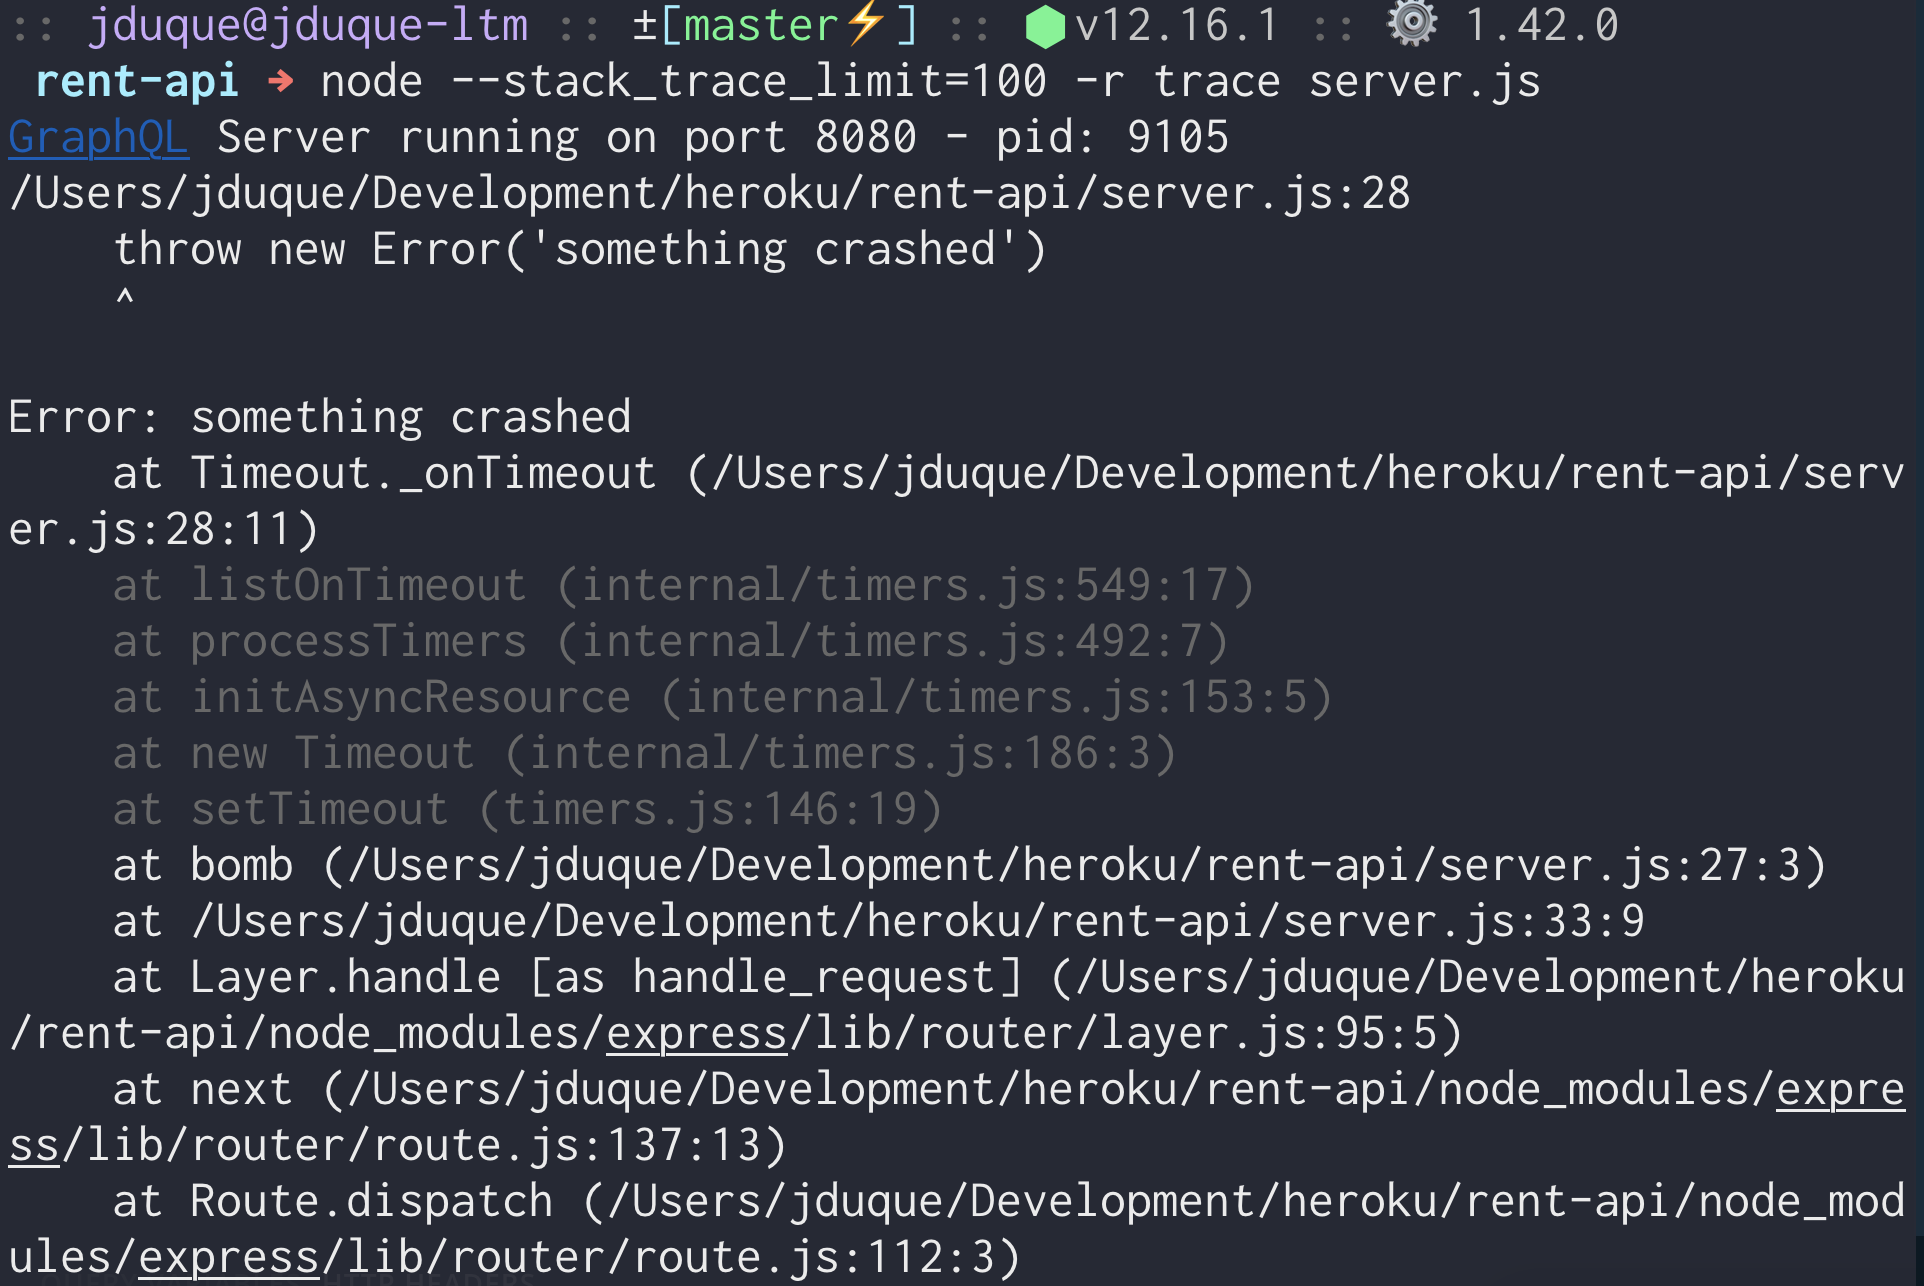
trace: Augment your async stack traces
clarify: Removes node internals
$ npm i --save trace clarify

$ node --stack_trace_limit=100 -r trace server.js

$ node --stack_trace_limit=100 -r trace -r clarify server.js
By Julián Duque
Introduction to Node.js Debugging, tooling, and techniques.


