
Teaching Economics to the Generation Z
Fatih Kansoy
A Personal Experience


Beginning: Start with Story a Narrative Approach
Ending: Holistic View and Interactive Summary
Connect Real and Current World
Customised Engagements - In and Out of Class
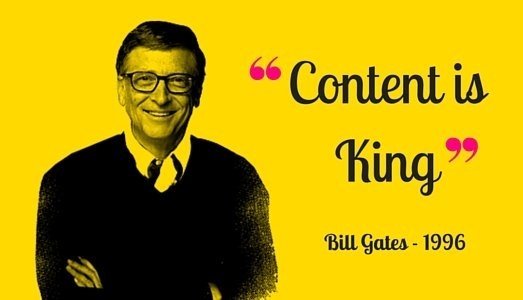
Quality Content is King

Never Start
Directly
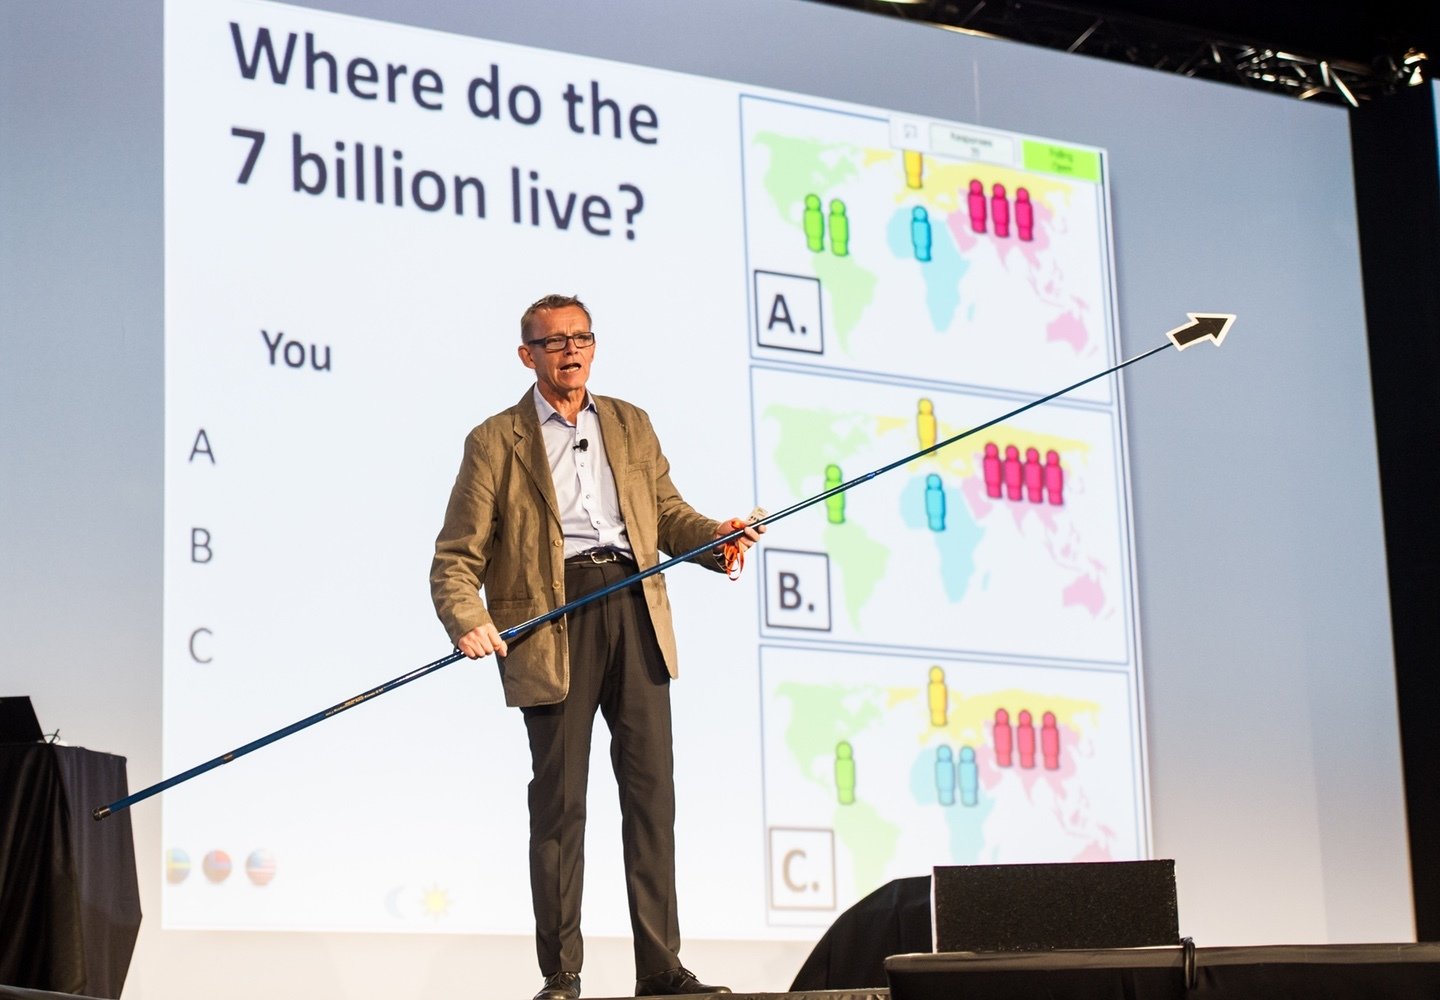
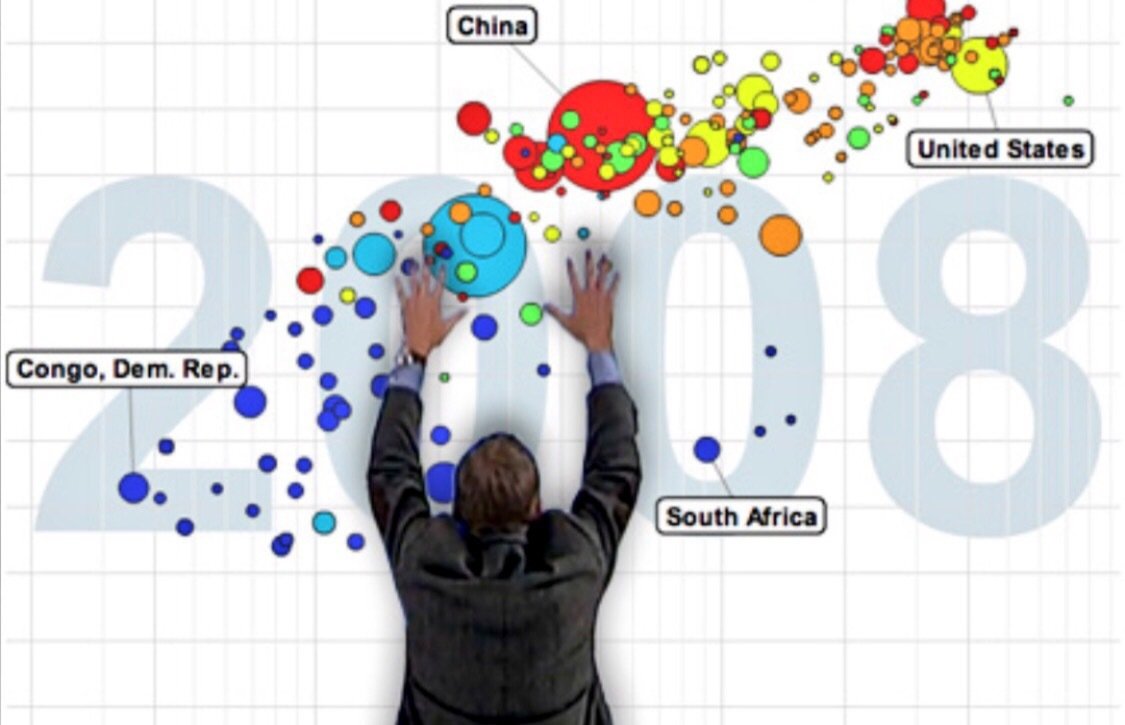
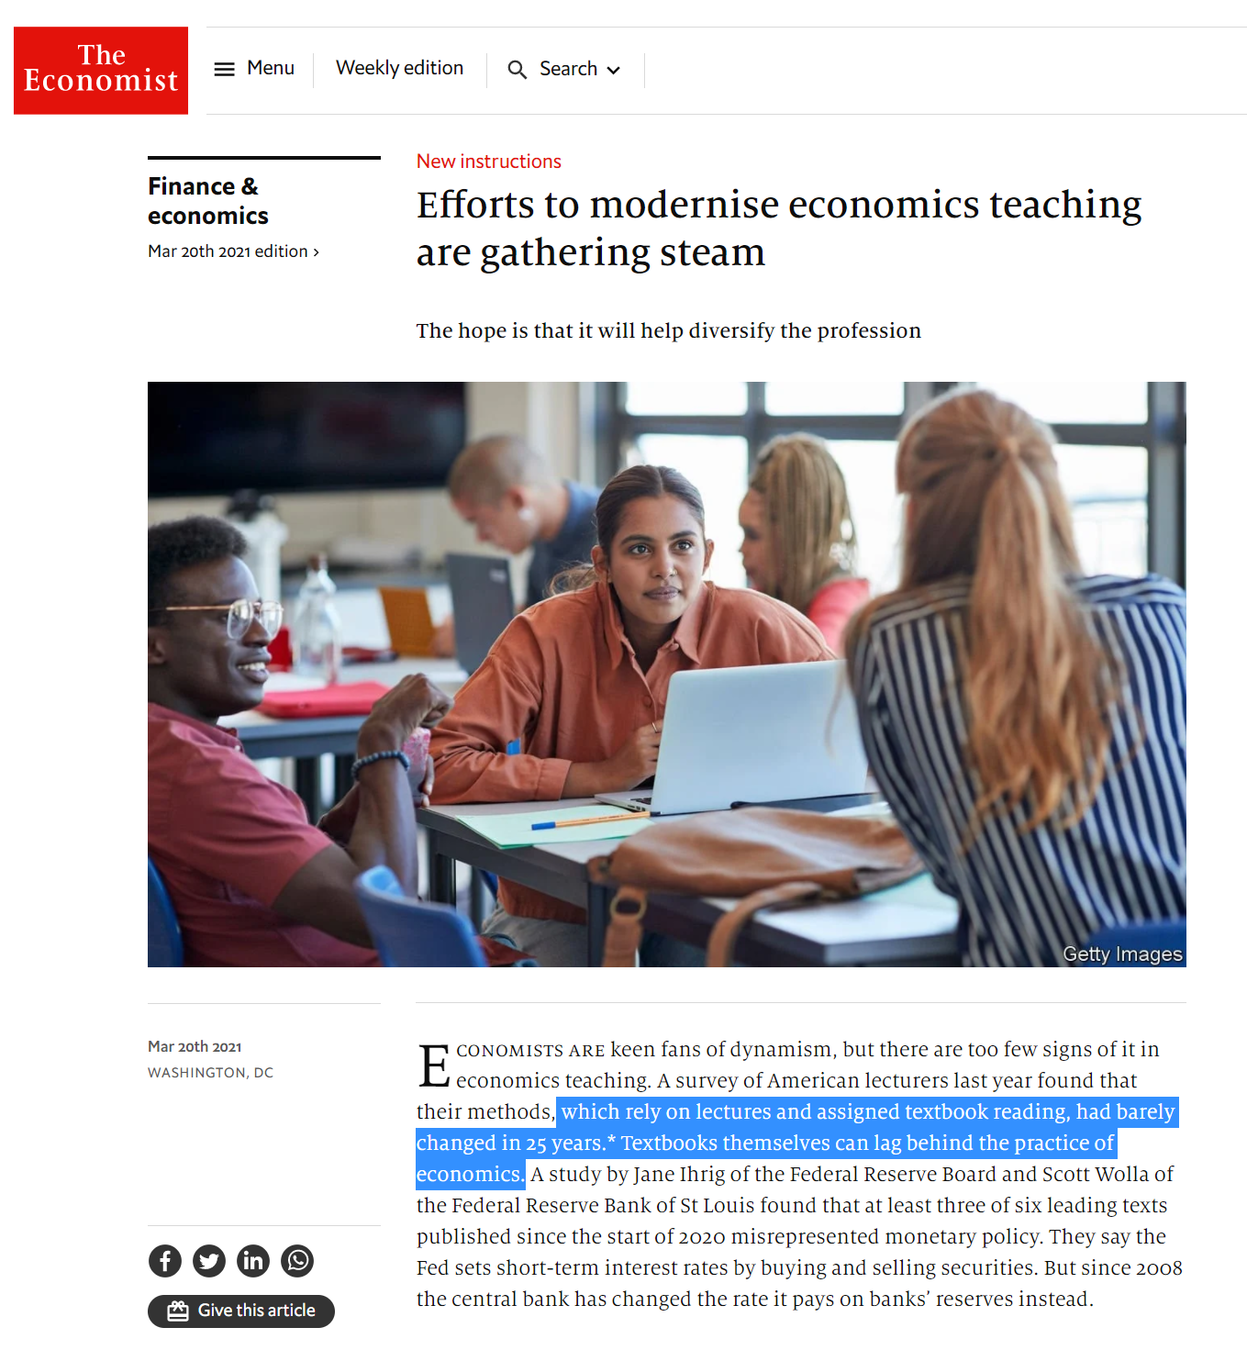
Why do educators in economics not learn from Hans Rosling?
-
Hans Rosling changed data presentation 15 years ago
-
"Edutainment"
-
Viewed more than 20-million
-
Nothing new in data but presentation.
-
But in our lectures we still use ONLY PowerPoint/beamer/PDF
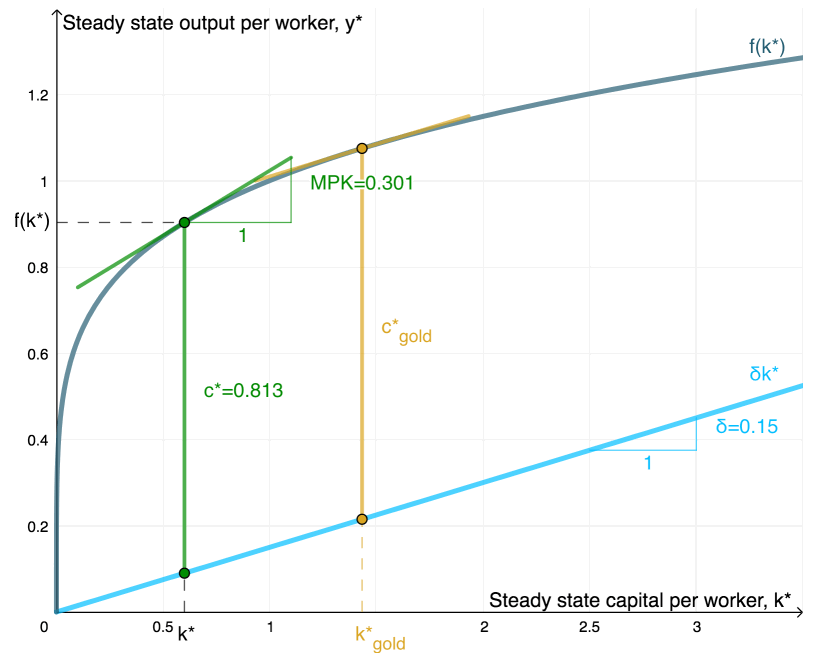
Let \(K_t\), \(I_t\), and \(\delta\) are the aggregate capital, investment and depreciation rate at time, respectively.
Formally, capital accumulates according to:
$$ K_{t+1}= I_{t} + K_{t} - \delta K_{t}$$
Then...
Starting with equations...
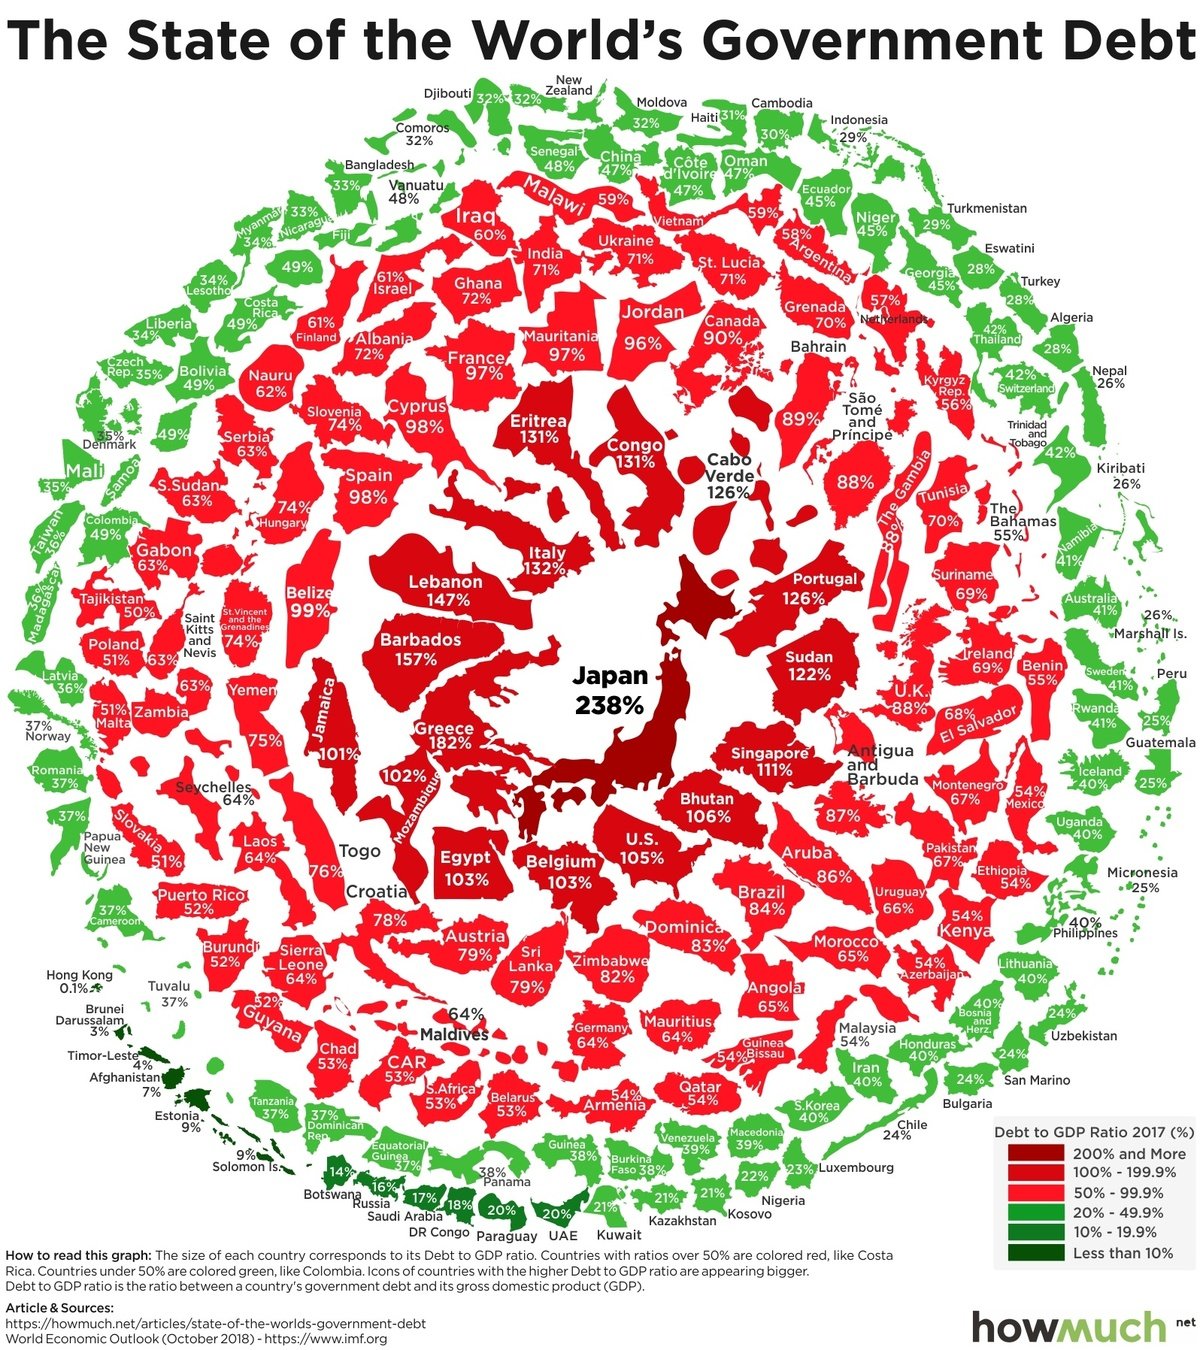
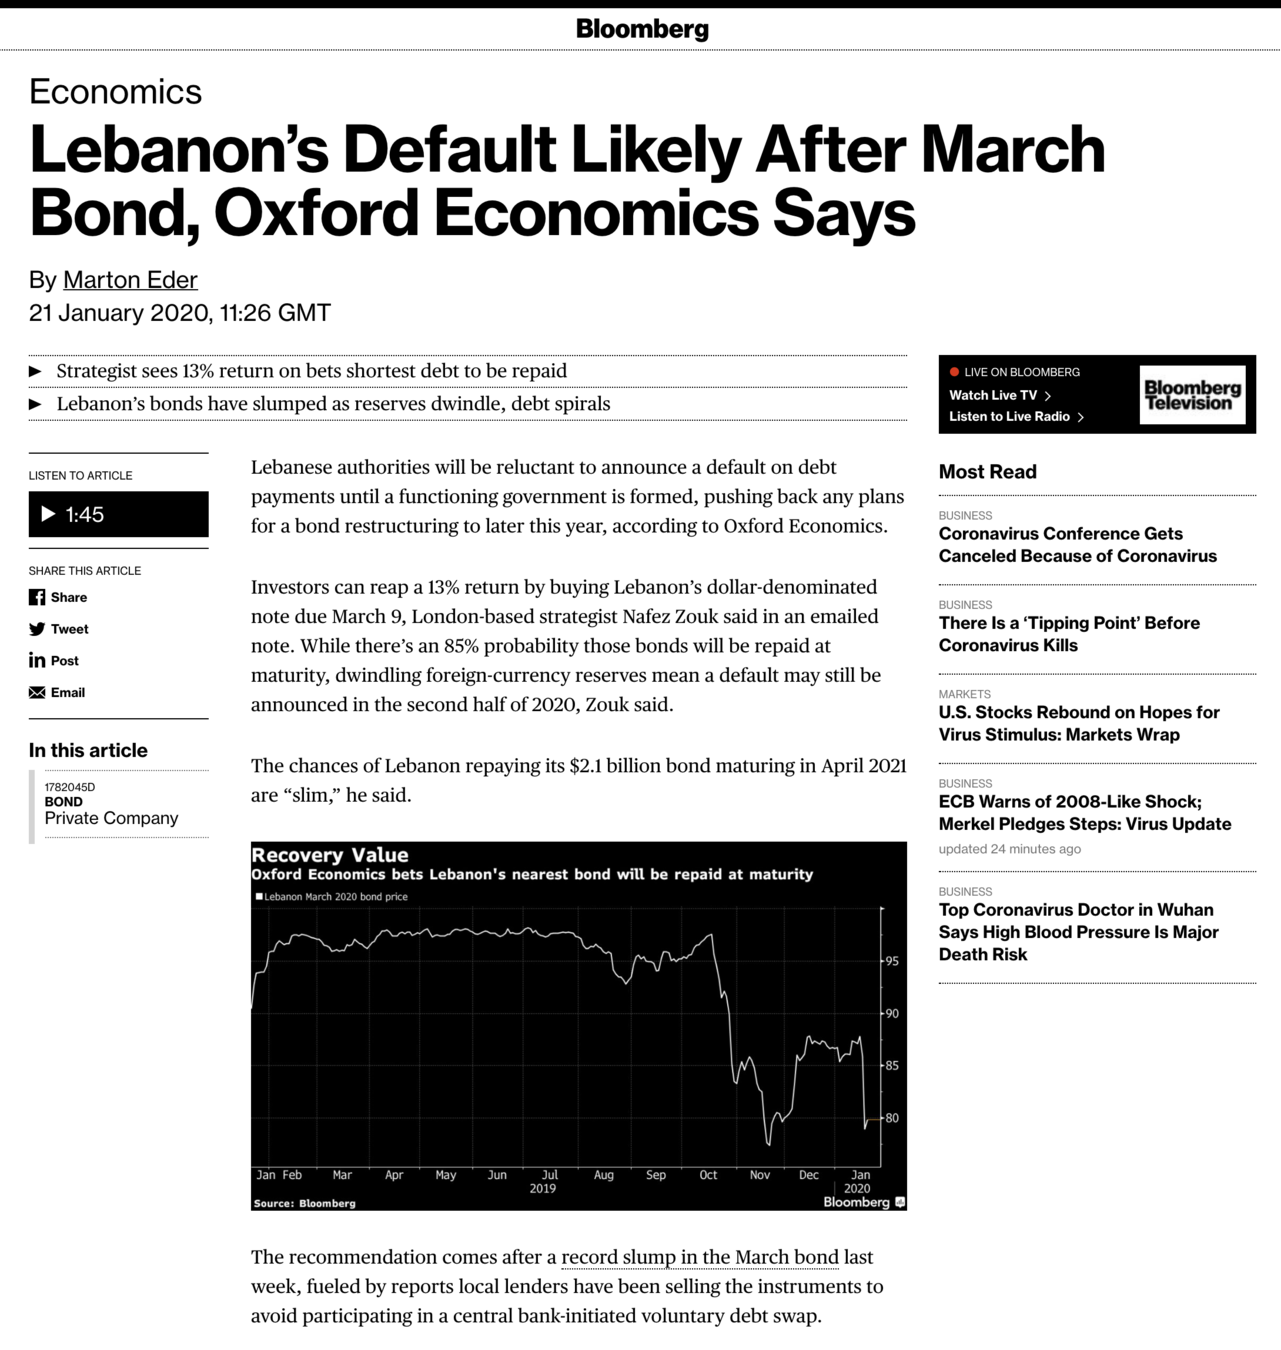
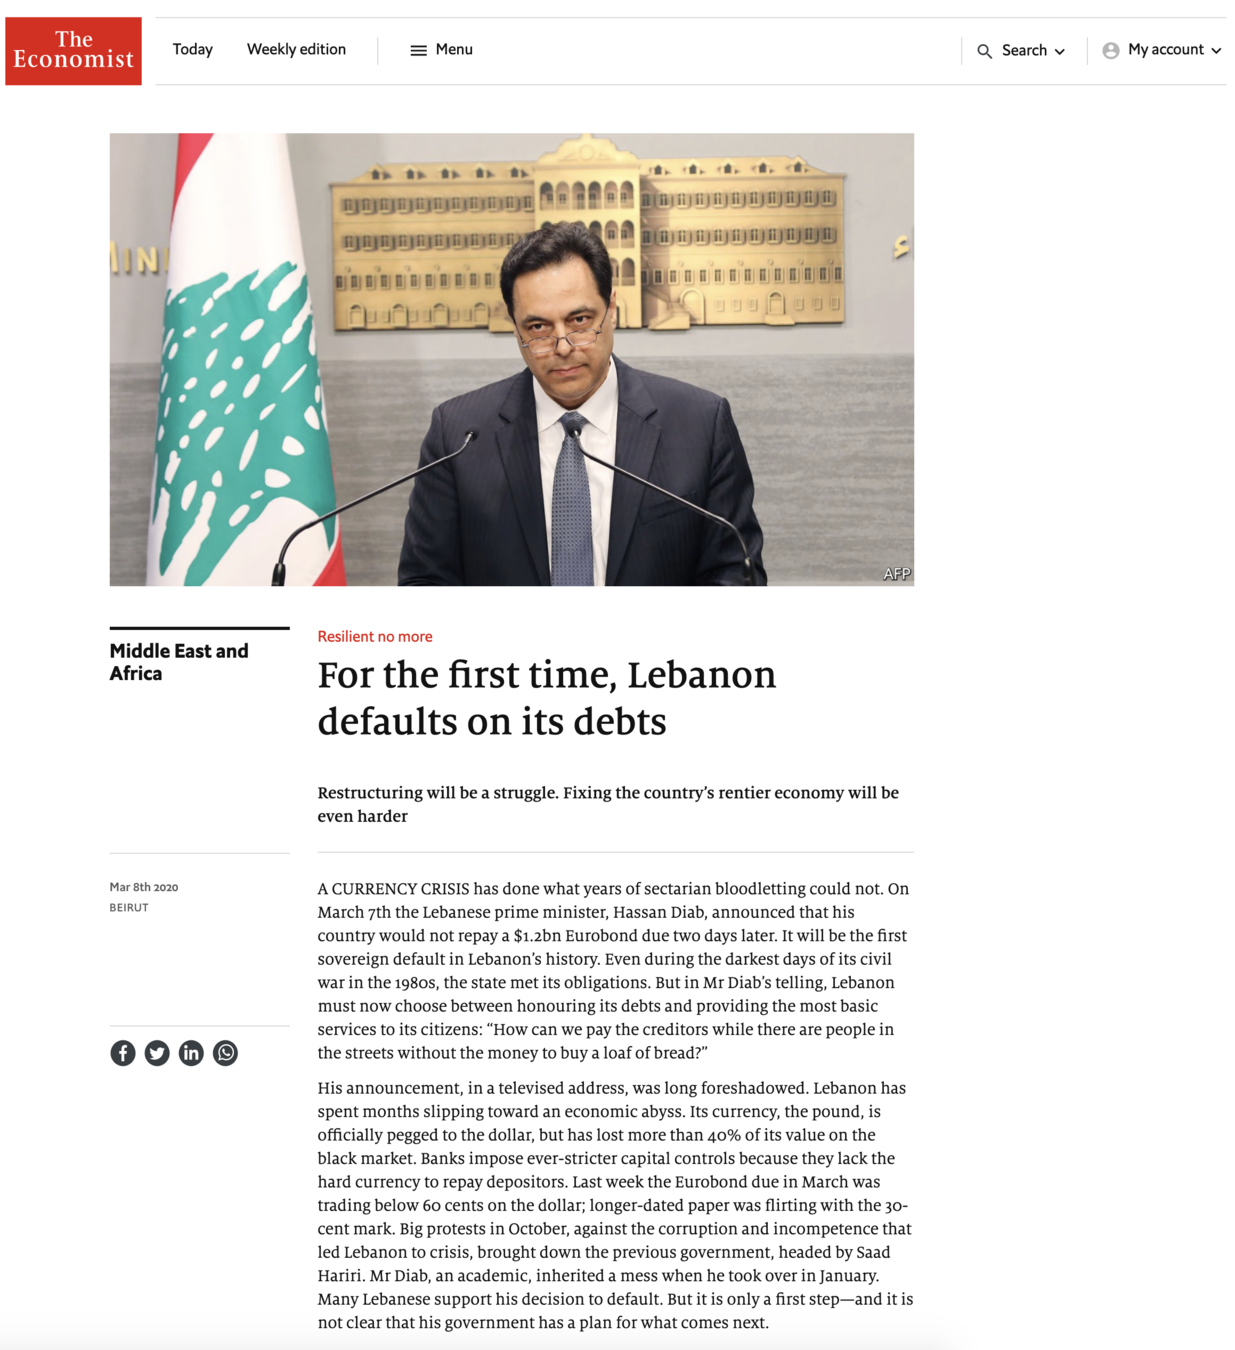
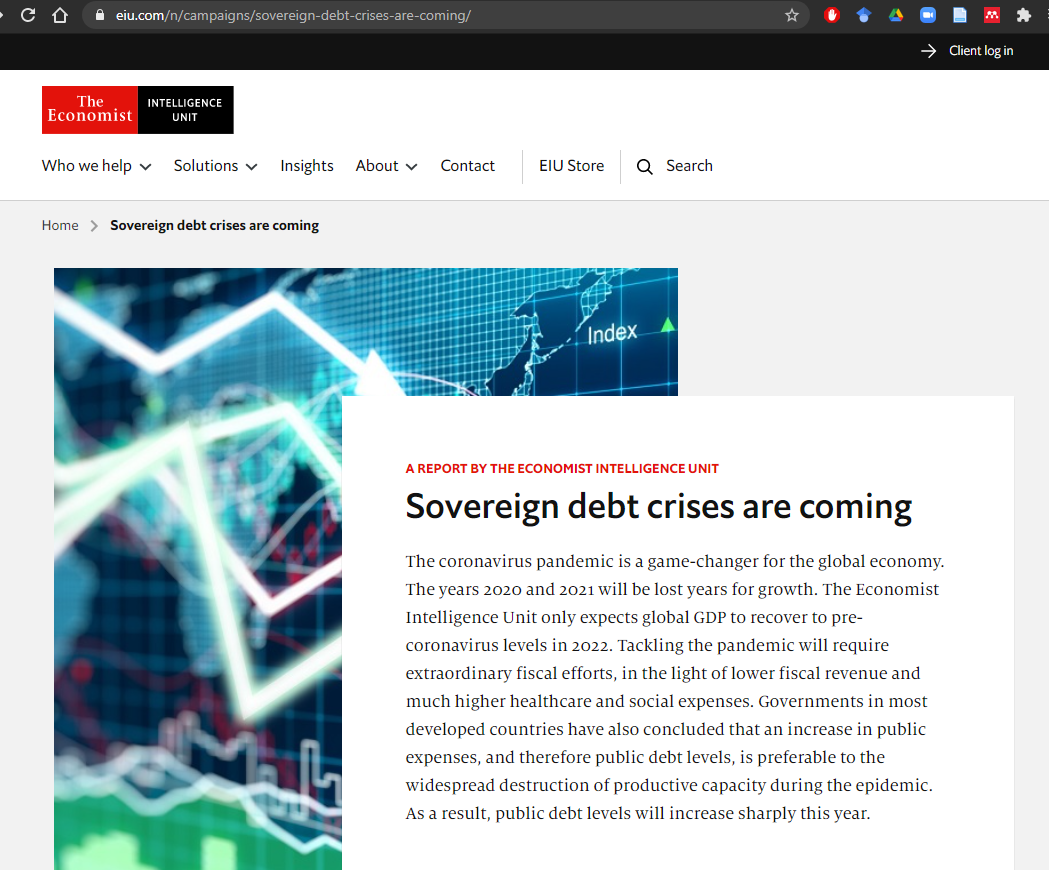
Show historical background
Show the Recent Story
Show the Current Situation
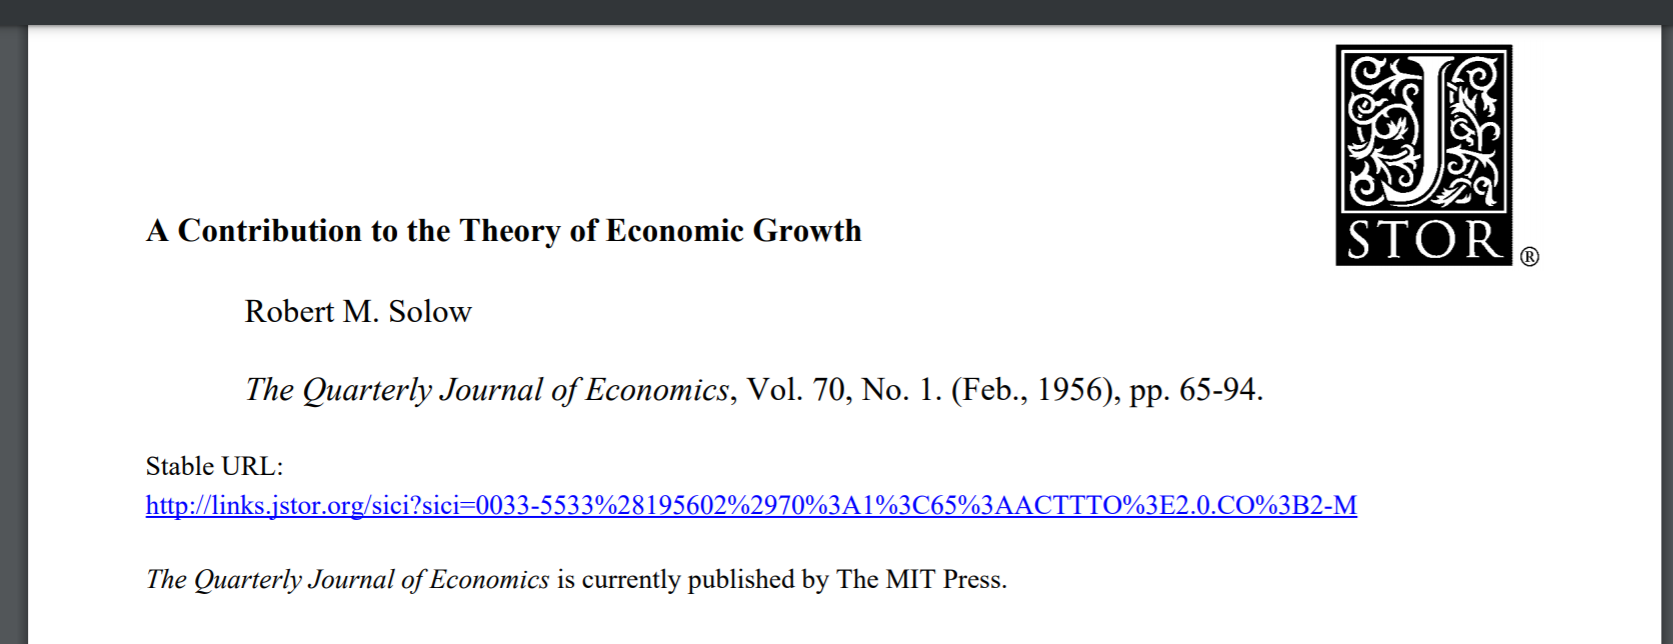
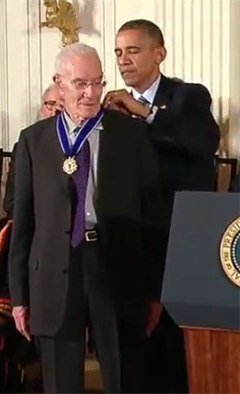
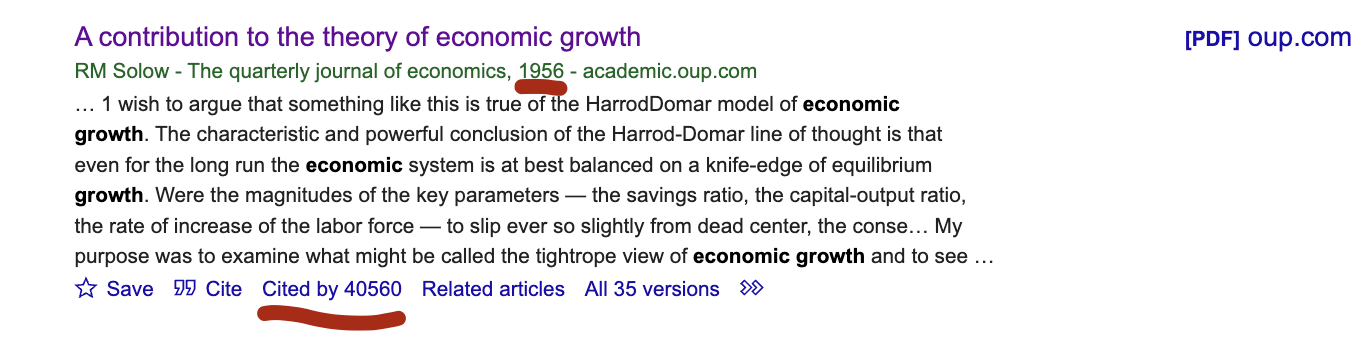
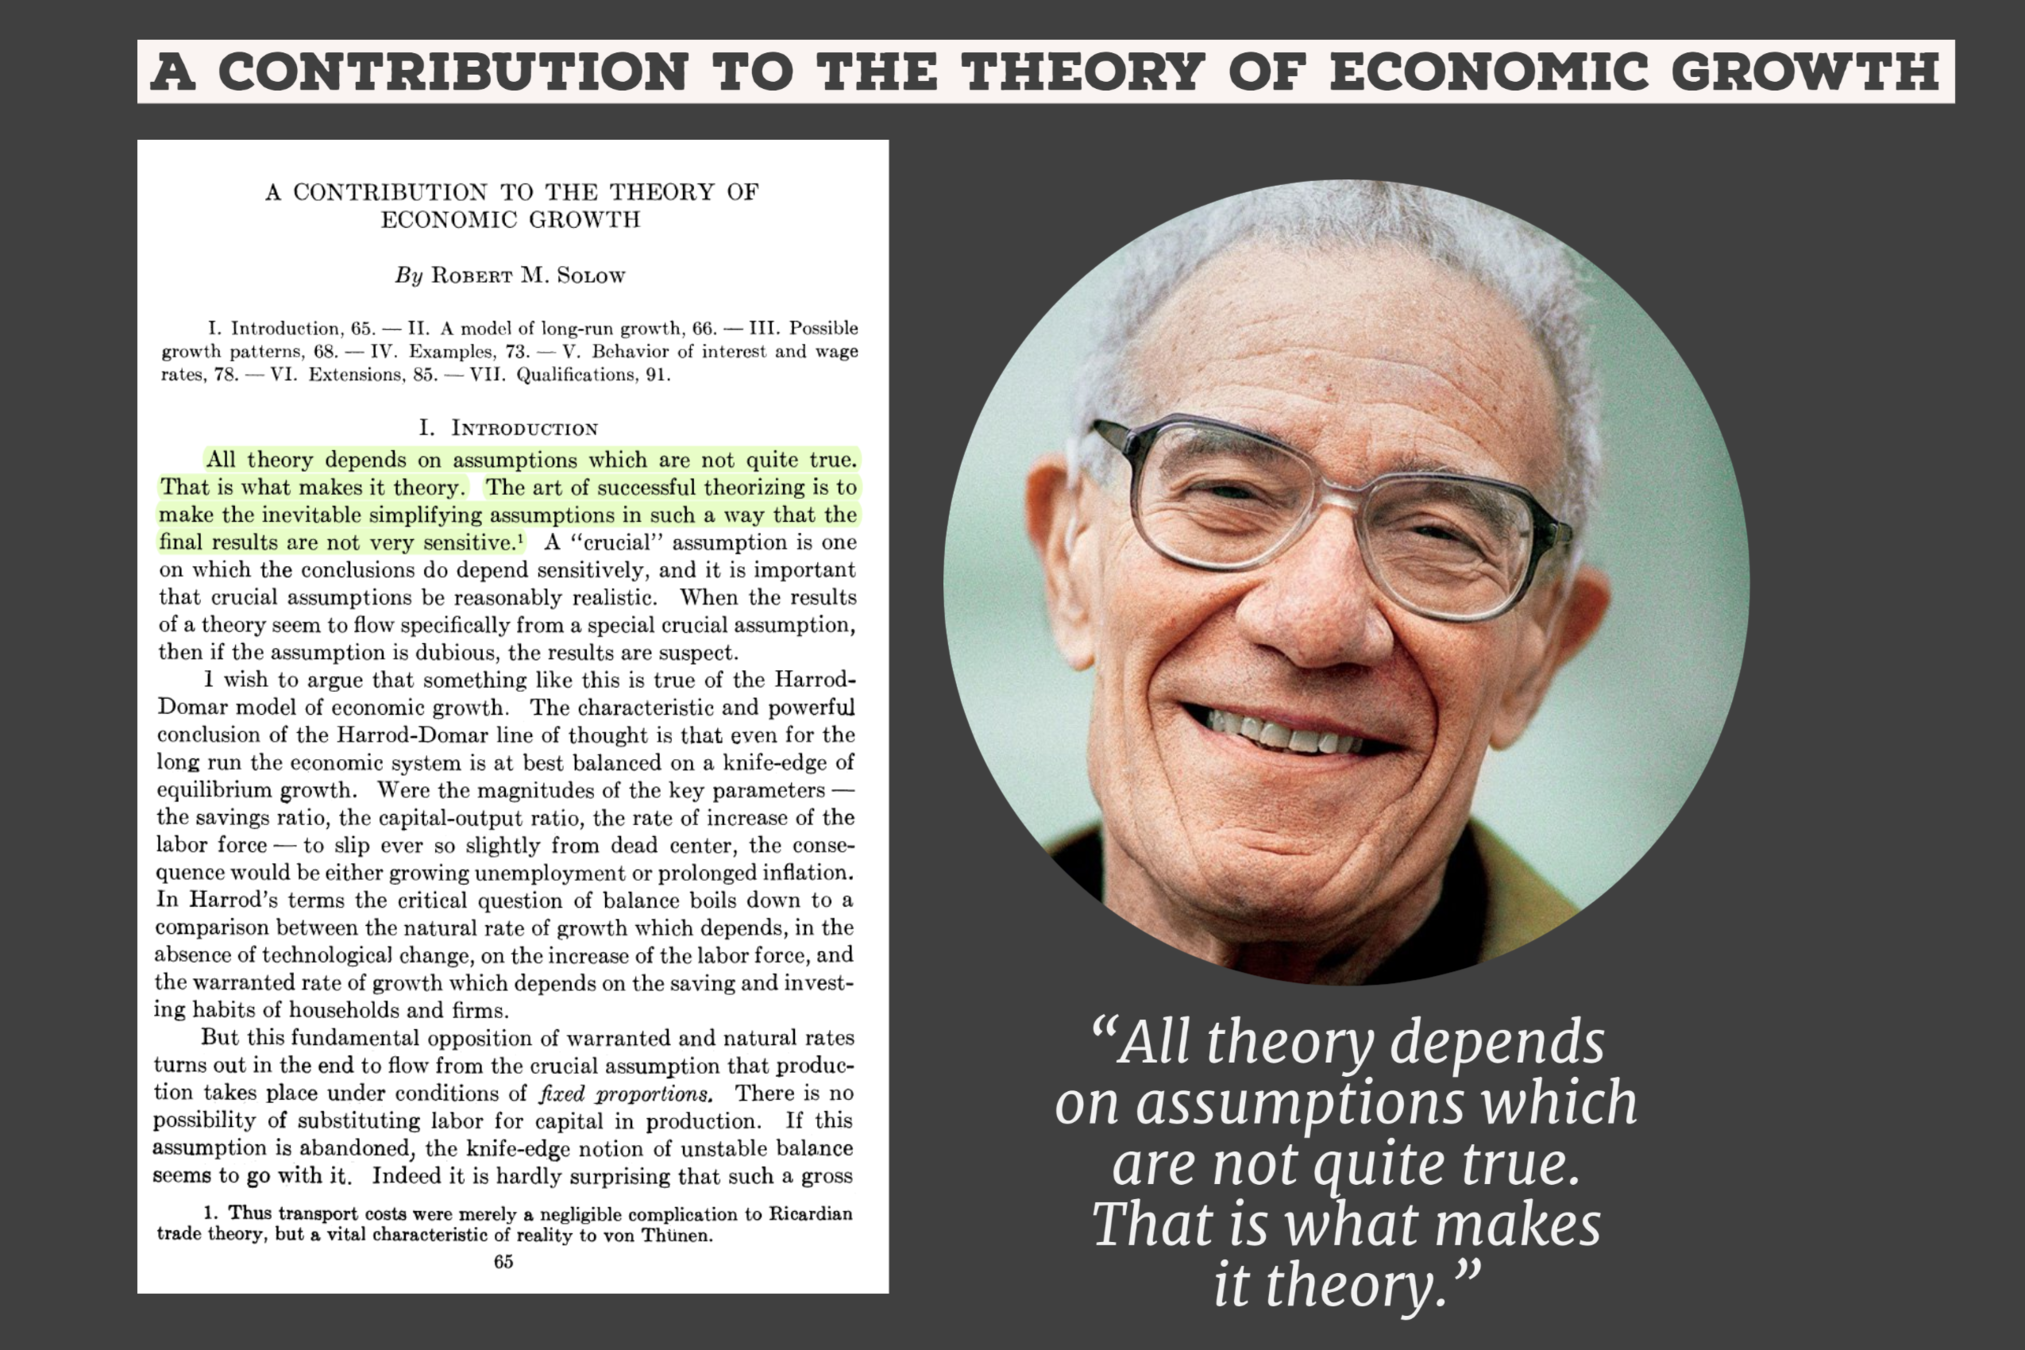
A Contribution to the Theory of Economic Growth
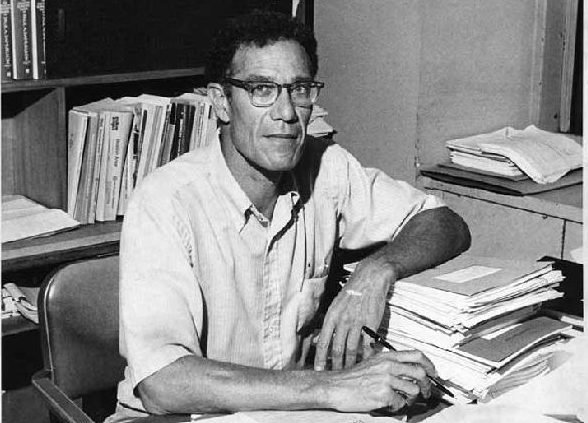
1956
Now we can start with equations...
Let \(K_t\), \(I_t\), and \(\delta\) are the aggregate capital, investment and depreciation rate at time, respectively.
Formally, capital accumulates according to:
$$ K_{t+1}= I_{t} + K_{t} - \delta K_{t}$$
Then...
Never Finish
Directly
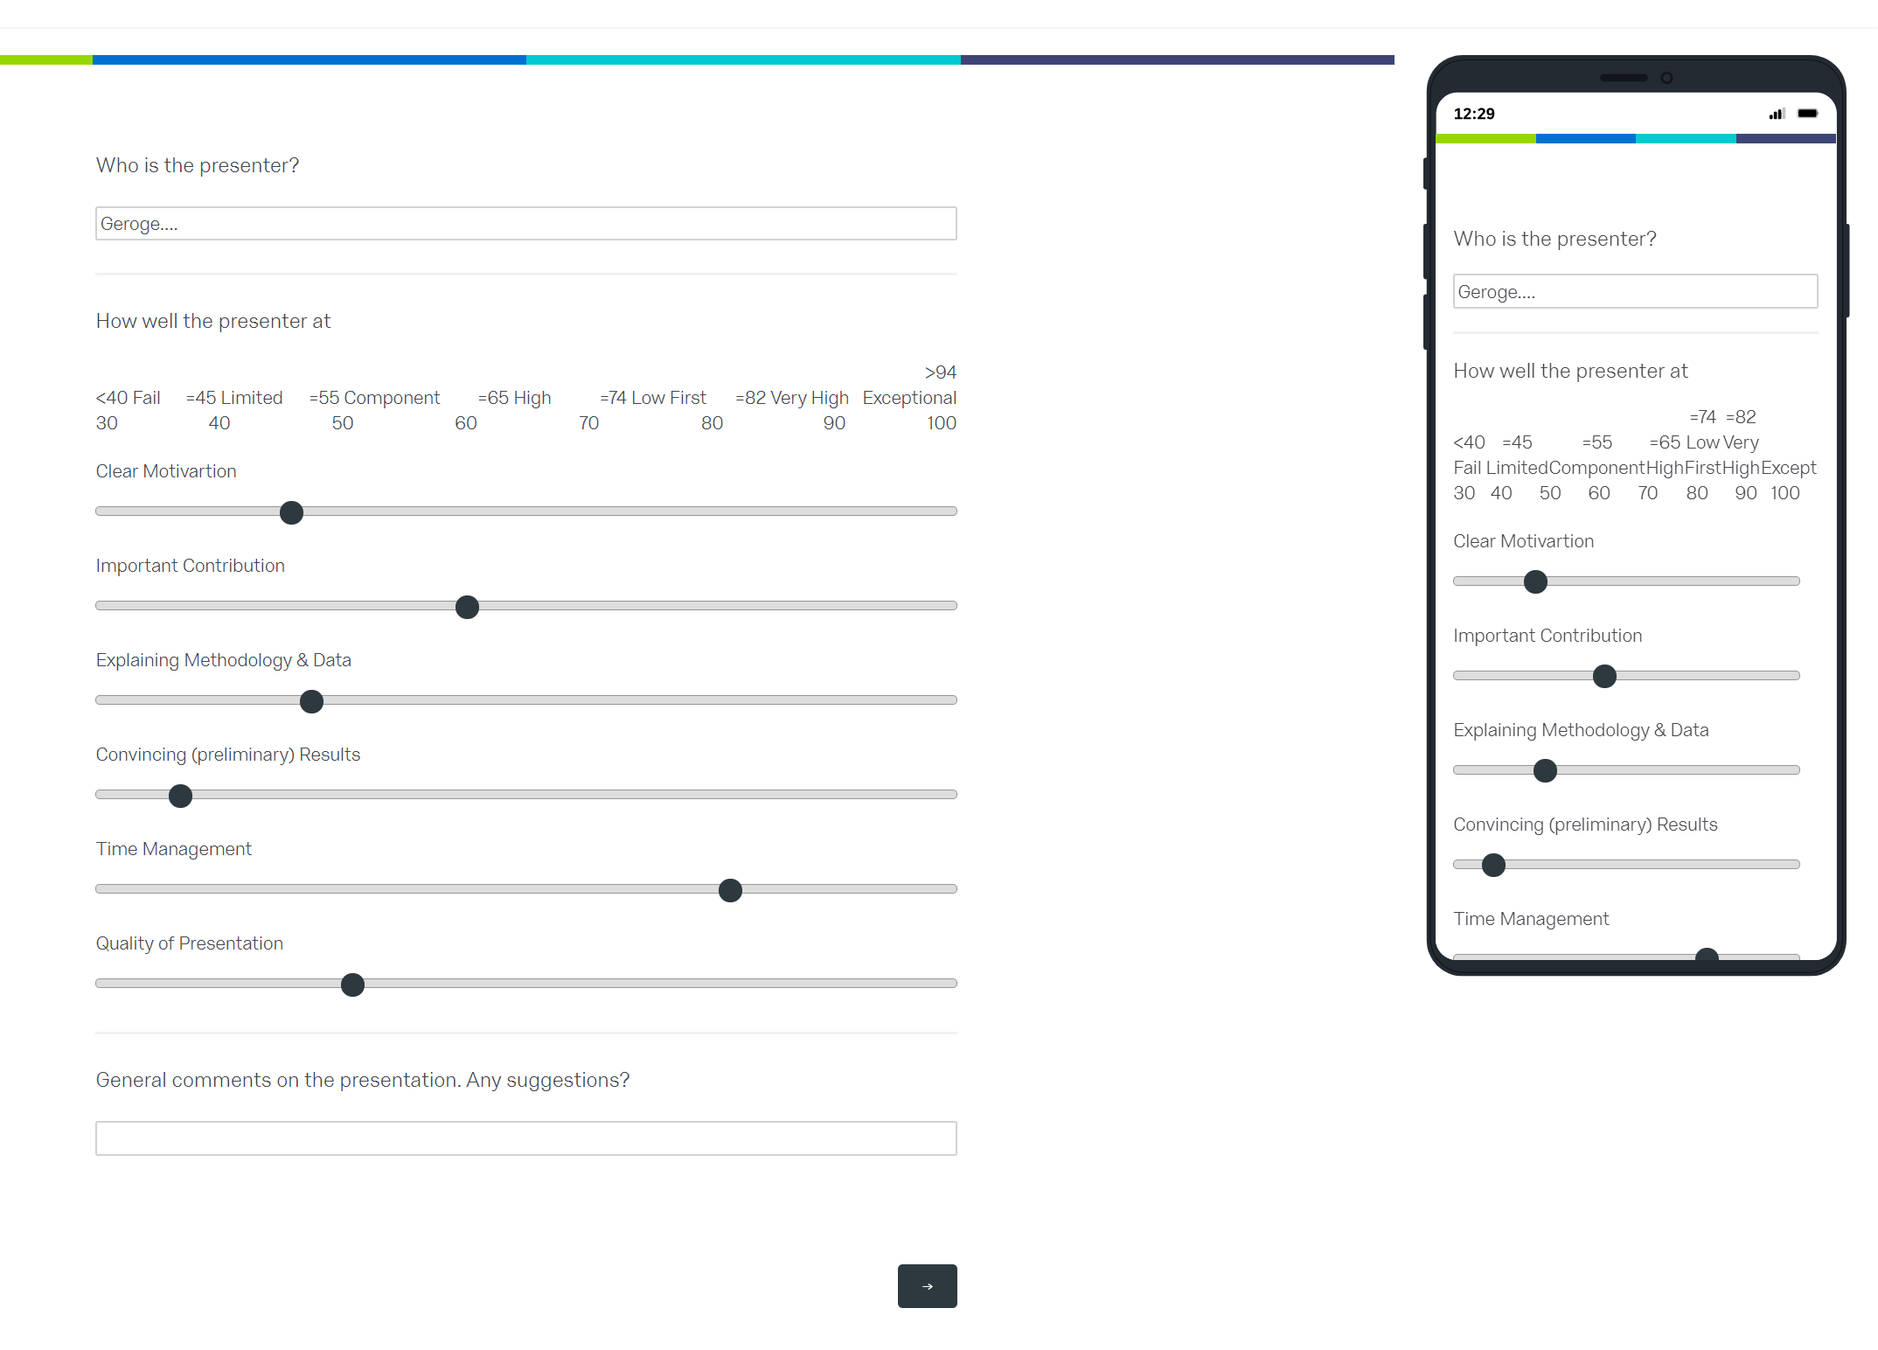
To have a holistic view at the end of each lecture/class provide an interactive summary

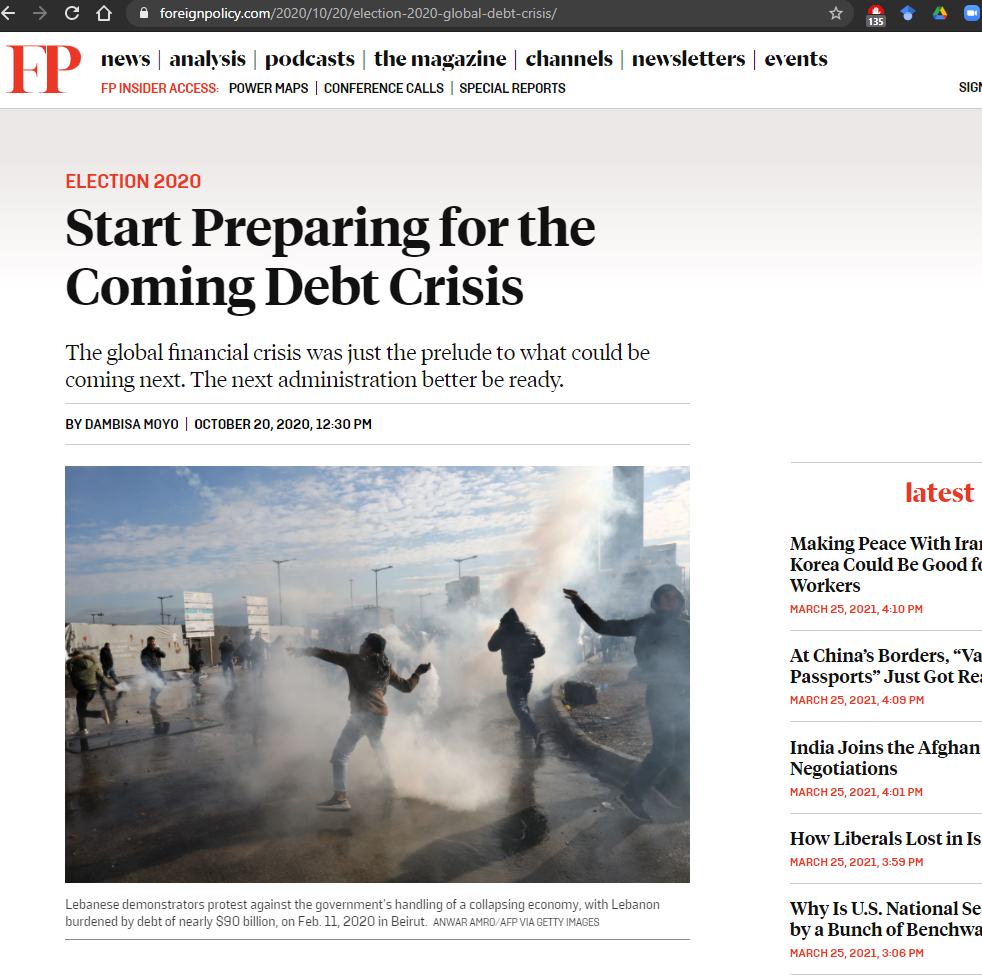
Connect Real and Current World
Students deserve more than what textbooks provide
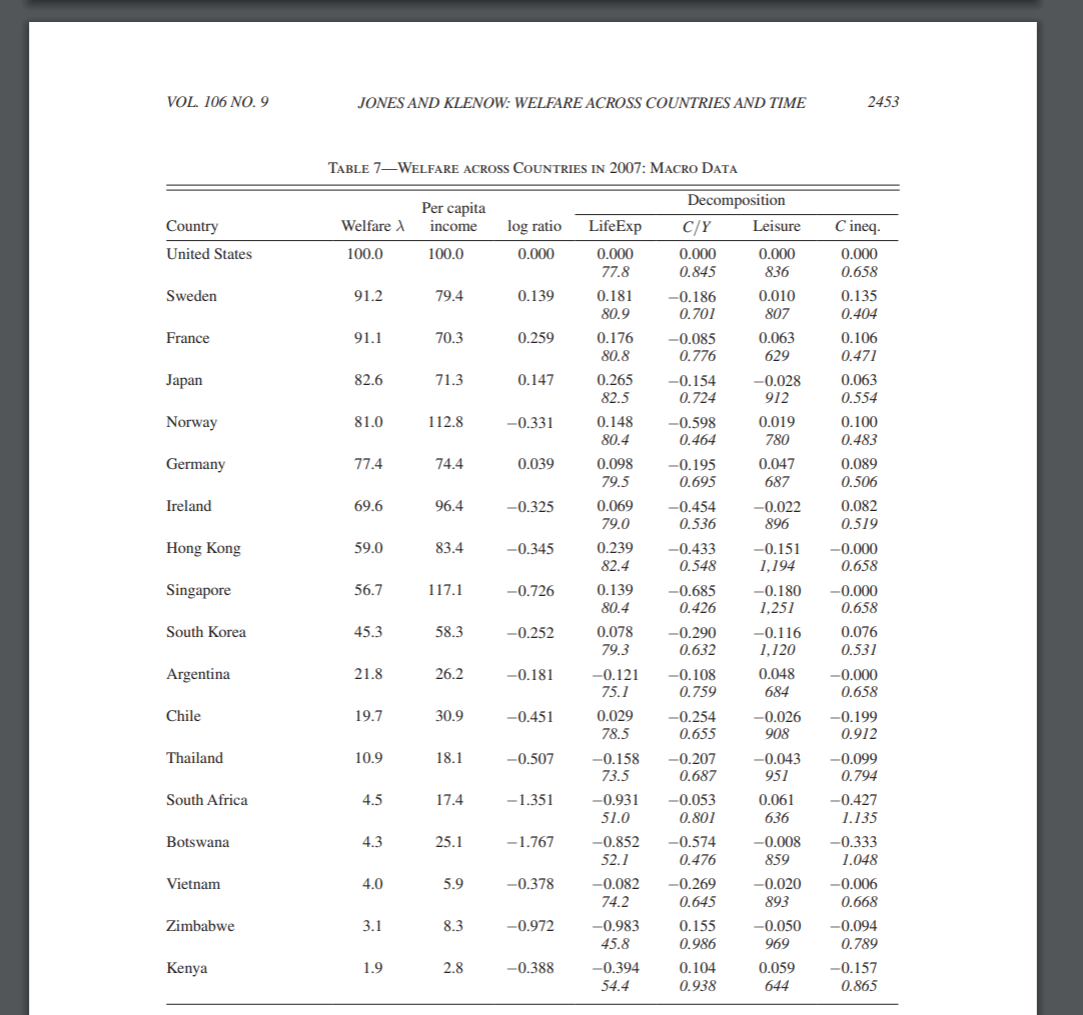
Connect Recent Research
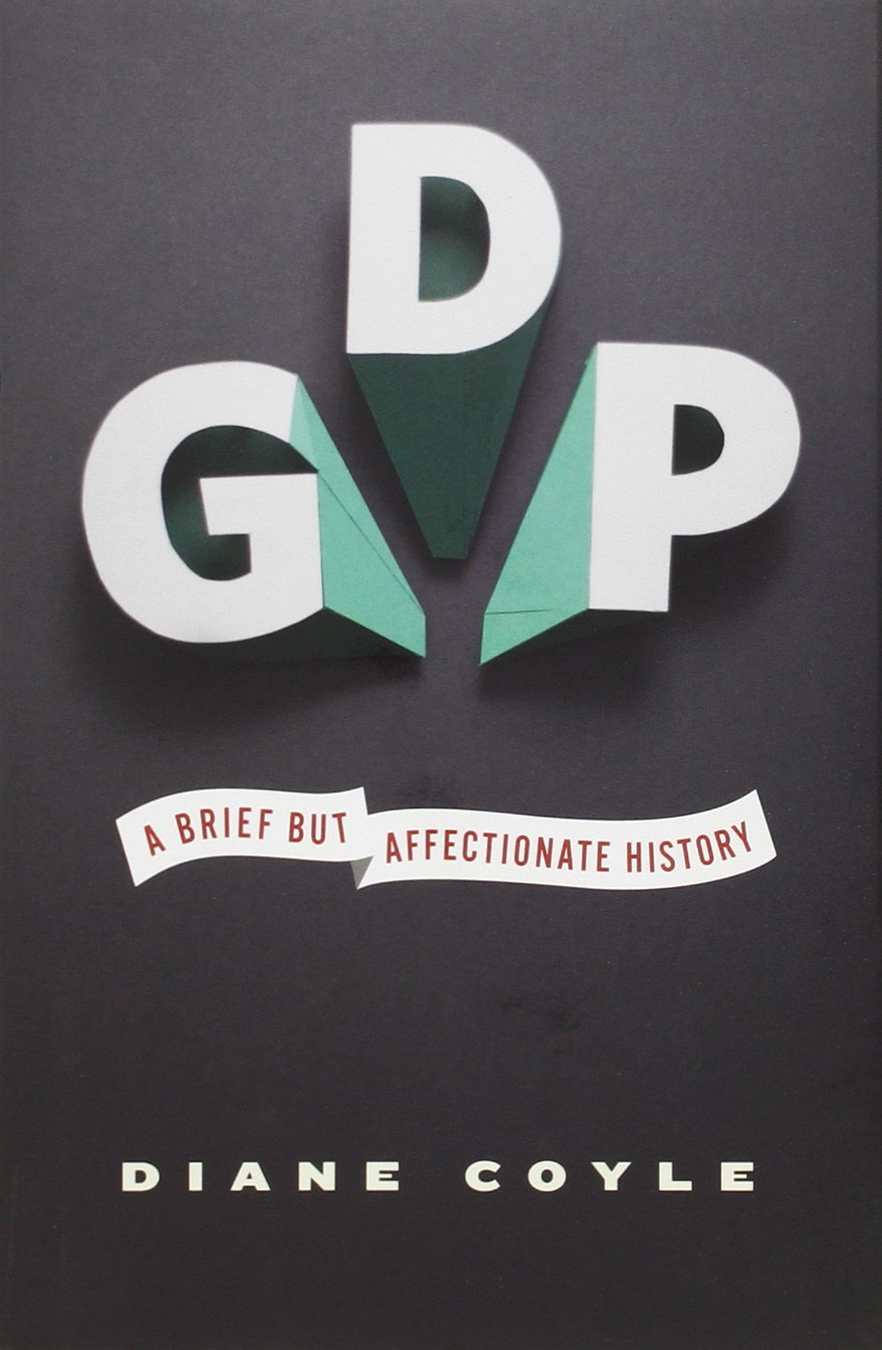
The book ends by making the case that GDP was a good measure for the twentieth century but is increasingly inappropriate for a twenty-first-century economy driven by innovation, services, and intangible goods.
Tangible Economics: New and Non-Academic Journal
This Year
Engagements
In-Out of Class
In Class
Democratisation and Participation
Answers are not important but question
In Class
In Class
Answers can be differentfor the different case

Background=Billboards for Your Message

Different tool for Different Purpose
Out of Class

The same tool but different result
Out of Class
Out of Class
Content Quality
Matters
Visual


Learn the tools


Have the tools
Being youtuber is hard!


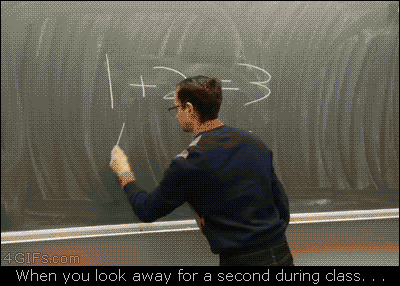
Fig.1: Draw two circle
Fig.2: Draw the rest of the damn owl
Use the Same Language
-
I am going to use the Panel data model with year and state fixed effects.
- Identification comes from exogenous law changes
Be Explicit
Be Explicit
\(\blacktriangleright\) Panel data model with year and state fixed effects.
$$ y_{i,t}= \alpha_{i} + \gamma_{t} + \beta X_{i,t} + \epsilon_{i,t} $$
with
\(-\) \( y_{i,t}\) average wage in state i , year t
\(-\) \( \alpha_i\) state fixed effect.
\(-\) \( \gamma_t\): year fixed effect
\(-\) \( \epsilon_{i,t}\): error term
\(\blacktriangleright\) Identification comes from exogenous law changes
$$E(\epsilon_{i,t} | X_{i,t}, \alpha_{i}, \delta_{t})=0 $$
i.e. law changes are exogenous conditional on fixed effects

Be Explicit
-
I am going to use the Panel data model with year and state fixed effects.
- Identification comes from exogenous law changes

Make sure your audience can read your slides,
so check your font size
Please pay attention, this is a very important point etc...
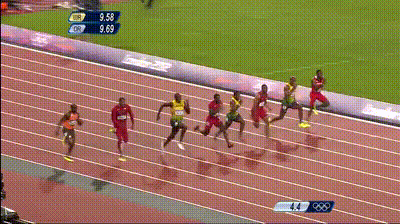
Utility Function and Husein Bolt
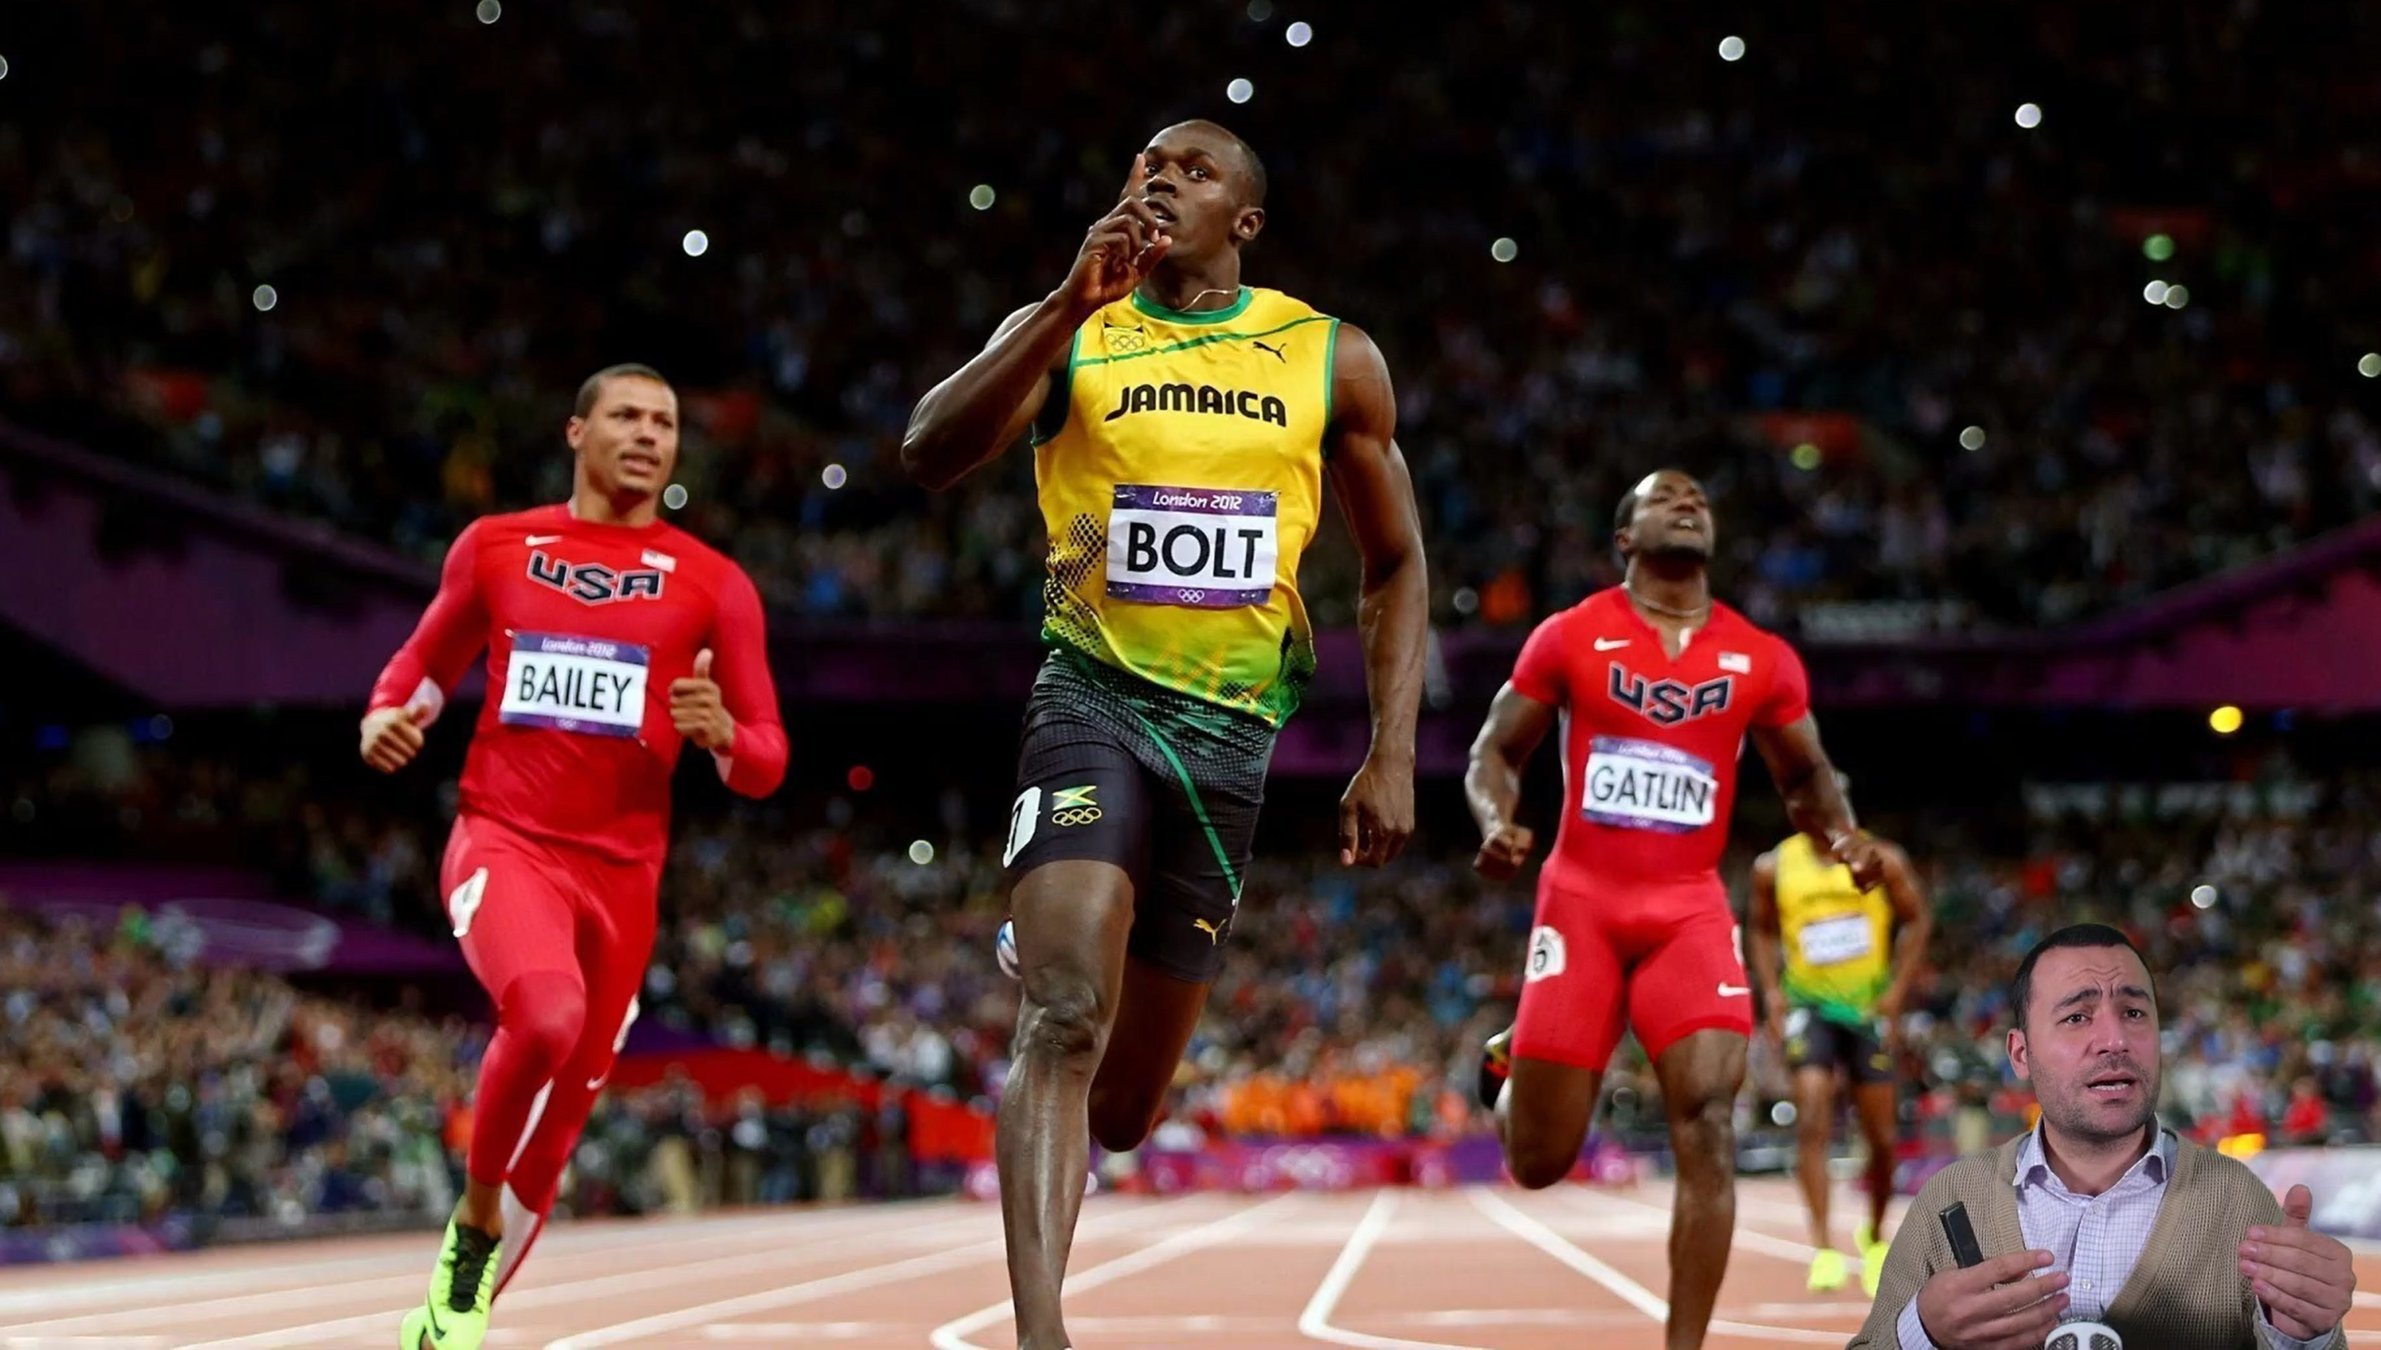
Utility Function and Husein Bolt


My website
https://kansoy.me

@kansoy

Thank you!
Copy of Copy of FK King's College London
By kansoy
Copy of Copy of FK King's College London
Fatih Kansoy - Teaching Economics


