
Karl Ho
Data Generation datageneration.io
Karl Ho
School of Economic, Political and Policy Sciences
University of Texas at Dallas
source: https://saylordotorg.github.io/text_essentials-of-geographic-information-systems/s11-02-multiple-layer-analysis.html
library(tidyverse)
library(ggmap)
us=map_data("state")
# Create US map data frame
USmapDF <- data.frame(state.name, stringsAsFactors=F)
USmapDF$state=tolower(USmapDF$state.name)
# Create Black and White US map
library(mapproj)
us=map_data("state")
# Create US map data frame
USmapDF <- data.frame(state.name, stringsAsFactors=F)
USmapDF$state=tolower(USmapDF$state.name)
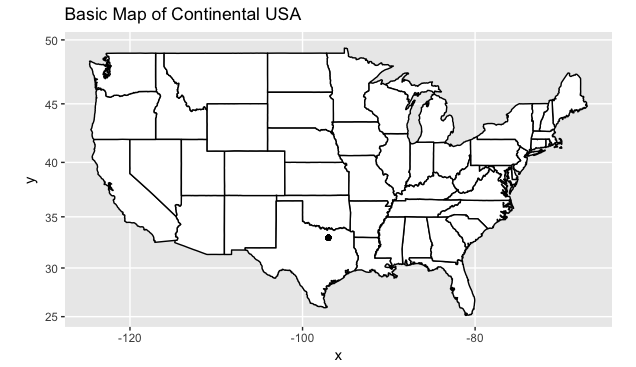
# Create US map
map.us=ggplot(USmapDF,aes(map_id=state))
map.us=map.us +
geom_map(map=us,fill="light yellow", color="black")
map.us=map.us +
expand_limits(x=us$long,y=us$lat)
map.us=map.us +
coord_map() +
ggtitle("Basic Map of Continental USA")
map.us=map.us +
theme_bw()
map.us=map.us +
theme(plot.title = element_text(hjust = 0.5)) # Does order matter?
map.uslibrary(tidycensus)
library(tigris) # Load Census TIGER/Line Shapefiles
options(tigris_use_cache = TRUE)
# Get a list of American Community Survey (ACS) 2019 variables
acs19 = tidycensus::load_variables(2019, "acs5", cache = TRUE)
acs19_Profile = load_variables(2019 , "acs5/profile", cache = TRUE)
us_median_age19 <- get_acs(
geography = "state",
variables = "B01002_001",
year = 2019,
survey = "acs1",
geometry = TRUE,
resolution = "20m"
) %>%
shift_geometry()
plot(us_median_age19$geometry)
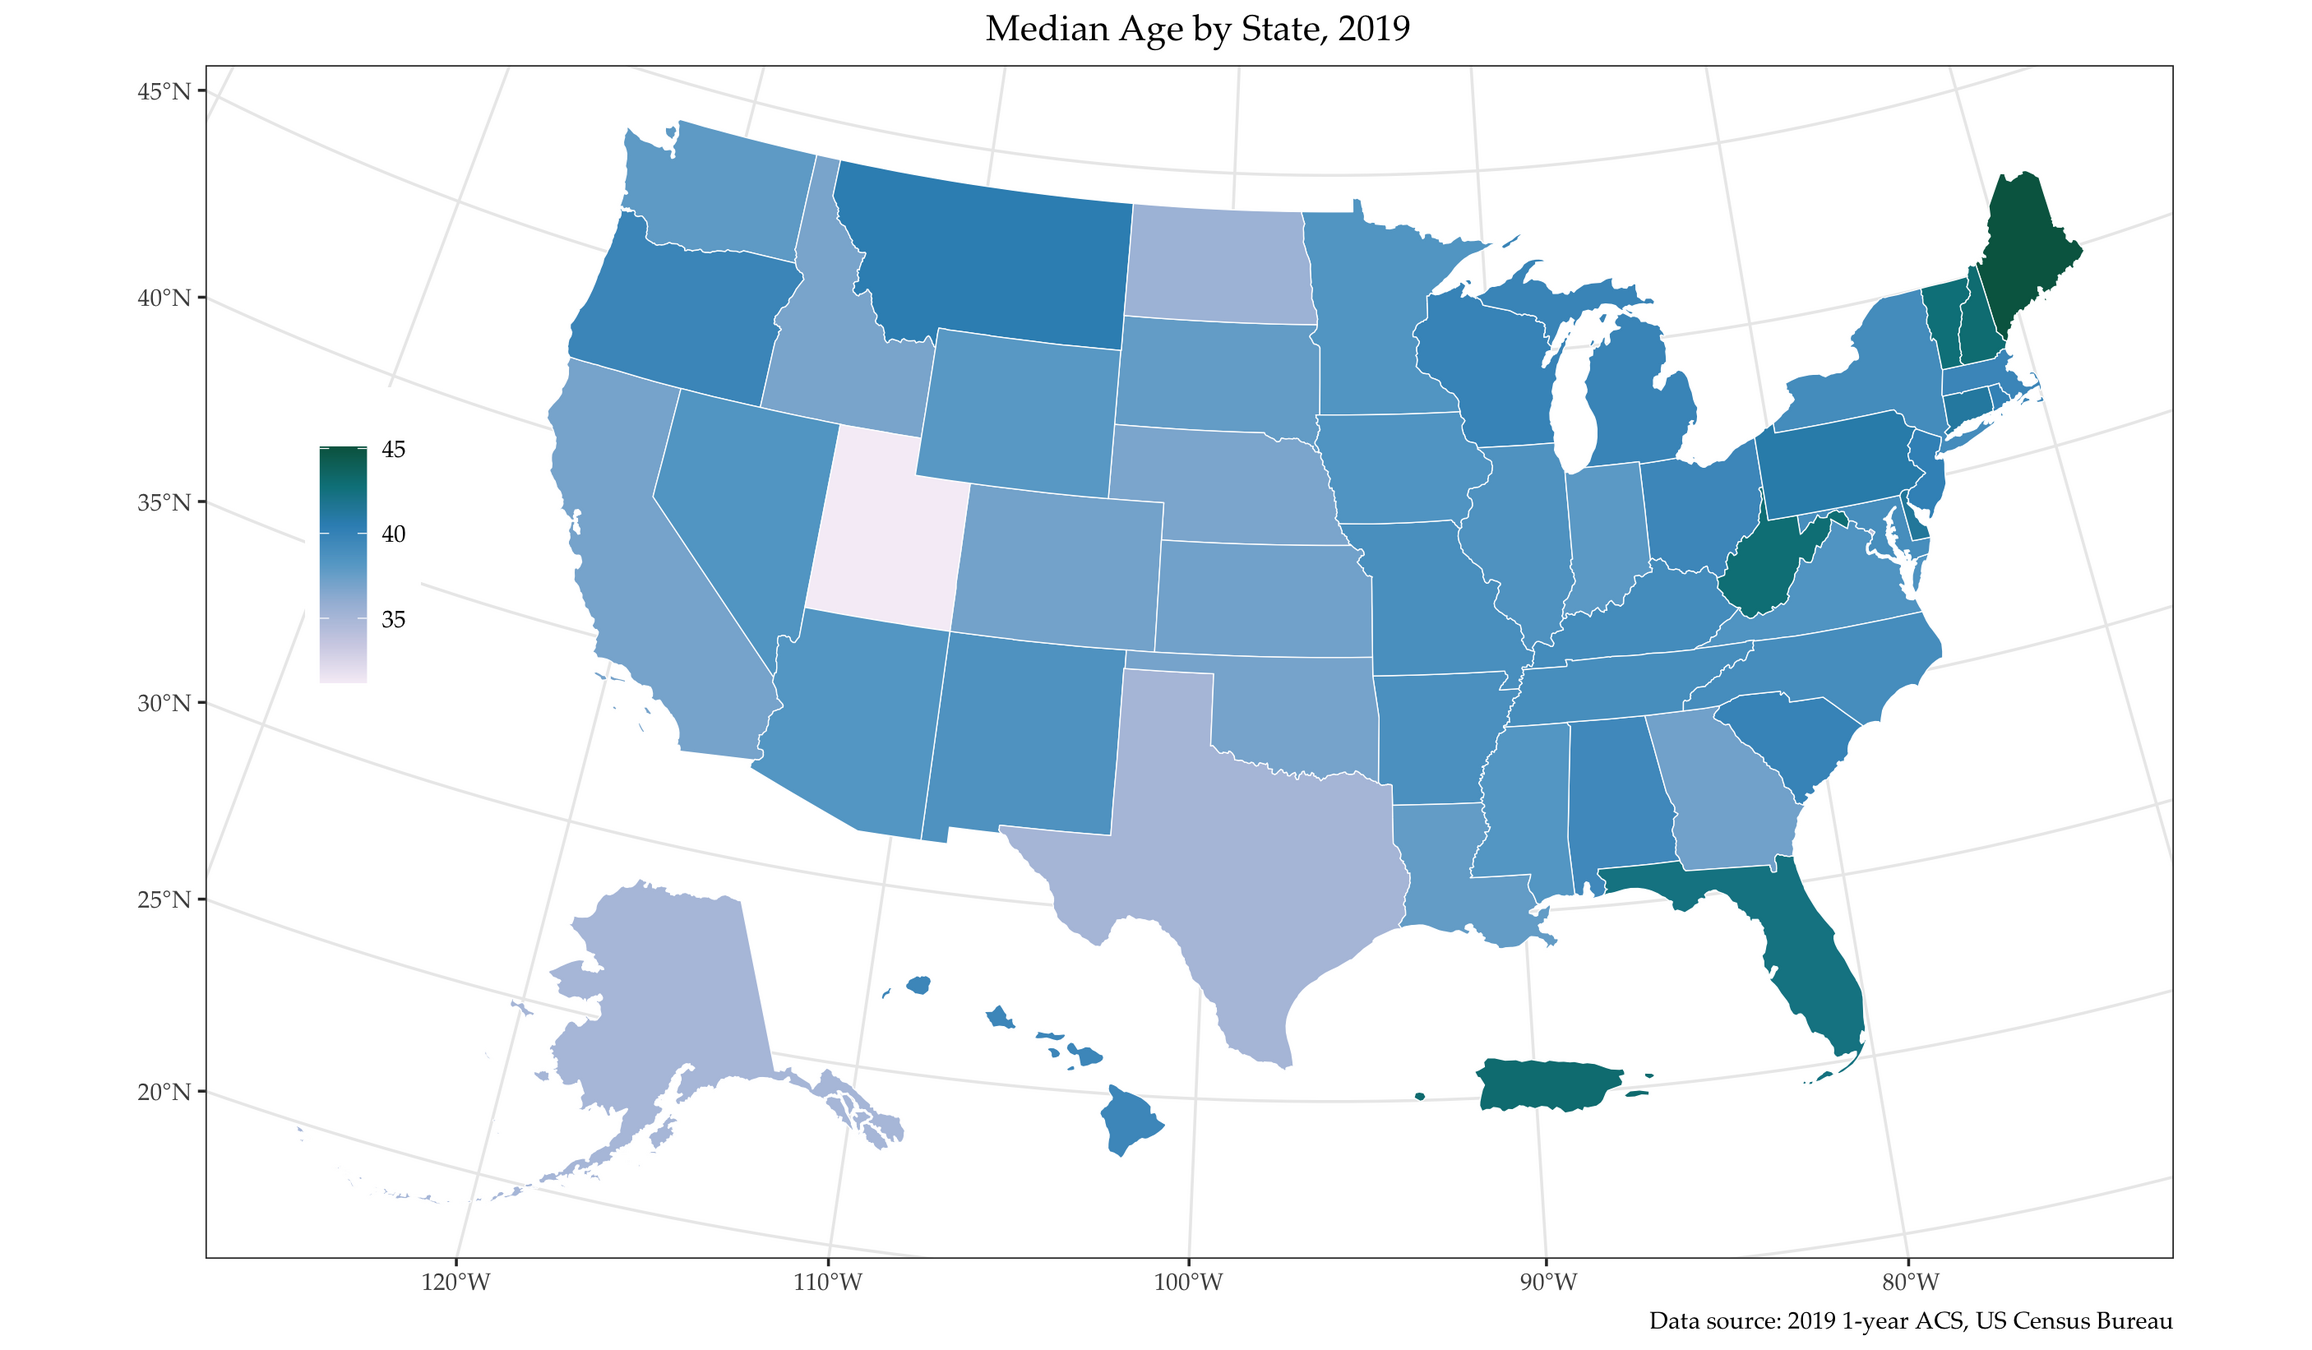
ggplot(data = us_median_age19, aes(fill = estimate)) +
geom_sf(col="white") + # Why color is white?
theme_bw() +
scale_fill_distiller(palette = "PuBuGn", # Try other palette?
direction = 1) +
labs(title = " Median Age by State, 2019",
caption = "Data source: 2019 1-year ACS, US Census Bureau",
fill = "", family="Palatino") +
theme(legend.position=c(.08,.6), legend.direction="vertical") +
theme(text = element_text(family = "Palatino"), plot.title = element_text(hjust = 0.5))
Bivand, R.S., Pebesma, E.J., Gomez-Rubio, V. and Pebesma, E.J., 2008. Applied spatial data analysis with R (Vol. 747248717). New York: Springer.
By Karl Ho


