

Karl Ho
Data Generation datageneration.io
Karl Ho
School of Economic, Political and Policy Sciences
University of Texas at Dallas
Interpretable Machine Learning (IML) is a subfield of machine learning that focuses on developing, understanding, and analyzing models that generate comprehensible and meaningful explanations for their predictions.
1. Model Transparency: Creating models that are intrinsically interpretable, allowing humans to understand how input features contribute to the model's predictions. Examples include linear regression, decision trees, and rule-based models.
2. Model Interpretation: Developing techniques to extract insights from complex, black box models, making their predictions more understandable. This includes model-agnostic methods like LIME, SHAP, and partial dependence plots, as well as model-specific techniques for deep learning, random forests, and other models.
3. Feature Importance: Identifying and ranking the most important features in a model, providing insights into which variables have the most significant impact on predictions.
4. Human Factors: Considering the human aspect of interpretability, such as cognitive biases, trust, and expertise, to ensure that explanations are useful and actionable for end-users.
5. Ethical Considerations: Addressing fairness, accountability, and transparency concerns in machine learning models to avoid potential biases, discrimination, or unintended consequences.
6. Evaluation: Developing methods to assess the quality and effectiveness of interpretable models and explanations, using both quantitative and qualitative approaches.
Importance of interpretable machine learning
The Human Side of Interpretability
Model-Agnostic Methods
Model-Specific Methods
Rule-Based Models
Interpretability in Unsupervised Learning
Interpretable Models for Structured Data
Interpretability in Deep Learning
Evaluation of Interpretability
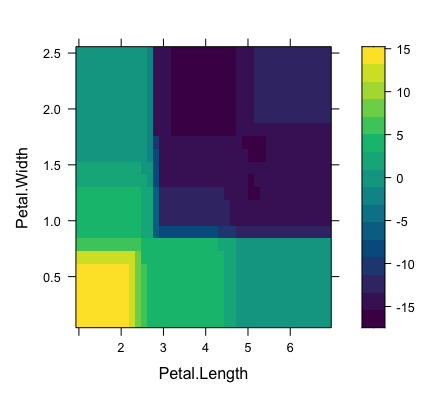
Partial Dependence Plot (PDP) visualizes the relationship between a feature (or a set of features) and the predicted outcome of a machine learning model while averaging out the effects of all other features.
Partial dependence plots help in understanding the marginal effect of a single feature or the interaction between multiple features on the model's predictions.Observe the x-axis, which represents the Petal.Length values.
The y-axis represents the average predicted probabilities for each class (setosa, versicolor, and virginica) based on the random forest model.
For each class, the line in the PDP shows how the predicted probability changes as the Petal.Length value increases or decreases.
The rug plot at the bottom of the chart displays the distribution of Petal.Length values in the dataset.
Interpretation:
As the Petal.Length increases, the predicted probability for setosa (red line) decreases, while the probabilities for versicolor (green line) and virginica (blue line) increase.
For short petal lengths (around 1 to 2), the model predicts a high probability for the setosa class, whereas versicolor and virginica have low probabilities.
For intermediate petal lengths (around 3 to 5), the versicolor class has a higher probability compared to the other two classes.
For longer petal lengths (greater than 5), the virginica class has the highest probability.
This PDP demonstrates that the Petal.Length feature has a significant impact on the random forest model's predictions for iris species. Shorter petal lengths are associated with setosa, intermediate lengths with versicolor, and longer lengths with virginica.
Citation:
Friedman, Jerome H. 2001. "Greedy function approximation: A gradient boosting machine." Annals of Statistics, 29(5), 1189-1232.
Source: Christoph Molnar
Lundberg, Scott M. and Su-In Lee. 2017. A Unified Approach to Interpreting ModelPredictions (https://arxiv.org/pdf/1705.07874.pdf)
Molnar, Christoph. 2019. Interpretable machine learning. Lulu. com,
By Karl Ho


