What is a Pivot Table?
A tool to help you summarize large volumes of data

How?
Slices your data across attributes

Attribute
Attributes are descriptors like
- Make
- Model
- Color
- Year
Slice
Slices are computations:
- Cost
- Quantity
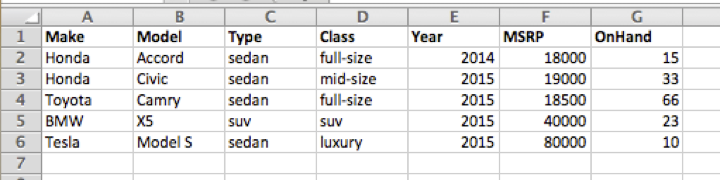
Sample Data
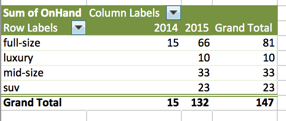
Ta-da! A Pivot
Wait, how did you do that?
Enough Slides
Lets make a pivot already

Checklist for Creating Pivots
Step 1
Get your data

Checklist for Creating Pivots
Is the data clean? Confirm:
- Headers
- Squareness
- Clean rows
- Excel assumptions (date, numbers)
Checklist for Creating Pivots
Step 2
Tell Excel to create a pivot
Checklist for Creating Pivots
- Data >> PivotTable >> Automatic*
- Reset Pivot Table Builder
*you can verify the source by Data >> PivotTable >> Data >> Change Source
Checklist for Creating Pivots
Step 3
Manage your pivot using Pivot Table Builder

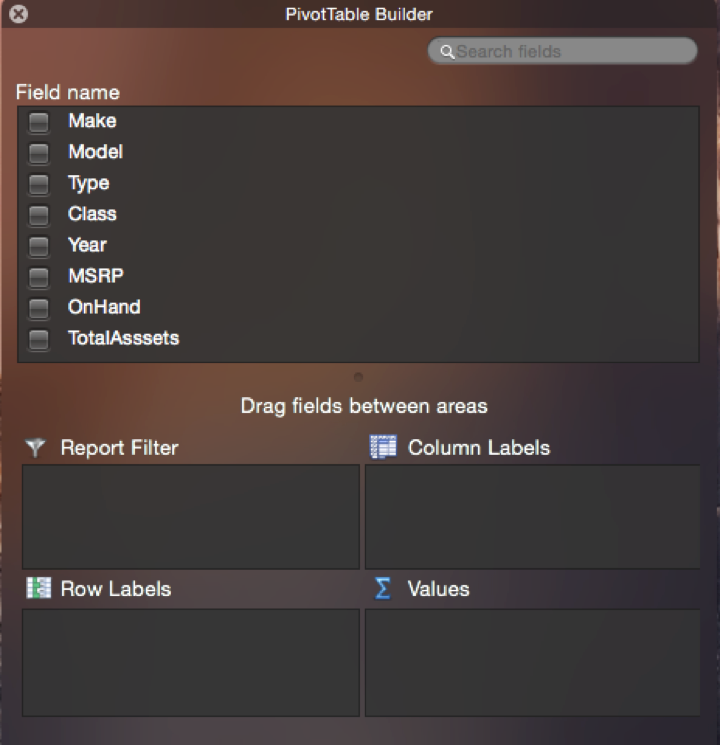
PivotTable Builder
Field Name: all the fields from your data
Row Labels: attributes you want to see on X-axis
Column Labels: attributes you want to see on Y-axis
PivotTable Builder
Values: grouped summary data
Report Filter: What should be included/excluded?
Remember Slices and Attributes?
Each row or column label slices your data
The slice (value) is a portion of the total by an attribute (row/column label)
What else is good?
- Attribute Hierarchies
- Filter on Report, Row, and/or Column
Trust no one
Prove it, Excel.
Right-Click >> Group and Outline >> Show Details
Double-Click
-or-
GUS
Export from GUS
- Budget >> Find Transaction
- Identify what you want to export
- Export Options >> Export in Standard Format
- Payroll >> Find Payroll Transaction
- Identify what you want to export
- Export
Budget
Payroll
Task #1
manager wants budget expenses by cost type in 2014-15
Task #2
agency wants data about expenses by
...title code, ledger date
Task #3
manager wants copy expenses year-by-year
Takeaways
What kind of data?
Remember what type of data you had before you started to pivot.

Experiment!
Play with your data! If you're not sure that Excel is doing what you want it to do, have Excel prove it to you.
Show details (double-click) is your friend.

Just a tool
Pivot table is just a tool. It is as good as what you tell it to do.

Bonus Round
- Running Totals
- % Year Over Year
PivotTable Field >> Options >> Show Data as...
I don't like numbers all that much
Can you make it ...
pOP?
Select your pivot table values
Then: Home >> Format >> Conditional Formatting
Conditional Formatting
That's all folks
Questions?
What is a Pivot Table?
By Kevin Wu