Log Aggregation and Monitoring with Containers
Why Log-Aggregation?
- Accessibility
- Usability
- Quantitative analysis
- Alerting
Graylog Dashboard

Graylog Features
- Open Source (Open Core)
- Optional Enterprise Features
- Collection & Extraction
- Interactive analysis and searches
- Dashboards & Visualization
- Alerts & Triggers
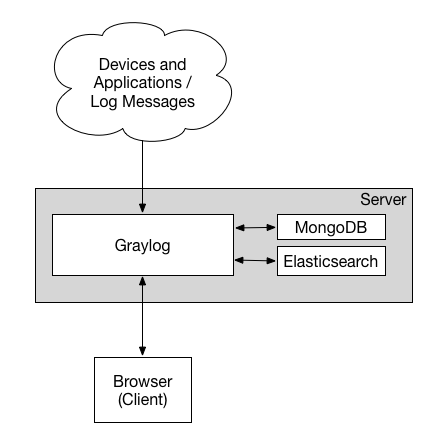
Architecture
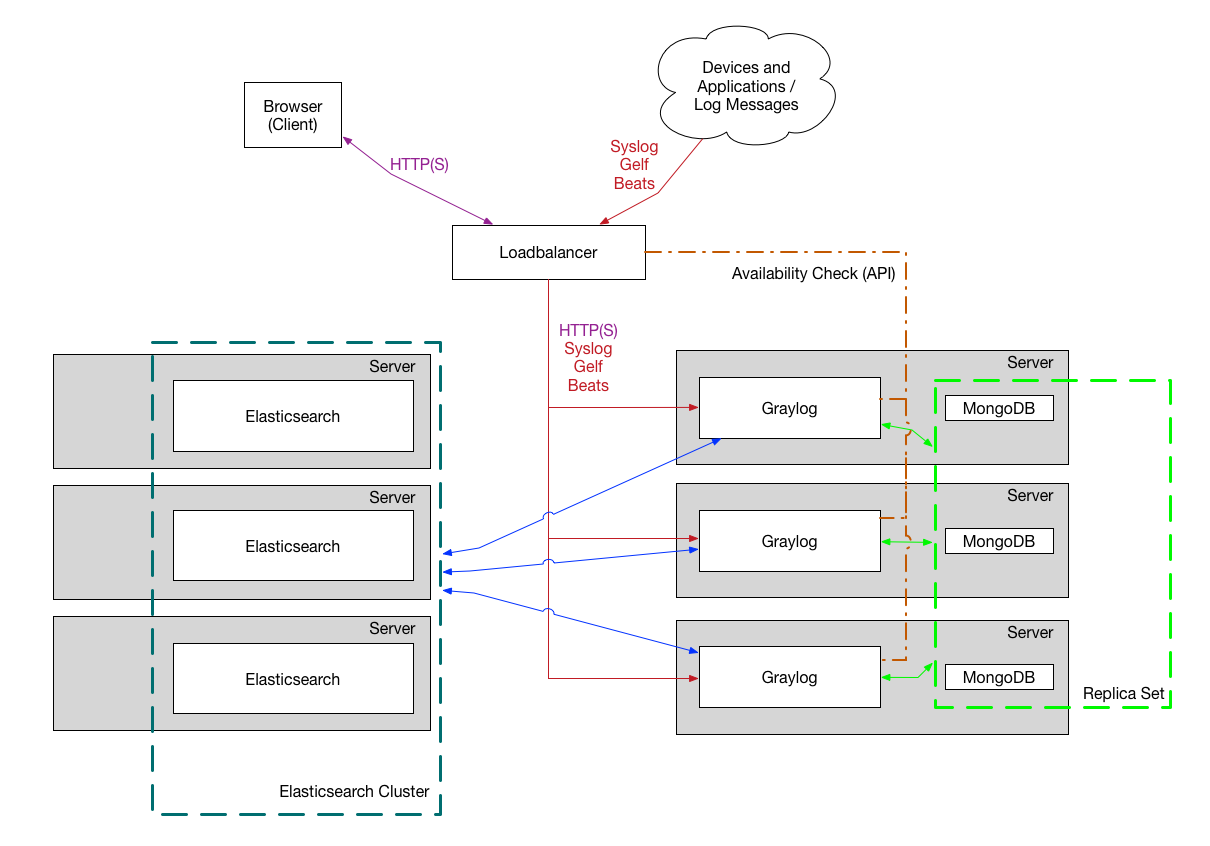
Architecture (Cluster)
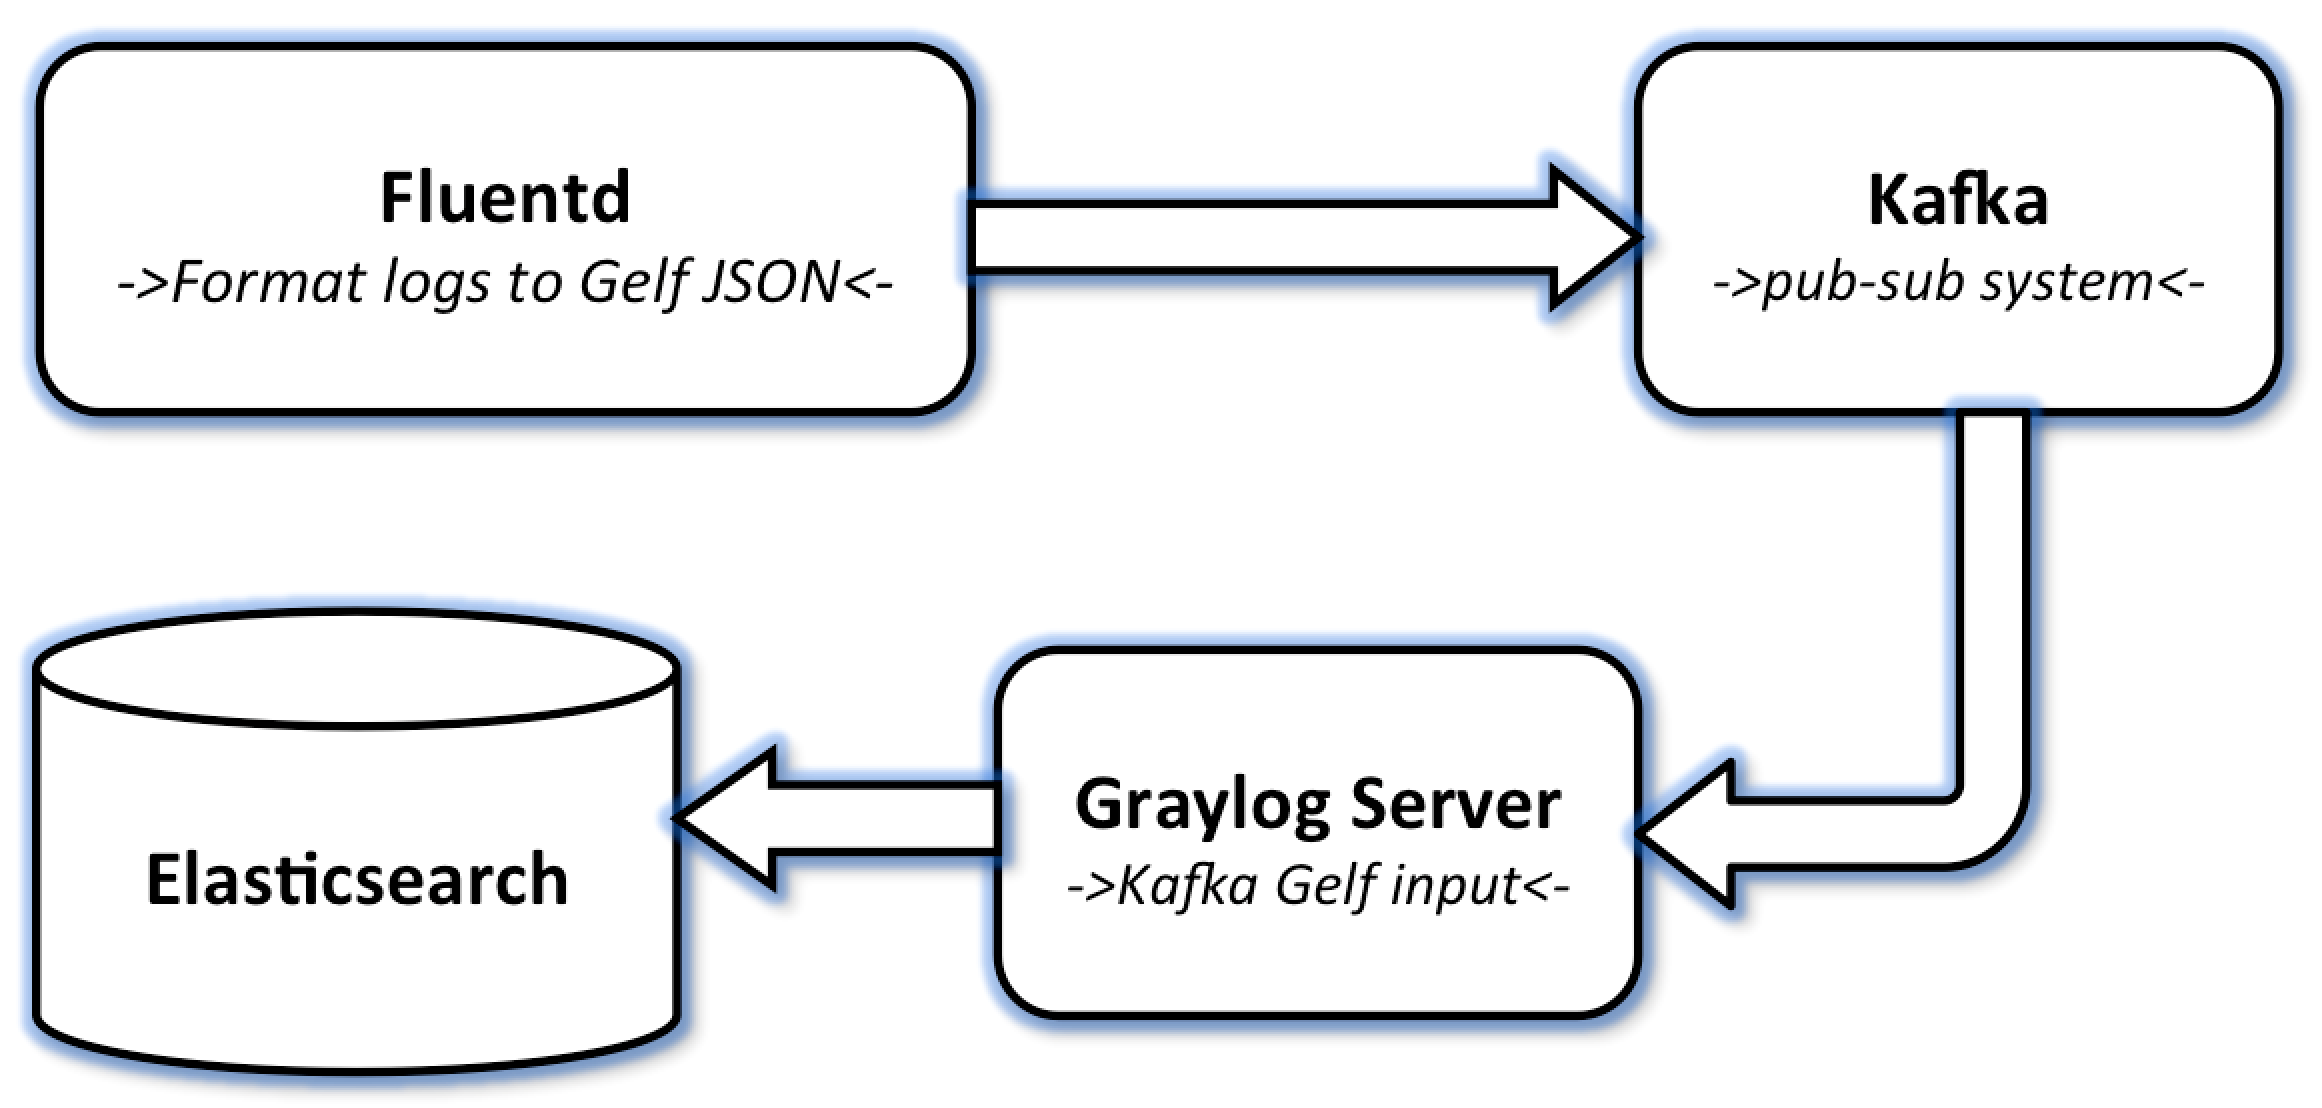
Architecture (Kafka + Fluentd)
billions of logs per day, > 100k messages per second
Transport
- Beats
- GELF
- Logstash
- Kafka
- Fluentd
- All kinds of crazy combos!
Application Logging
- Logback driver
- STDOUT
- special driver, i.e. GELF
- Docker
- default (JSON file)
- GELF
- journal
- Sidecar containers possible
Beware Multiline Java-Stacktraces!
Use Logstash or GELF appender
¯\_(ツ)_/¯
multiline {
  #type => "all" # no type means for all inputs
  pattern => "(^.+Exception: .+)|(^\s+at .+)|(^\s+... \d+ more)|(^\s*Caused by:.+)"
  what => "previous"
}
Exercise
- Checkout the workshop and get Graylog up and running
- https://github.com/kiview/graylog-workshop
- Configure Docker GELF driver in order to let containers send logs to Graylog
- Configure Graylog extractors
- Setup some useful streams and visualizations
Docker Vulnerability Scans
docker scan $imageHash
Prometheus
- High dimensionality time-series database
- Used for quantifiable metrics
- E.g. req/s, CPU usage, etc.
- HTTP pull model for querying data
- Query data using PromQL
- Data is gathered using exporters
- Alertmanager for alerting
- Grafana can be used for dashboards
Data Model
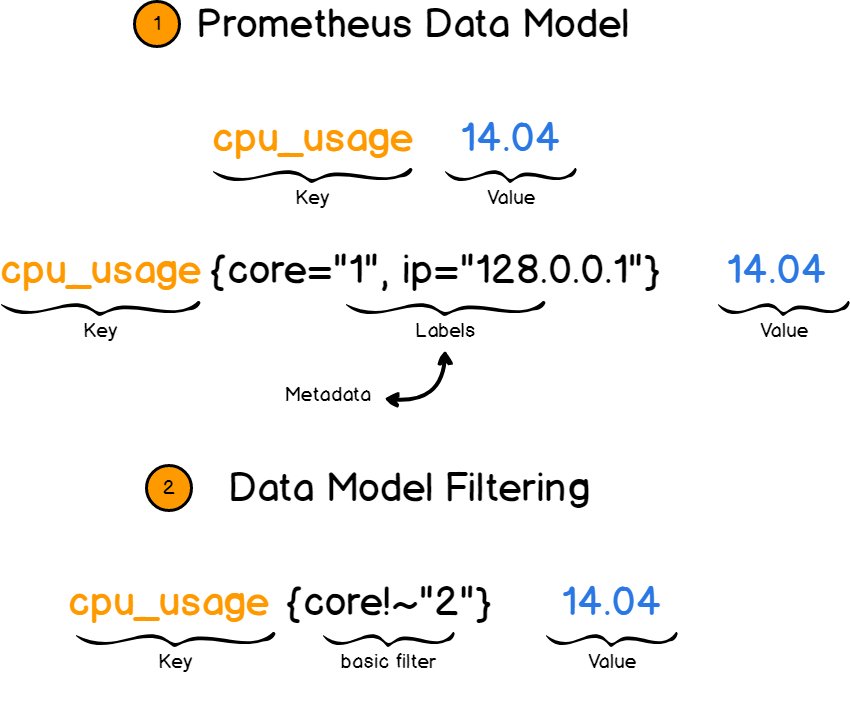
https://devconnected.com/the-definitive-guide-to-prometheus-in-2019/
Prometheus Architecture

Exercise
- Extend the system using Prometheus and Grafana for metrics monitoring
- Add additional exporters for the system (node exporter, cadvisor)
- Query data and build dashboards
- Optional: Add custom metrics to the Spring-Boot application (e.g. Micrometer Timed for profiling)
- Open ended explorative exercise
Log Aggregation and Monitoring
By Kevin Wittek
Log Aggregation and Monitoring
- 1,360


