

Kodegems
Kodegems is a place where you will find a number of tutorials regarding HTML - CSS - WordPress.
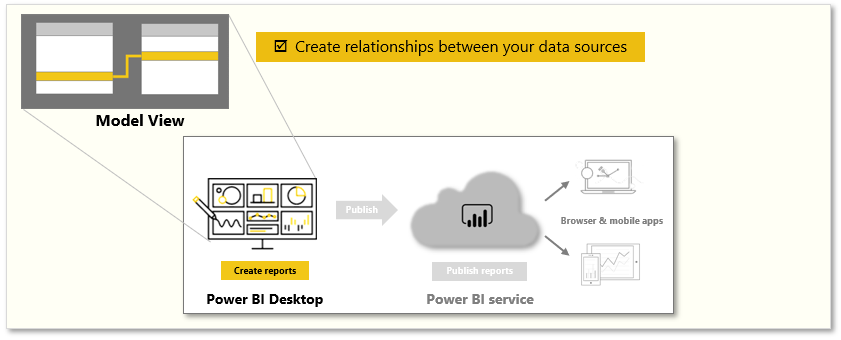
Is one of the features used to connect multiple data sources in BI tool using a relationship. A relationship defines how data sources are connected with each other and you can create interesting data visualizations on multiple data sources.
kodegems.com
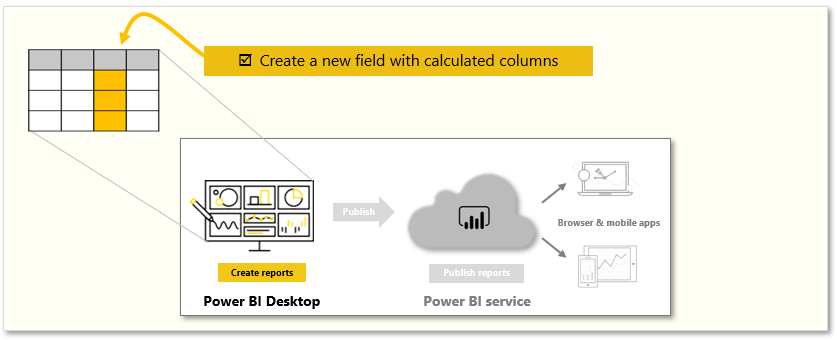
With the modeling feature, you can build custom calculations on the existing tables and these columns can be directly presented into Power BI visualizations. This allows businesses to define new metrics and to perform custom calculations for those metrics.
kodegems.com
- Create relationships between your data sources.
- Create a new field with calculated columns.
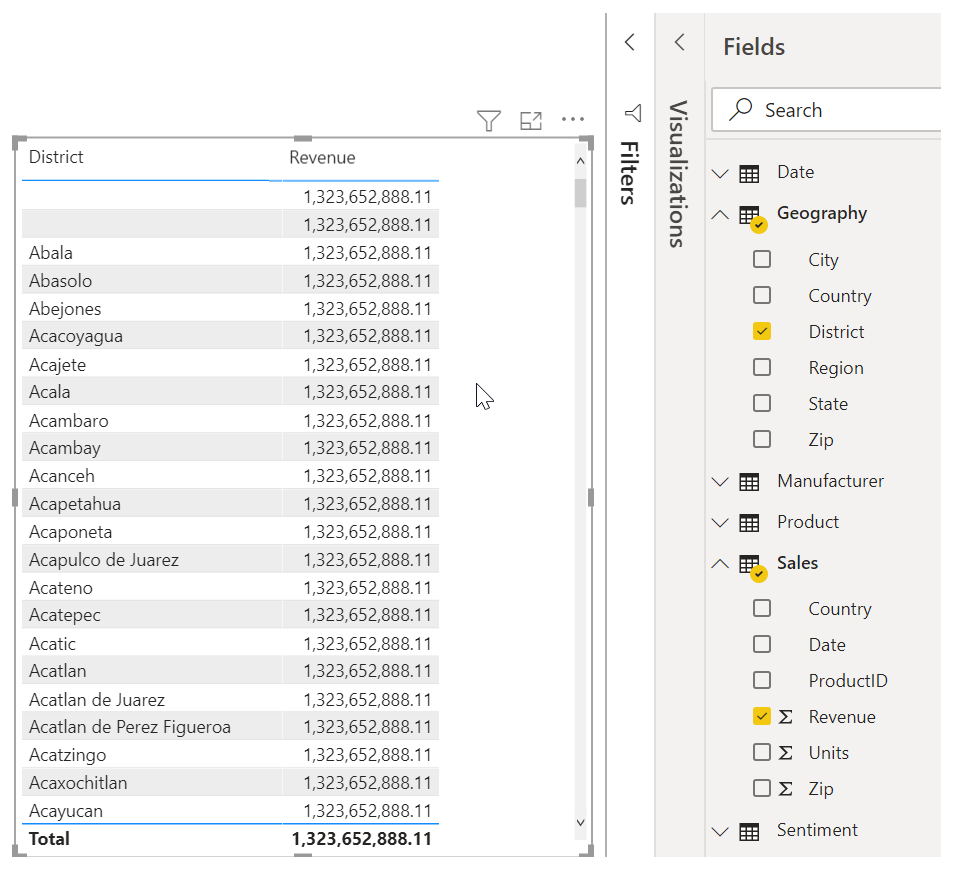
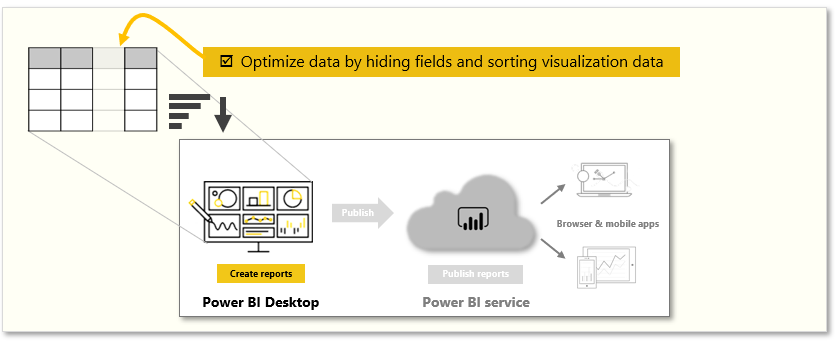
- Optimize data by hiding fields and sorting visualization data.
- Create a measure to perform calculations on your data.
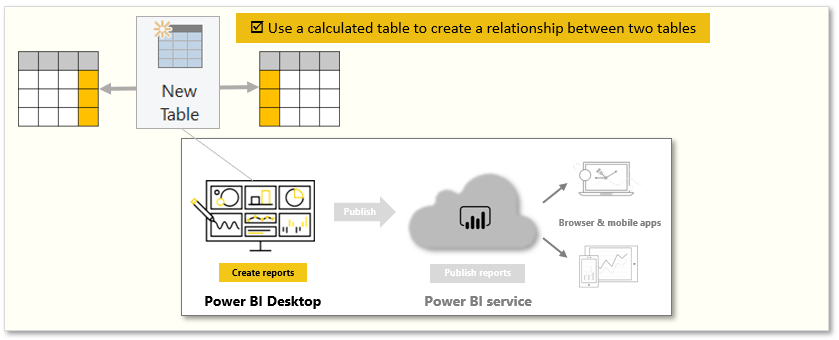
- Use a calculated table to create a relationship between two tables.
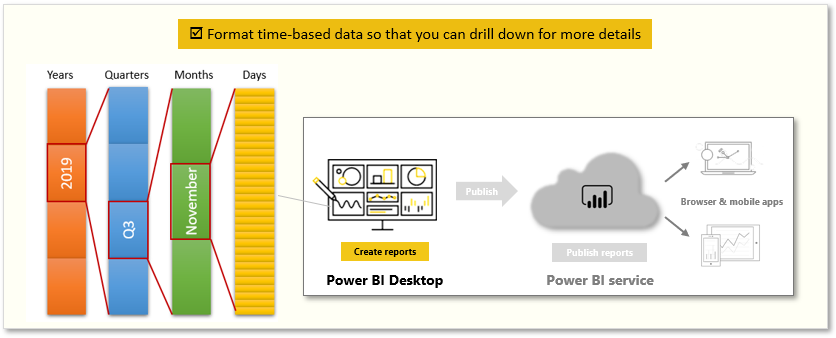
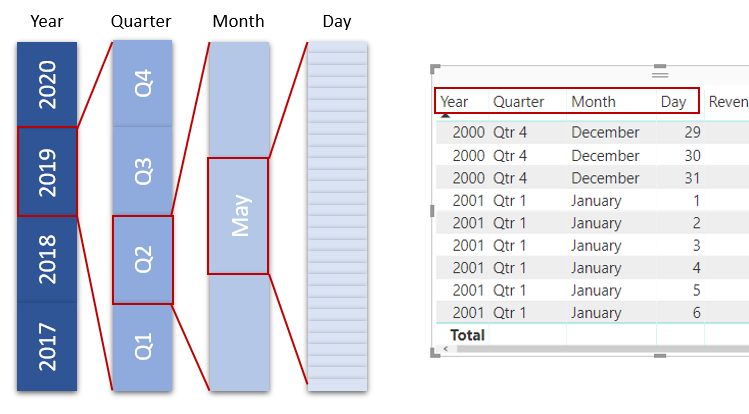
- Format time-based data so that you can drill down for more details.
kodegems.com
Power BI Developer
Project Manager Web
Youtube Instructor
kodegems.com
- No need to put your data into a single table.
- You can use multiple tables from multiple sources and define the relationship between them.
kodegems.com
Create your own custom calculations and assign new metrics to view specific segments of your data.
kodegems.com
kodegems.com
kodegems.com
kodegems.com
kodegems.com
kodegems.com
kodegems.com
kodegems.com
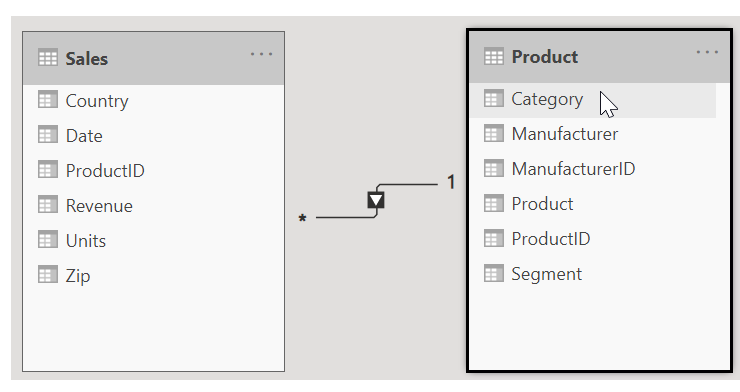
The most common default relationship. The column in one table can have more than one instance of a value. The related table (or lookup table) has only one instance of a value.
kodegems.com
The column in one table has only one instance of a particular value, and the other related table has only one instance of a particular value.
kodegems.com
kodegems.com
kodegems.com
kodegems.com
kodegems.com
kodegems.com
kodegems.com
kodegems.com
Data Analysis Expressions is a programming language that is used throughout Microsoft Power BI for creating calculated columns, measures, and custom tables. It is a collection of functions, operators, and constants that can be used in a formula, or expression, to calculate and return one or more values.
kodegems.com
kodegems.com
kodegems.com
kodegems.com
kodegems.com
kodegems.com
kodegems.com
kodegems.com
kodegems.com
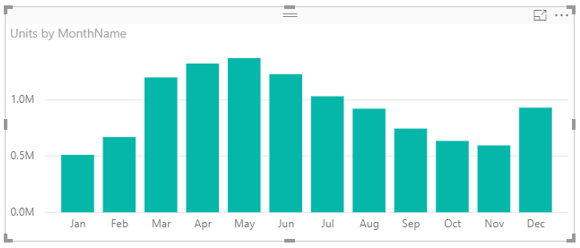
Let’s look at an example
kodegems.com
kodegems.com
kodegems.com
kodegems.com
kodegems.com
kodegems.com
kodegems.com
kodegems.com
kodegems.com
- Create calculated tables
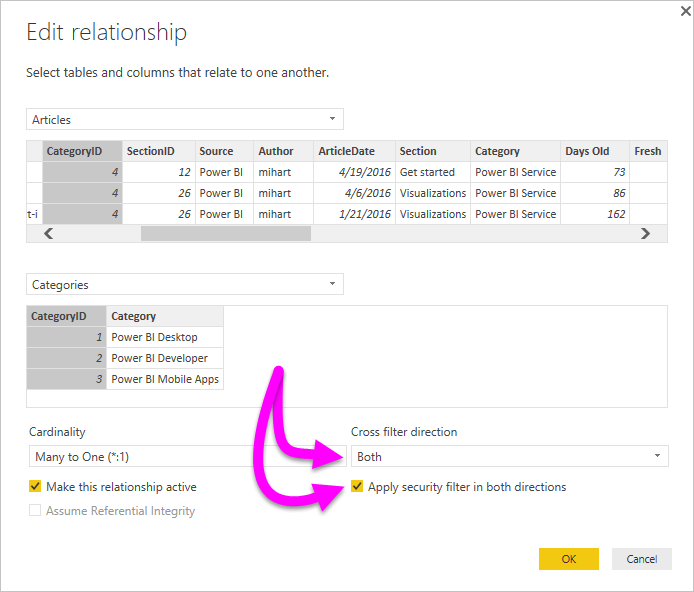
- How to manage your data relationship
- Introduction to Modeling data
- Create calculated columns
- Optimize data models
- Create Measures
- Explore time-based data
- Quiz to check your knowledge
kodegems.com
kodegems.com
In this module, you learned how to create relationships between your data sources and optimize data. These skills will help you pull clean data from several different sources.
By Kodegems
In this presentation, there are several steps to learn data modeling in Power BI


