Easy as Pi
Data Visualization, SVGs and You
By: Kristy Yeaton
What are SVGs?
SVG Tag Basics
- ViewBox
- Path
- d attribute (data string)
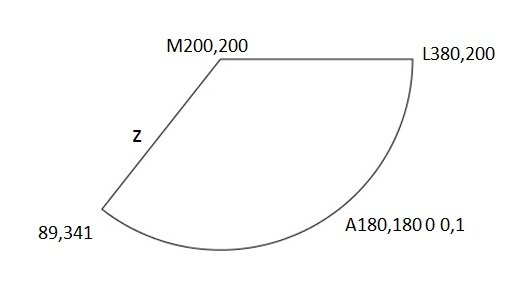
<svg viewBox="0 0 400 400">
<path d="M200,200 L20,200 A180,180 0 0,1 380,200 Z" />
</svg>
Building Blocks of a Pie Slice
Mx,y – Move to
Sets the starting position at the x,y co-ordinates specified
Lx,y – Line to
Draws a line from the starting from the current position to the co-ordinates supplied
Arx,ry x-axis-rotation large-arc-flag,direction x,y
Arc to
- rx,ry - Radius of the elliptical in the x,y direction
- x-axis-rotation - Not needed for this only has effect when rx + ry are different
- Large arc flag - If the arc is over 180 degrees this should be set to 1 otherwise 0
- Direction - 0 clockwise, 1 counterclockwise
- x,y - Co-ordinates to draw arc to
and finally... z
Close the shape with a final line from the current position to the starting co-ordinates
The Result
Enough of this...
It's example time!
http://codepen.io/kristyjy/pen/JGmLJV
The End
Helpful Articles
- https://jbkflex.wordpress.com/2011/07/28/creating-a-svg-pie-chart-html5/
- http://www.codestore.net/store.nsf/unid/EPSD-5DTT4L
Easy as Pi
By Kristy Jo Yeaton