Architecting great experiments
@kylerush
Director of Frontend Engineering and Optimization,
Hillary for America
Slides
http://bit.ly/1LWNGGR

means
write it down
or
tweet it
experiment concepts
Significance
The risk of encountering a false positive.
95% = out of 100 a/a tests, 5 will inaccurately report a difference.
Power
The risk of encountering a false negative.
80% = out of 100 a/b tests,
20 winners will not be reported.
one-tail vs. two tail
One tail = is the variation better?
Two tail = is the variation
better OR worse?
MDE
Minimum detectable effect

Successful testing strategies
are based around the minimum
detectable effect (MDE) variable.
Sample size
How many subjects
are in your experiment.

Always use a sample size
calculator to calculate sample
size before starting an a/b test.
bit.ly/VUBti8
sample size calculator
bit.ly/SWR3YC
Example
Absolute lowest MDE
conversion rate: 4%
MDE: 1%
POWER: 80%
SIGNIFICANCE: 5%
TAILS: ONE
2,972,435
Visitors per branch
example
Focus on time
1 month = 170,000 unique visitors
CONVERSION RATE: 4%
MDE: 6%
POWER: 80%
SIGNIFICANCE: 5%
TAILS: ONE
83,230
Visitors per branch
example
Small startup
1 month = 3,000 unique visitors
CONVERSION RATE: 4%
MDE: 45%
POWER: 80%
SIGNIFICANCE: 5%
TAILS: ONE
1,567
Visitors per branch

Sample size calculators tell you
how many subjects, but not which
subjects should be in your experiment.
sampling
- can be really hard
- week day vs. weekend traffic
- campaign vs. organic traffic
- returning vs. new visitors
Where should i test?
example
E-commerce website
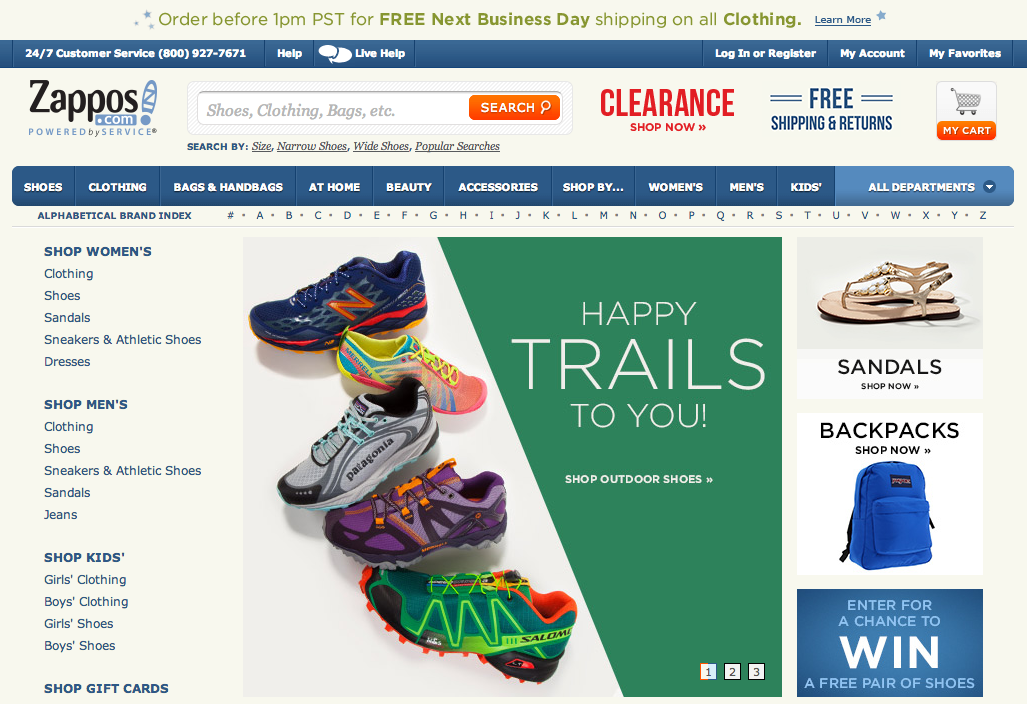
homepage assumptions
- Lots of traffic
- Relatively few conversions
Let's estimate:
- 2.5% conversion rate
- 100,000 monthly unique visitors
Run experiment for 1 month (100k visitors)
CONVERSION RATE: 2.5%
POWER: 80%
SIGNIFICANCE: 5%
TAILS: ONE
MDE: 10%
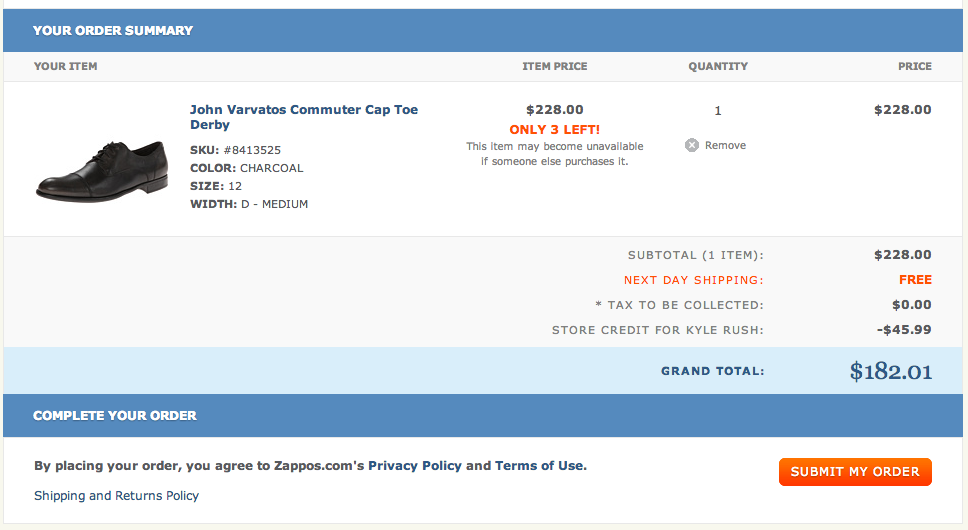
Checkout page assumptions
- Lower traffic
- Relatively high conversion rate
Let's assume:
- 50% conversion rate
- 10,000 monthly unique visitors
RUN EXPERIMENT FOR 1 MONTH (10k visitors)
CONVERSION RATE: 50%
POWER: 80%
SIGNIFICANCE: 5%
TAILS: ONE
MDE: 5%
just cut your MDE in half!

Start by focusing a/b tests on the
last step in your conversion funnel.
what should i test?
Depends on MDE and time.
Landing page optimization
(mozcon 2013)
bit.ly/1wkpgye
going beyond the low hanging fruit
(conversion conference 2014)
bit.ly/1kU4sZ0
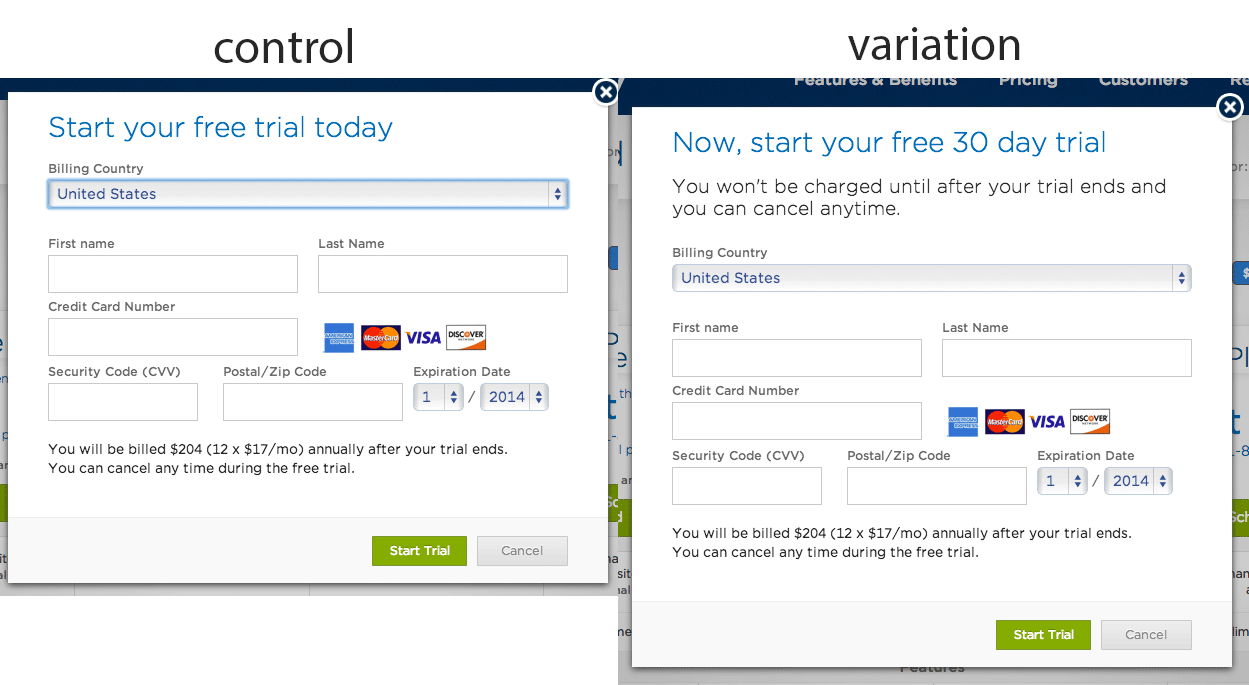
be fearless
experiment
Terse vs verbose
result
+31% leads
99.9% confidence
Before you test
goals
- Measure as many goals as possible
- micro: form field errors, time on page
- macro: purchase, revenue
- Choose a primary goal
- Don't forget about down the funnel goals
- Repeat purchase
- Save payment information
example
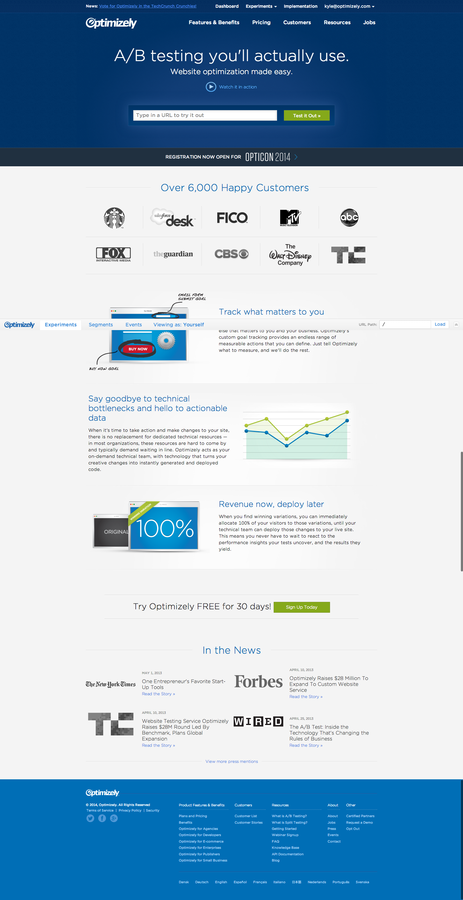
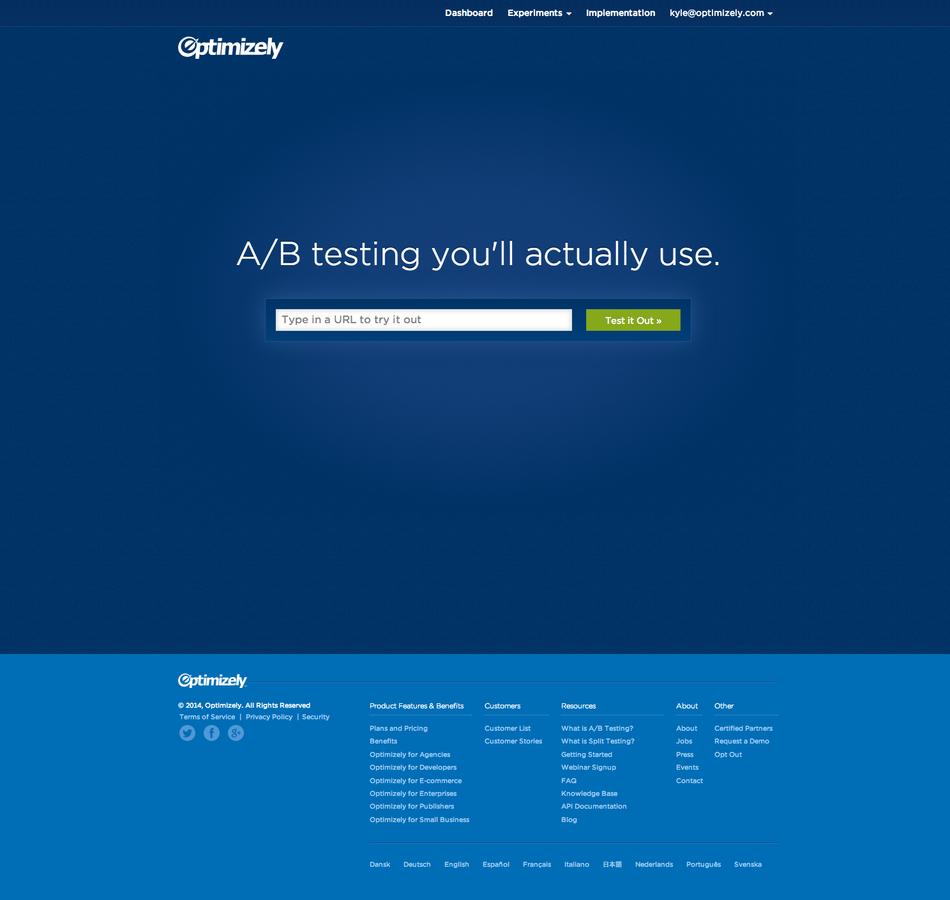
Success vs. submit
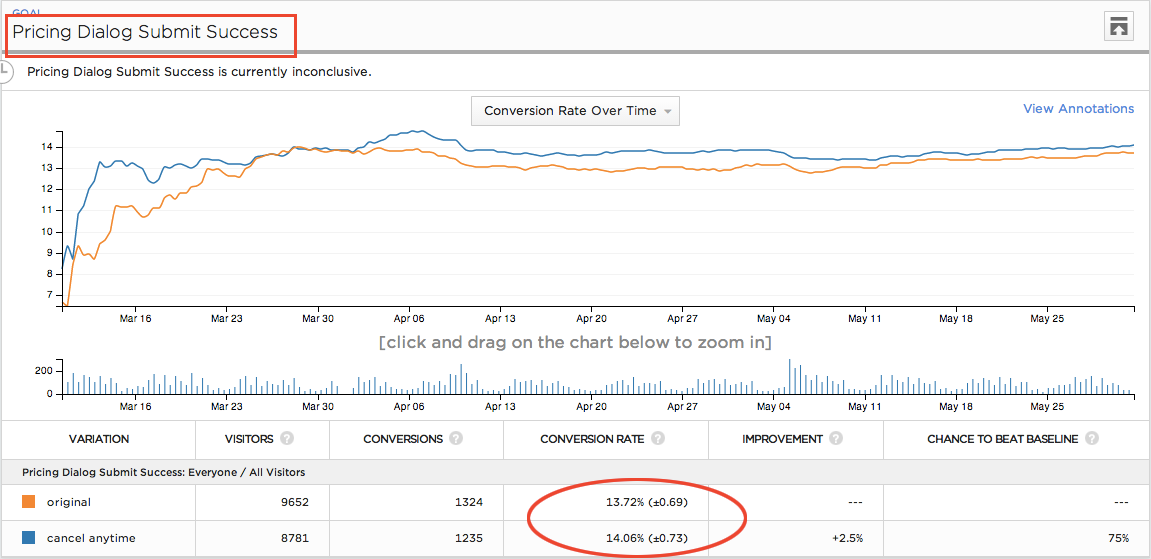
13.72% conversion rate
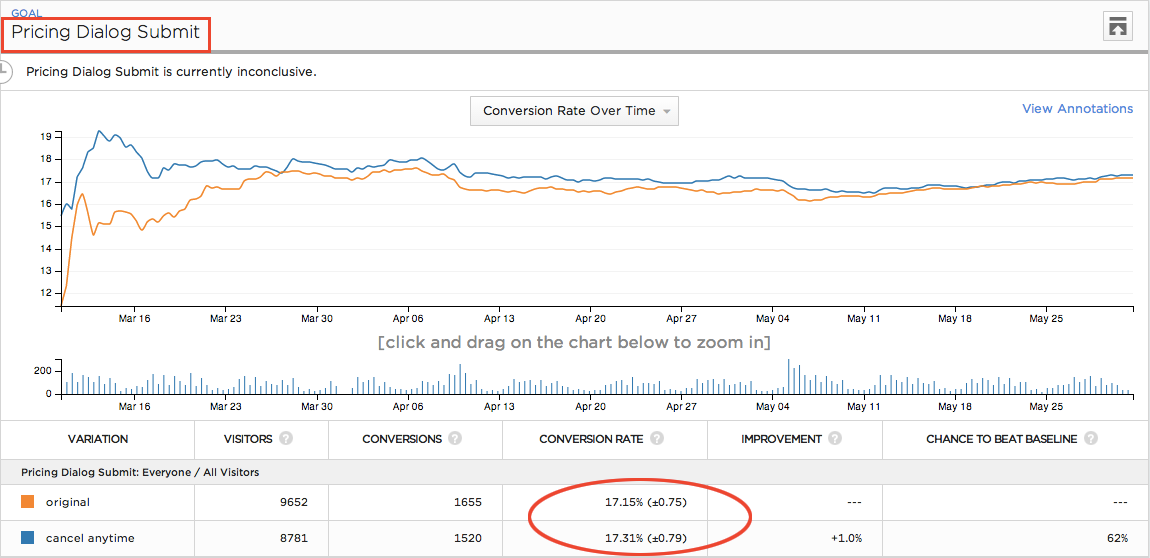
17.15% conversion rate
25% difference

Measure as many goals
as possible for every experiment.
standards document
For each page/funnel record:
- Three month monthly average of unique visitors
- Stopping conditions (sample size)
- Goals
- baseline conversion rate
- MDE
- visits per branch
- baseline conversion rate over time
testing standards template
bit.ly/1oVRf6i
Quality assurance
- No bugs in the variation
- No bugs in the control
- Tracking works correctly
ELIMINATING bias
Double blind experiments
Experiment brief
- Hypothesis
- Audience description
- Goals tracked
- Stopping conditions
- Screenshots
- QA summary
experiment brief template
bit.ly/1nvNJjx
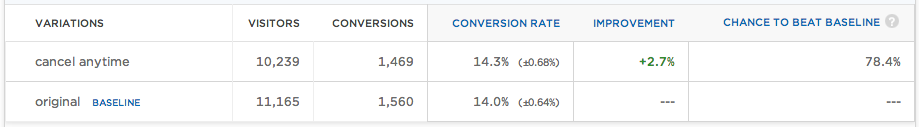
after you test
statistical tie
Not enough data to
conclude that there is a difference

The overwhelming majority of
experiment results are a statistical tie.
Example
Statistical tie
result
retesting
Example
Retesting
first test
+36% revenue
second TEST
statistical tie
third TEST
Statistical tie
Share your results

Always, always record detailed
experiment results in an archive.
EXPERIMENT ARCHIVE
- experiment date
- audience/url
- screenshots
- hypothesis
- results
- link to experiment
- link to result csv
Experiment archive template
bit.ly/1q9tRWI
ARCHITECTING GREAT EXPERIMENTS
@KYLERUSH
Head of Optimization, Optimizely
Copy of Architecting great experiments
By Kyle Rush
Copy of Architecting great experiments
Unbounce Roadshow. New York, NY. June 1, 2015