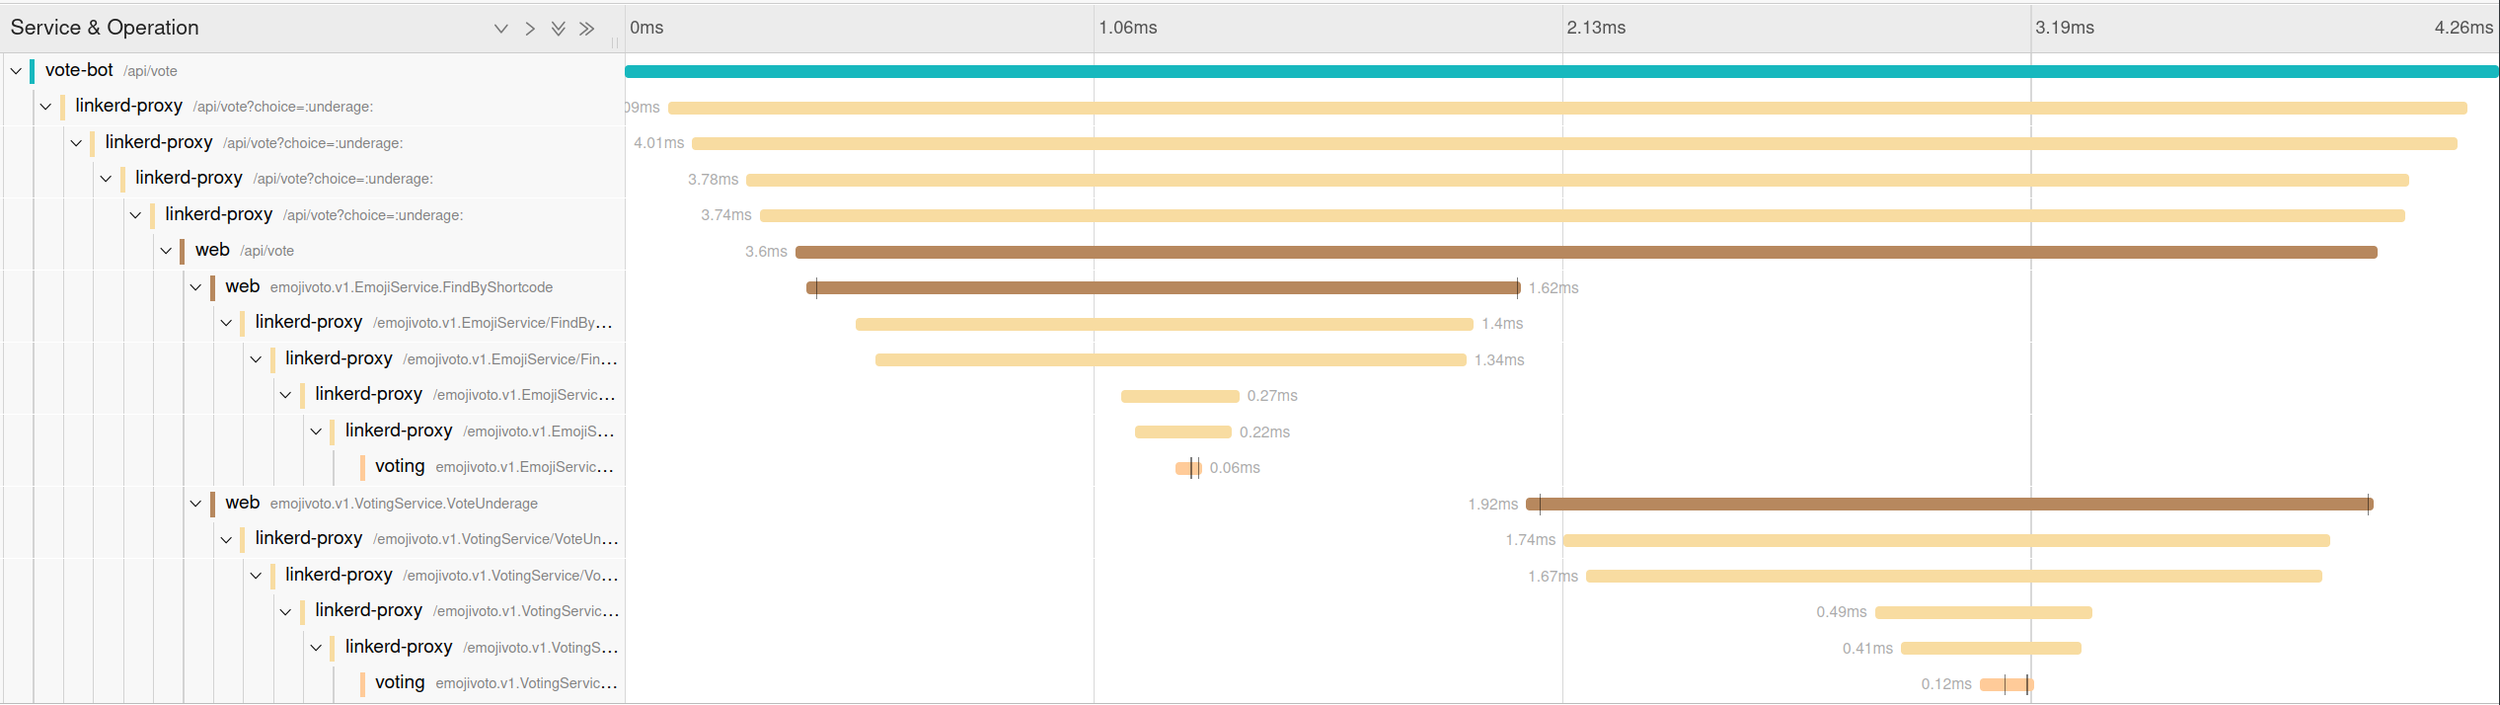
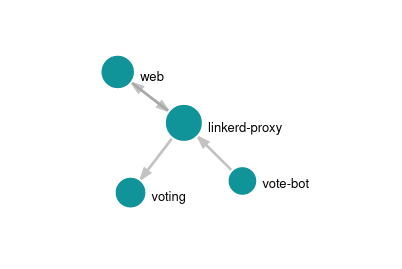
Call Graph


Gap between the present scenario and what it is supposed to be.
WHY
1. No direct way to find bottleneck services
2. No direct way to find bottleneck methods
3. Not everyone can't understand the complete call loop picture using our current debugging stack.
4. Risk of missing information is relatively high
5. We can't correlate our calls with the captured metrics.
WHAT
Let's speculate!
Scenario 1
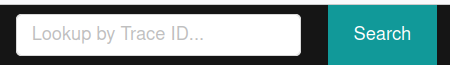
You have a call link
Scenario II
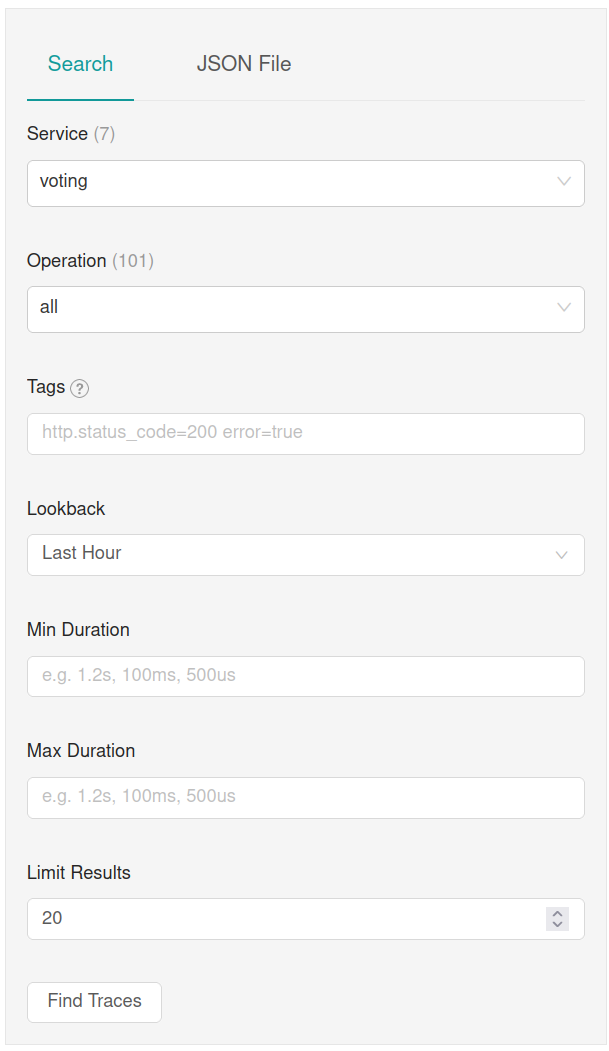
You don't have call link(s)
Scenario III
You don't know what it is supposed to be

Scenario IV
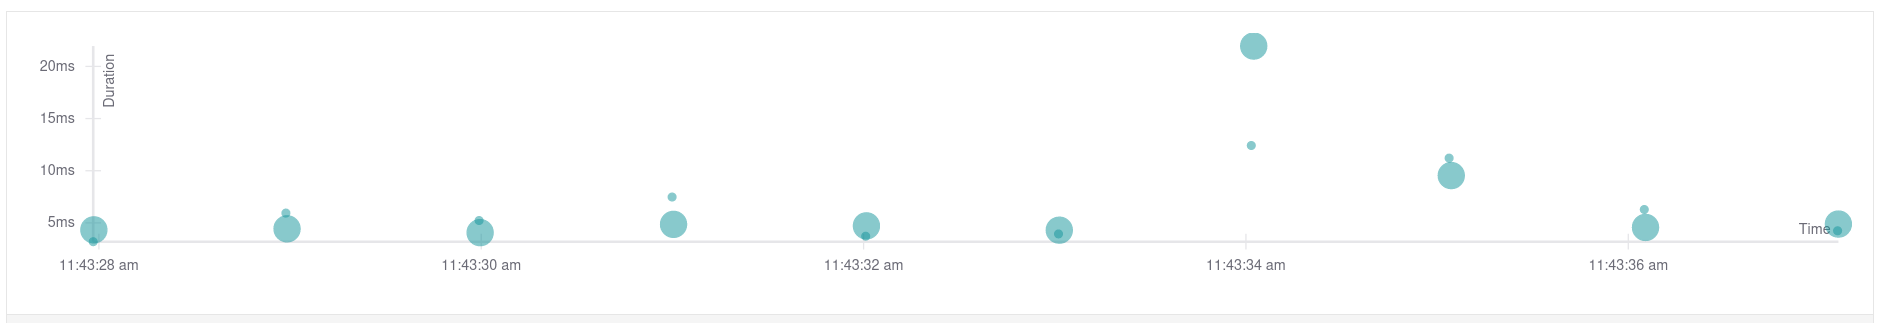
Data Viz

Scenario V
Custom Variables
More ...
Standard JSON Reports
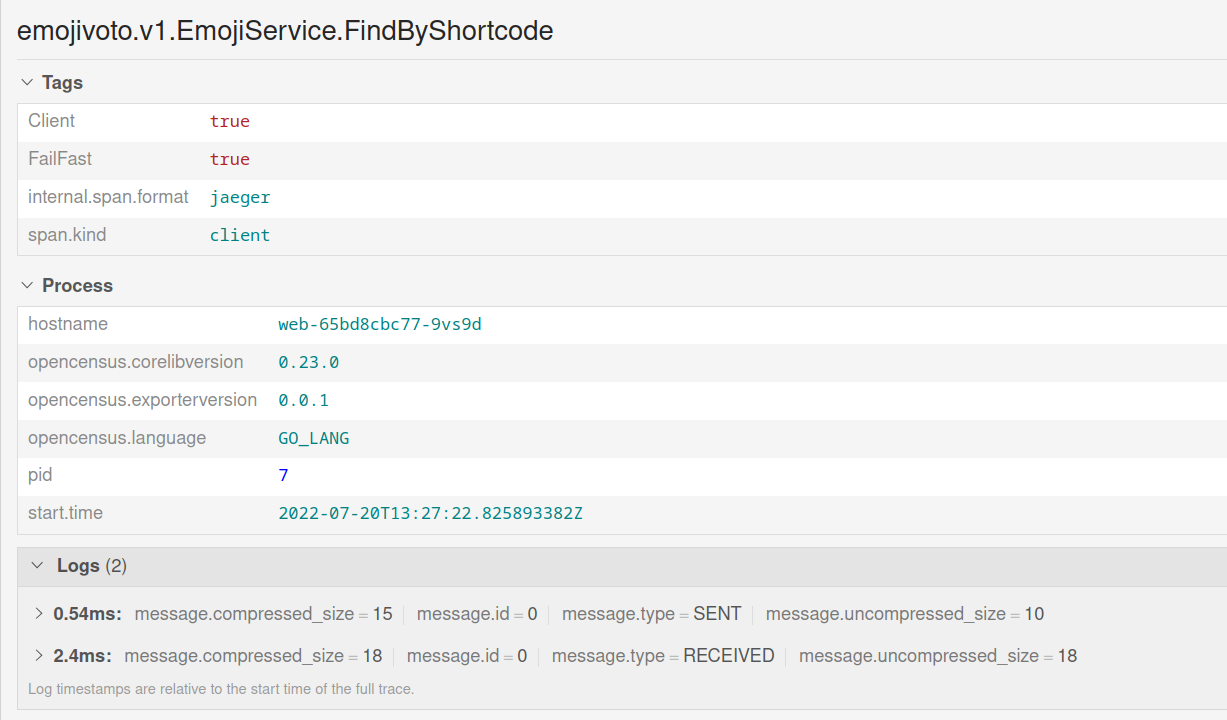
Correlation with the application logs
Application instrumentation SDKs
Caveats
1. Language Coverage for instrumentation
2. View request-response data for all network requests
We're almost done
1. A de-facto internal tool for debugging a call loop.
2. It will enable roles to debug a scenario instead of just individual personas.
3. Everyone will have a better-shared understanding of a call loop.
Fin.
Call Graph Init
By lamba


