
Elixir Wrocław № 3
Elixir Wrocław № 3

lucjan@surferseo.com
...or how I co-founded Elixir-first startup


Profiling Elixir
Benchmarking vs Profiling
250ms
20%
40%
20%
8%
BENCHMARK
PROFILE
Benchmarking vs Profiling
250ms
20%
40%
20%
8%
BENCHMARK
PROFILE
How long does it take?
What is the slowest part?
Benchmarking vs Profiling
Code optimization loop
IDENTIFY
SLOW CODE
Code optimization loop
IDENTIFY
SLOW CODE
BENCHMARK
Code optimization loop
IDENTIFY
SLOW CODE
BENCHMARK
PROFILE
Code optimization loop
IDENTIFY
SLOW CODE
BENCHMARK
IMPROVE
PROFILE
Code optimization loop
IDENTIFY
SLOW CODE
BENCHMARK
PROFILE
IMPROVE
Code optimization loop
["Elixir", "is", "faster", "than", "Ruby"]
[["Elixir", "is"],
["is", "faster"],
["faster", "than"],
["than", "Ruby"]]
def bigrams(list) do
  list
    |> Enum.with_index()
    |> Enum.reduce([],
    fn {item, index}, acc ->
      [Enum.slice(list, index, 2) |
      acc]
    end) |> Enum.filter(fn grams ->
      Enum.count(grams) == 2
    end)
end
def bigrams(list)
list
.each_with_index
.reduce([])
{|acc, (item, index)|
[list.slice(index, 2)] +
acc
}.select {|grams|
grams.length == 2
}
end


?? ms
?? ms
list = 1..100000 |> Enum.into([])
before_time = :os.system_time(:milli_seconds)
Bigrams.bigrams(list)
IO.inspect(
  :os.system_time(:milli_seconds) - before_time
)
list = (1..10000).to_a
now = (Time.now.to_f * 1000).to_i
bigrams(list)
puts(
Time.now.to_f * 1000).to_i - now
)130 ms
620 ms
* for list of 10 000 integers
lower is better
130 ms
620 ms

Elixir supposed to be faster than Ruby!!!1one
Let's find out what the hell is going on

Benchee.run(
  %{
    "initial" => fn -> Bigrams.get(list) end
  }
)
https://github.com/bencheeorg/benchee
Name              ips        average  deviation         median         99th %
initial        2.82 K      354.35 μs    ±16.26%      339.00 μs      583.00 μs
Honorable mention: benchfella
Benchee
https://github.com/alco/benchfella
http://erlang.org/doc/efficiency_guide/profiling.html
Erlang profiling trio
cprof
eprof
fprof
http://erlang.org/doc/efficiency_guide/profiling.html
Erlang profiling trio
speed
details
cprof
eprof
fprof
http://erlang.org/doc/efficiency_guide/profiling.html
Erlang profiling trio
speed
details
speed
details
cprof
eprof
fprof
http://erlang.org/doc/efficiency_guide/profiling.html
Erlang profiling trio
cprof
eprof
fprof
speed
details
speed
details
speed
details
https://hexdocs.pm/mix/Mix.Tasks.Profile.Eprof.html
Elixir profiling trio
mix profile.cprof
mix profile.eprof
mix profile.fprof
Showtime
Running profiler directly from the code
defmodule FProf do
  defmacro profile(do: block) do
    content = quote do
      Mix.Tasks.Profile.Fprof.profile(fn -> unquote(block) end,
        warmup: false, callers: true)
    end
    Code.compile_quoted(content)
  end
end

profile do
  very_slow_function()
end
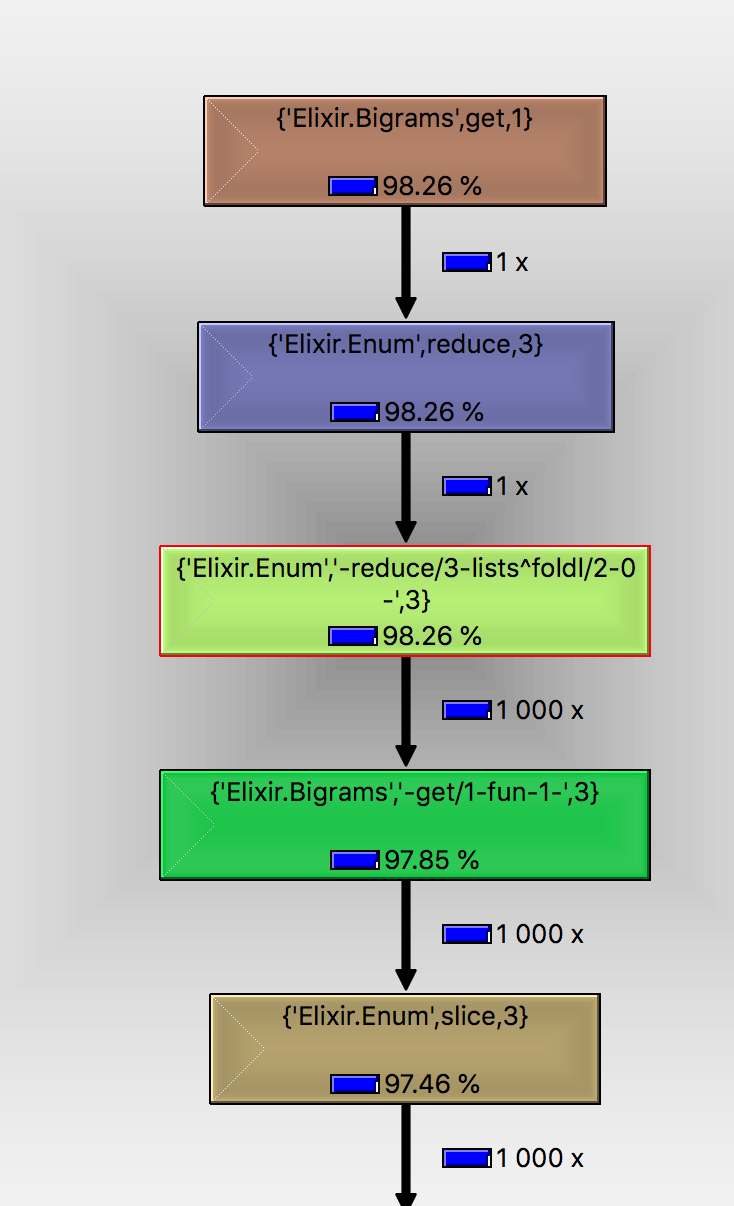
Visualisations
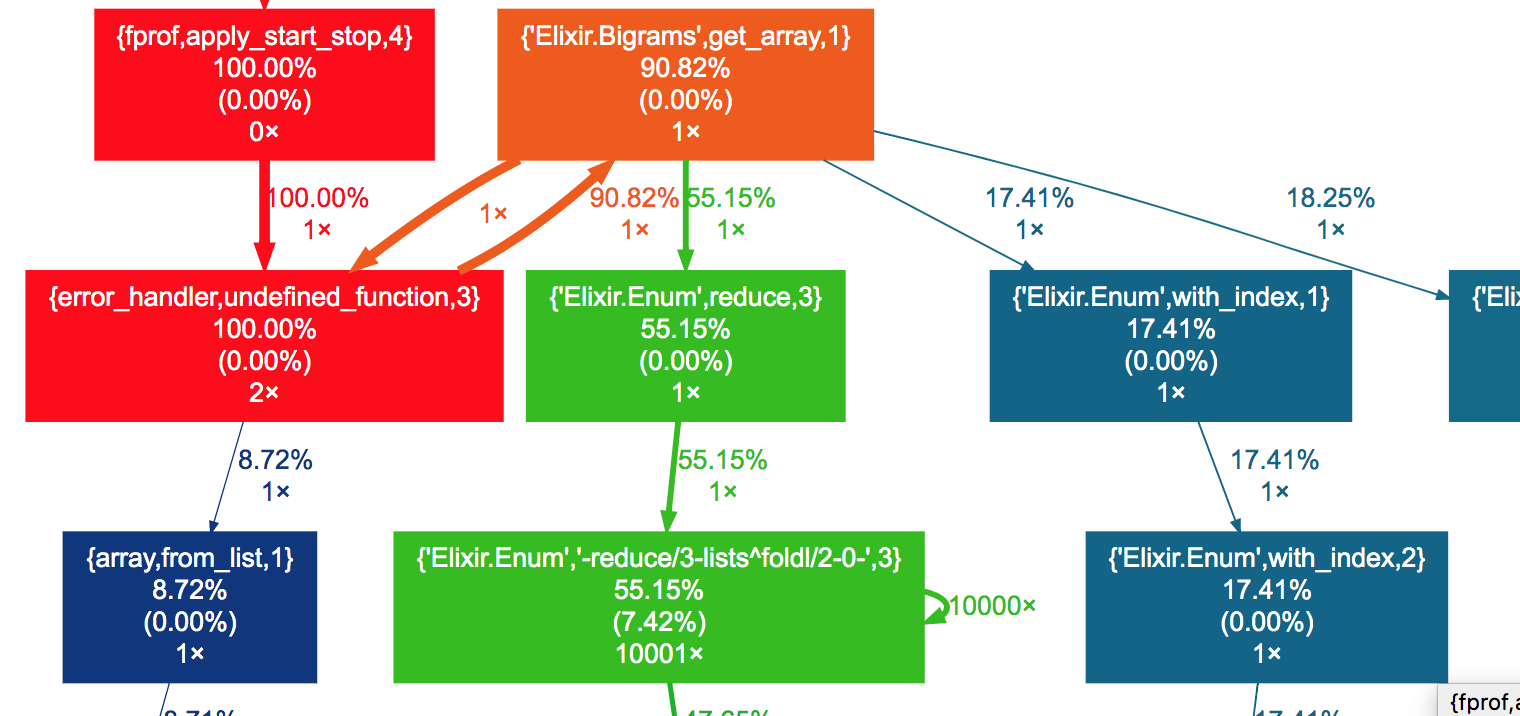
https://github.com/jrfonseca/gprof2dot
direct erlang fprof
erlgrind
:fprof.apply(Bigrams, :get_array, [list])
:fprof.profile()
:fprof.analyse({:dest, 'out.fprof'})

$ ./erlgrind out.fprof out.cgrind
Visualisations
https://github.com/jrfonseca/gprof2dot
callgrind
KCacheGrind
gprof2dot
webgraphviz.com
Visualisations
eflame
{:eflame, "~> 1.0"}

mix run -e ":eflame.apply(Bigrams, :get, [])" && \
./deps/eflame/stack_to_flame.sh < stacks.out > flame.svg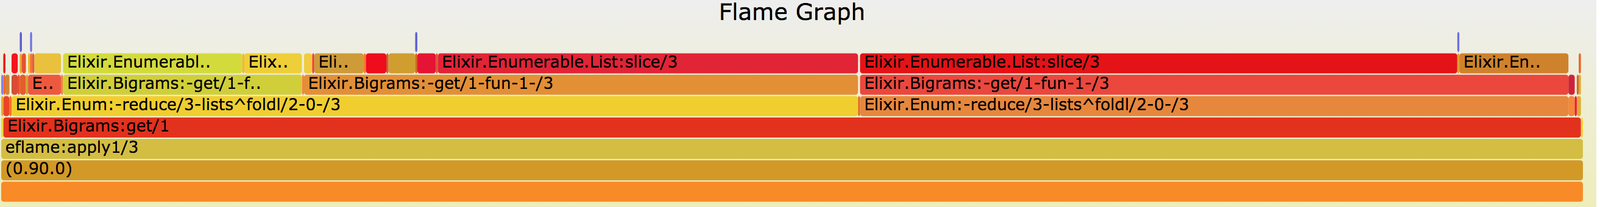
Shameless plug

WE ARE HIRING!
Thank you!
Profiling Elixir
By Lucjan Suski