


Lynn Langit
Cloud Architect who codes
Cloud Systems
Chicago 2020
Lynn Langit
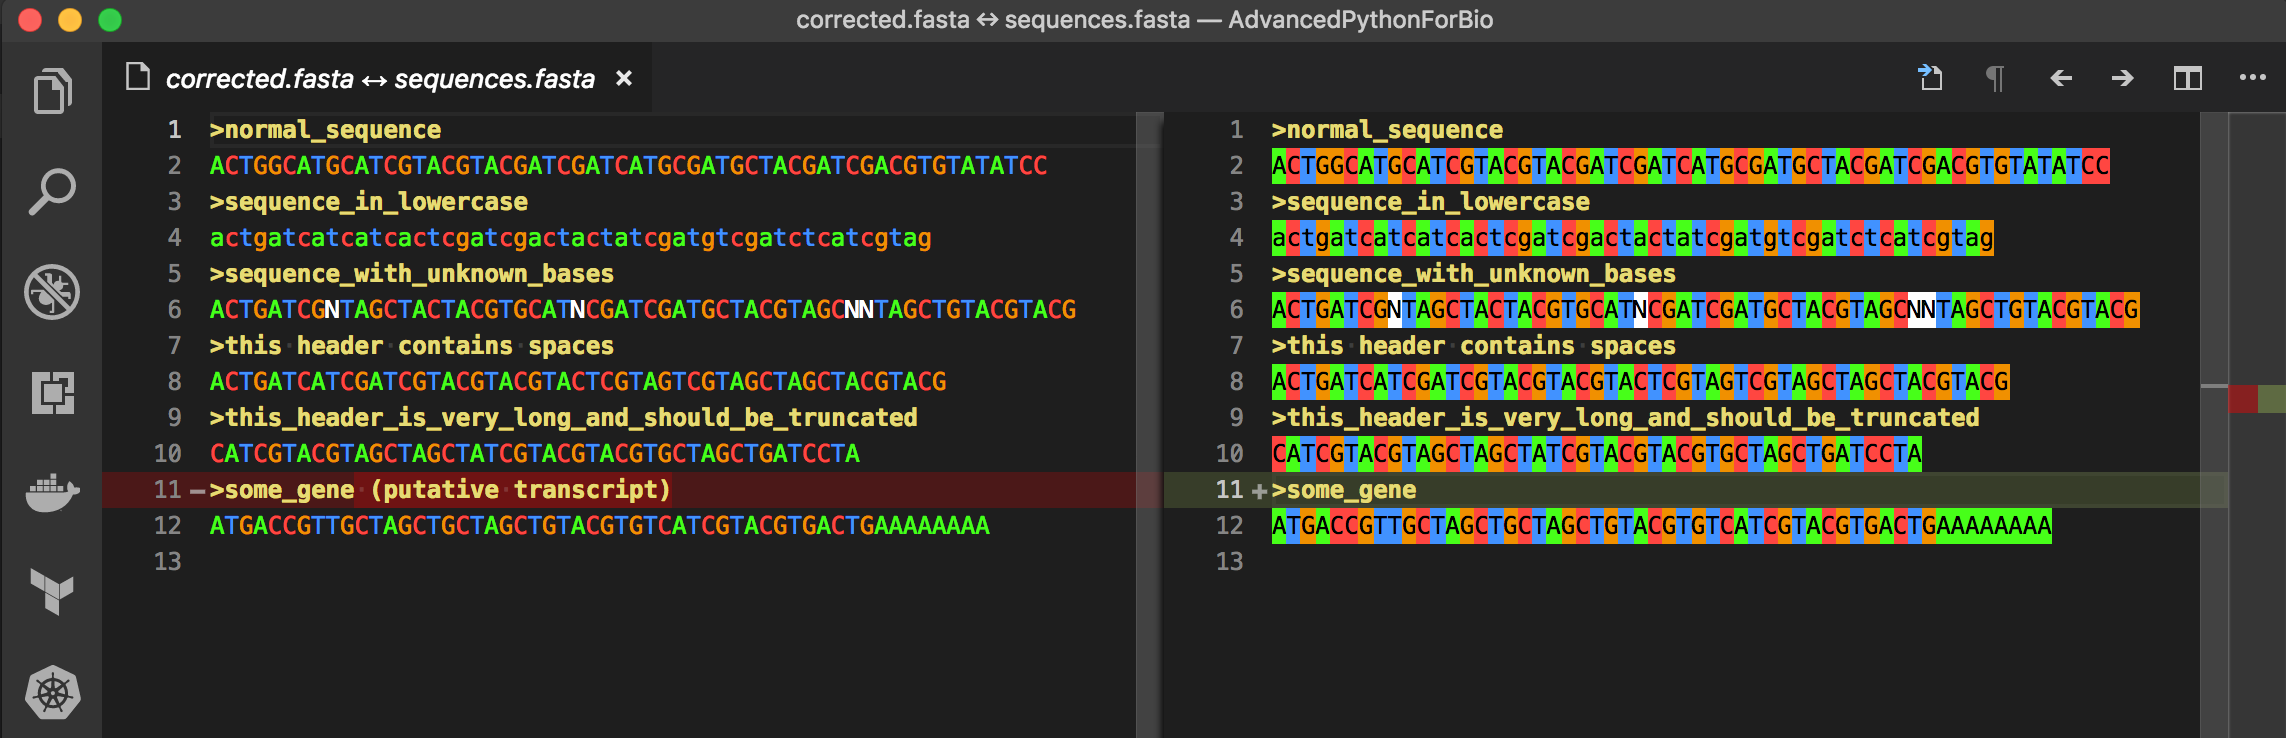
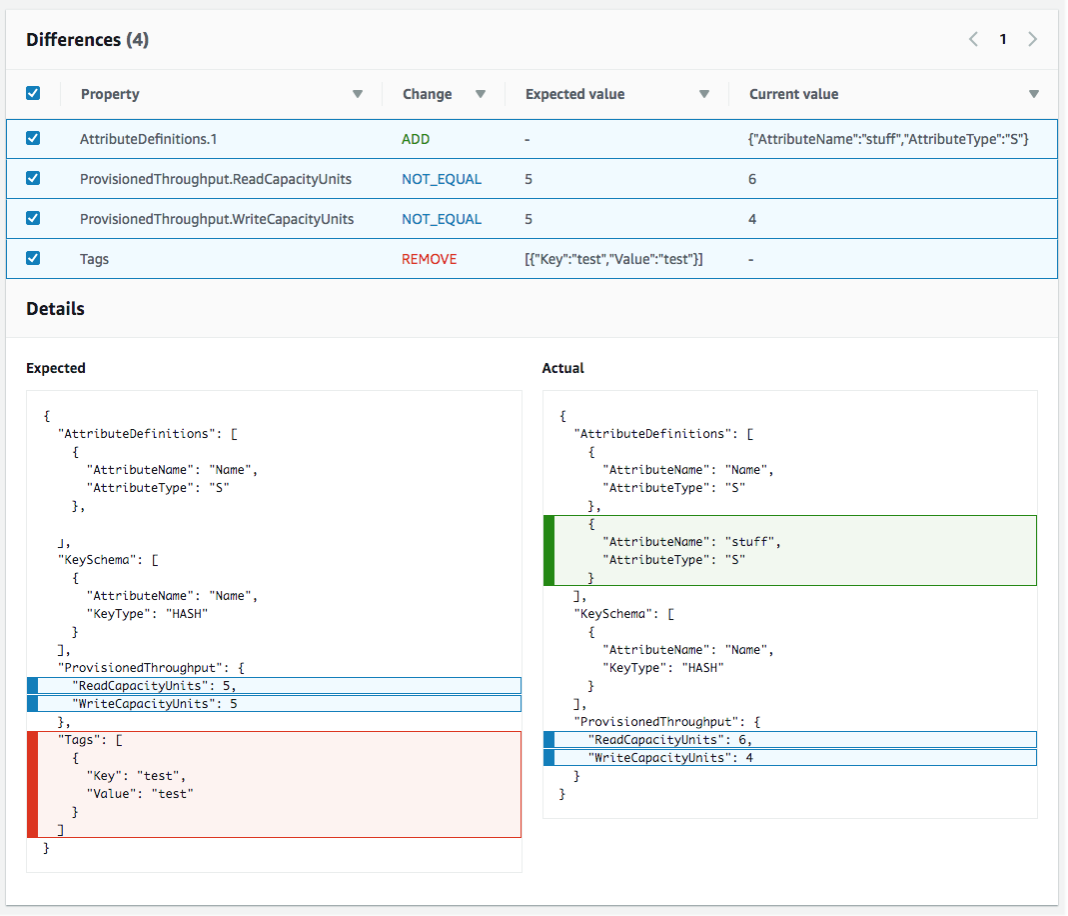
| TYPE | METHOD | INFO |
|---|---|---|
| WebUI | click to create | AWS, GCP, Alibaba Cloud |
| Script | bash-like Pythonic |
awscli, gcloud, aliyun |
| Deployment | Template YAML/JSON visual tool |
AWS CloudFormation, GCP Deployment FUN template |
| Infrastructure | language visual tool |
Terraform |
| Vertical bioinformatics |
language |
WDL, CWL Nextflow |
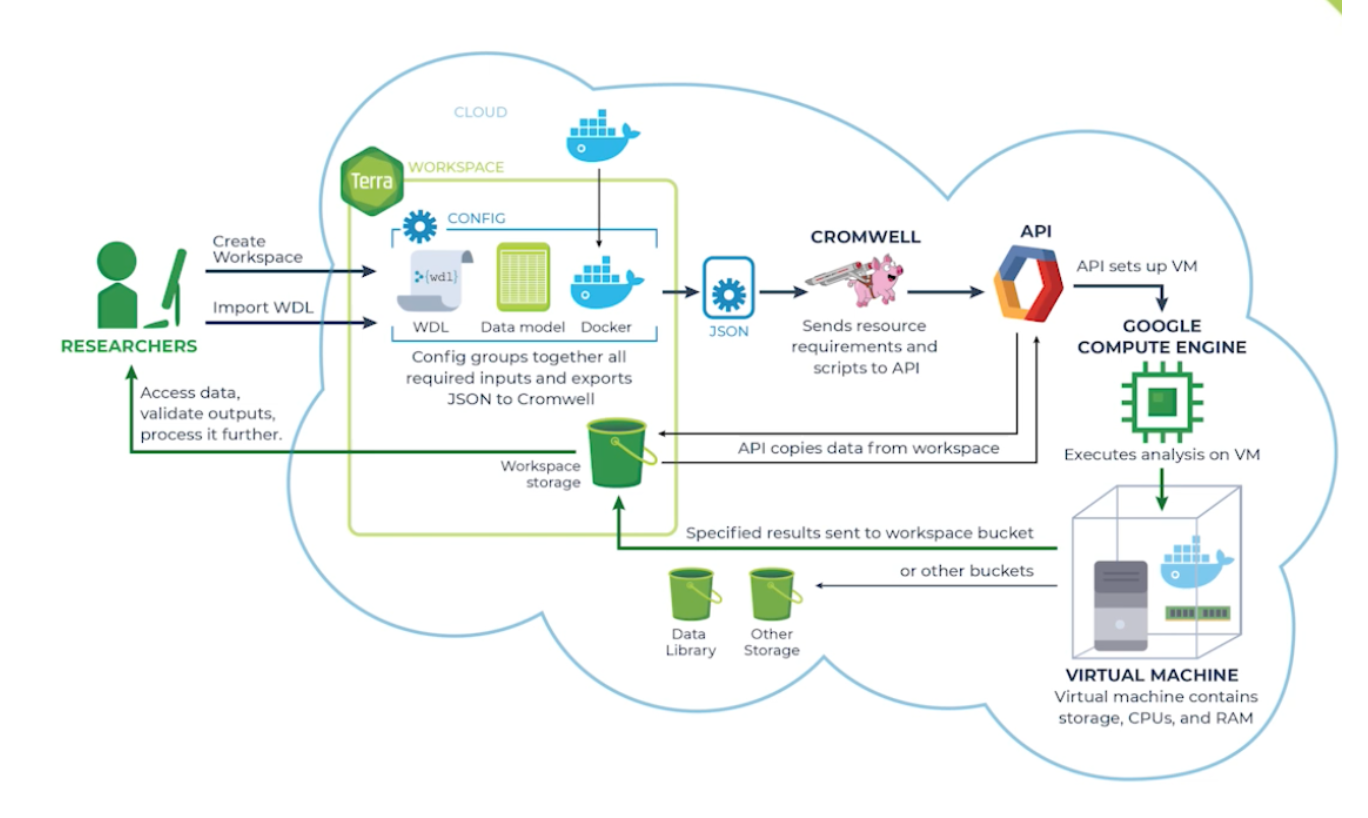
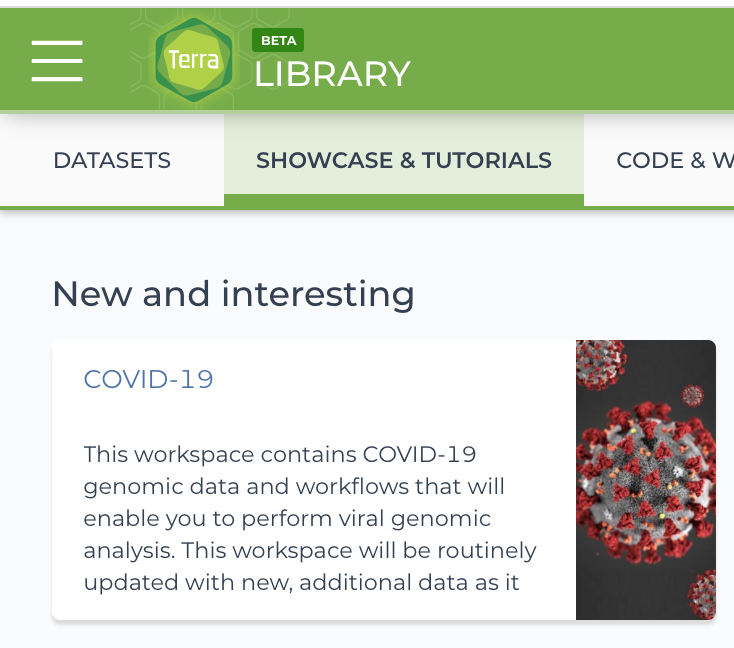
| Vertical WebUI | visual tool | Terra.bio on GCP Galaxy Project on AWS |
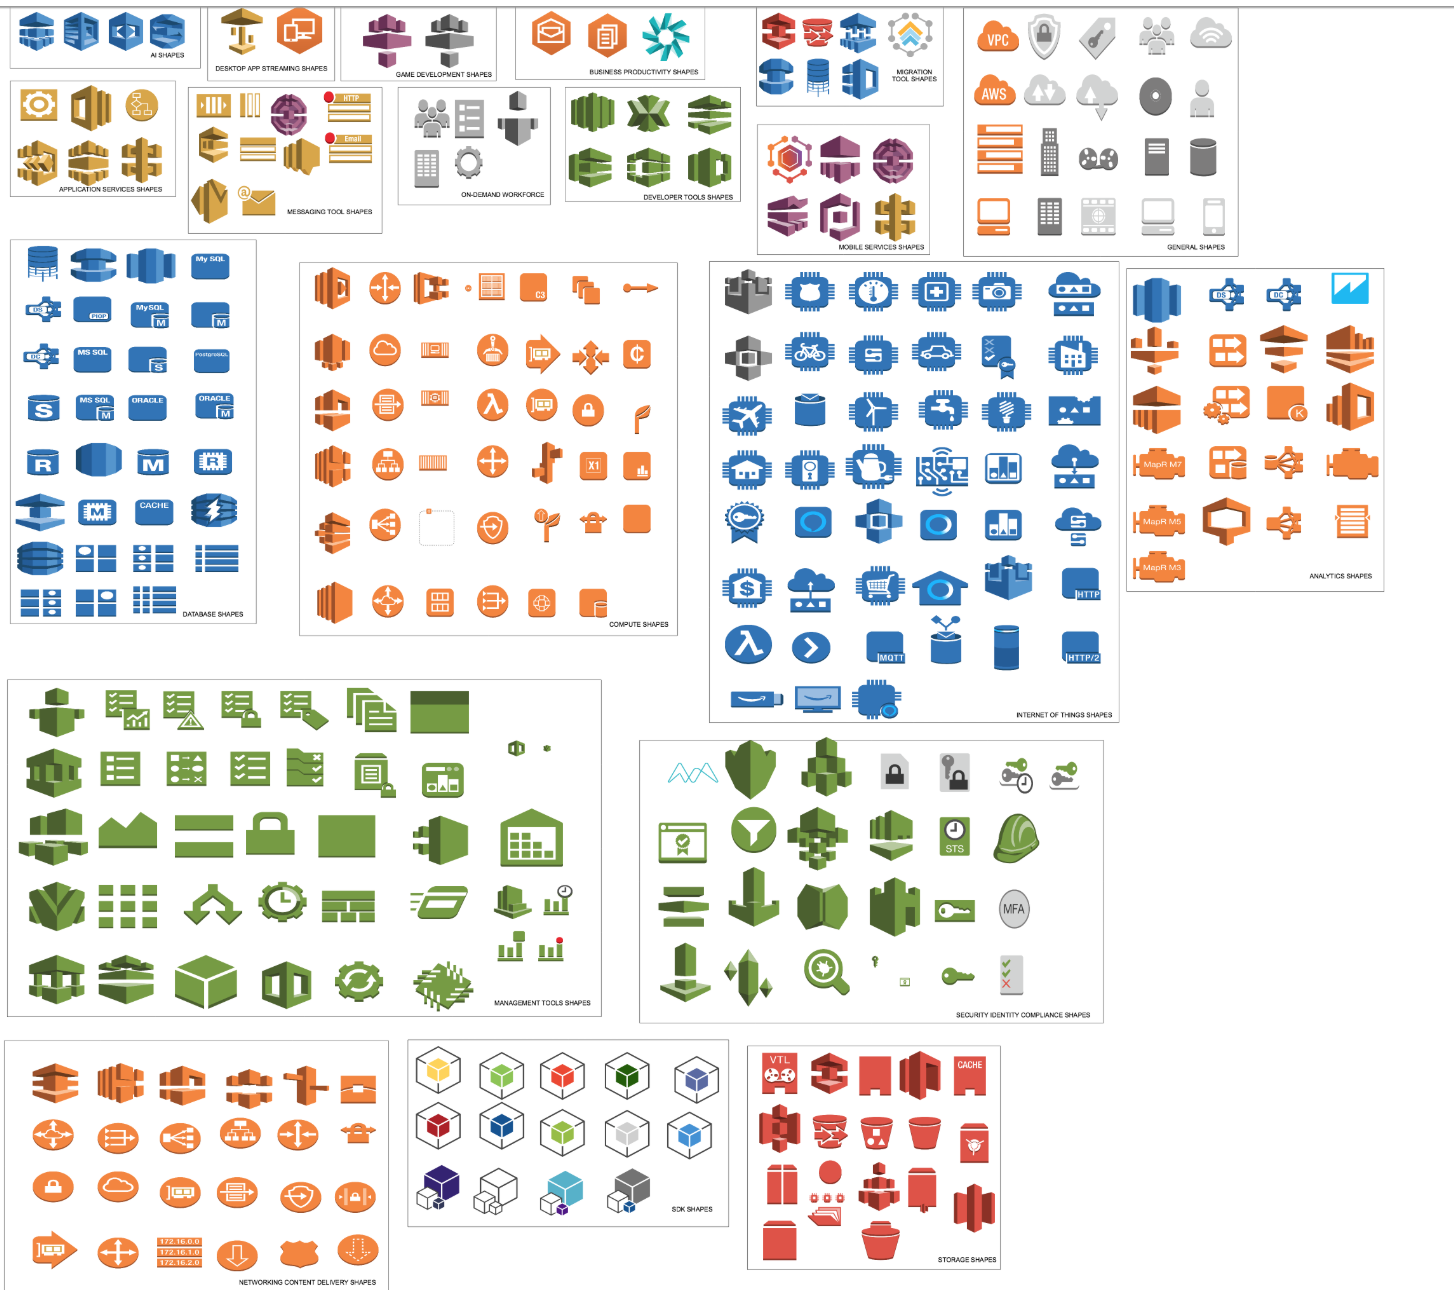
do icons matter?
Time: 1 Day
Speed: 80% faster
can we solve a more difficult challenge?
solving difficult problems
terraform {
  backend "s3" {
    bucket  = "variant-spark-july"
    key     = "variantspark-k/tfstate"
    region  = "us-west-2"
    profile = "default"
  }
}

provider "aws" {
  profile = "${var.profile}"
  region  = "${var.default_region}"
}

provider "aws" {
  alias   = "use1"
  profile = "${var.profile}"
  region  = "us-east-1"
}

module "eks-vpc" {
  source         = "modules/eks-vpc"
  "cluster-name" = "${var.cluster-name}"
}

module "eks-master-role" {
  source = "modules/eks-master-role"
}

module "eks-master-security-group" {
  source = "modules/eks-master-security-group"
  vpc_id = "${module.eks-vpc.vpc_id}"
}

module "eks-worker-role" {
  source = "modules/eks-worker-role"
}

module "eks-worker-security-group" {
  source = "modules/eks-worker-security-group"

  vpc_id                   = "${module.eks-vpc.vpc_id}"
  master_security_group_id = "${module.eks-master-security-group.security_group_id}"
  "cluster-name"           = "${var.cluster-name}"
}

module "eks" {
  source                   = "modules/eks"
  cluster_name             = "${var.cluster-name}"
  vpc_id                   = "${module.eks-vpc.vpc_id}"
  public_subnets           = "${module.eks-vpc.public_subnets}"
  master_role_arn          = "${module.eks-master-role.master_role_arn}"
  master_security_group_id = "${module.eks-master-security-group.security_group_id}"
  worker_role_arn          = "${module.eks-worker-role.worker_role_arn}"
  worker_profile_name      = "${module.eks-worker-role.worker_profile_name}"
  worker_security_group_id = "${module.eks-worker-security-group.security_group_id}"
  caller_profile           = "${var.profile}"
  eks_key_name             = "${module.kops-ssh.key_name}"
  spark_user_arn           = "${module.kops-user.arn}"
}

module "kops-user" {
  source = "modules/kops-user"
}

module "state-storage" {
  source = "modules/state-storage"
}

module "input-bucket" {
  source = "modules/input-bucket"
}

module "kops-ssh" {
  source = "modules/ssh-key"
}

data "aws_availability_zones" "available" {}

data "template_file" "env" {
  template = "${file("templates/env.tpl")}"
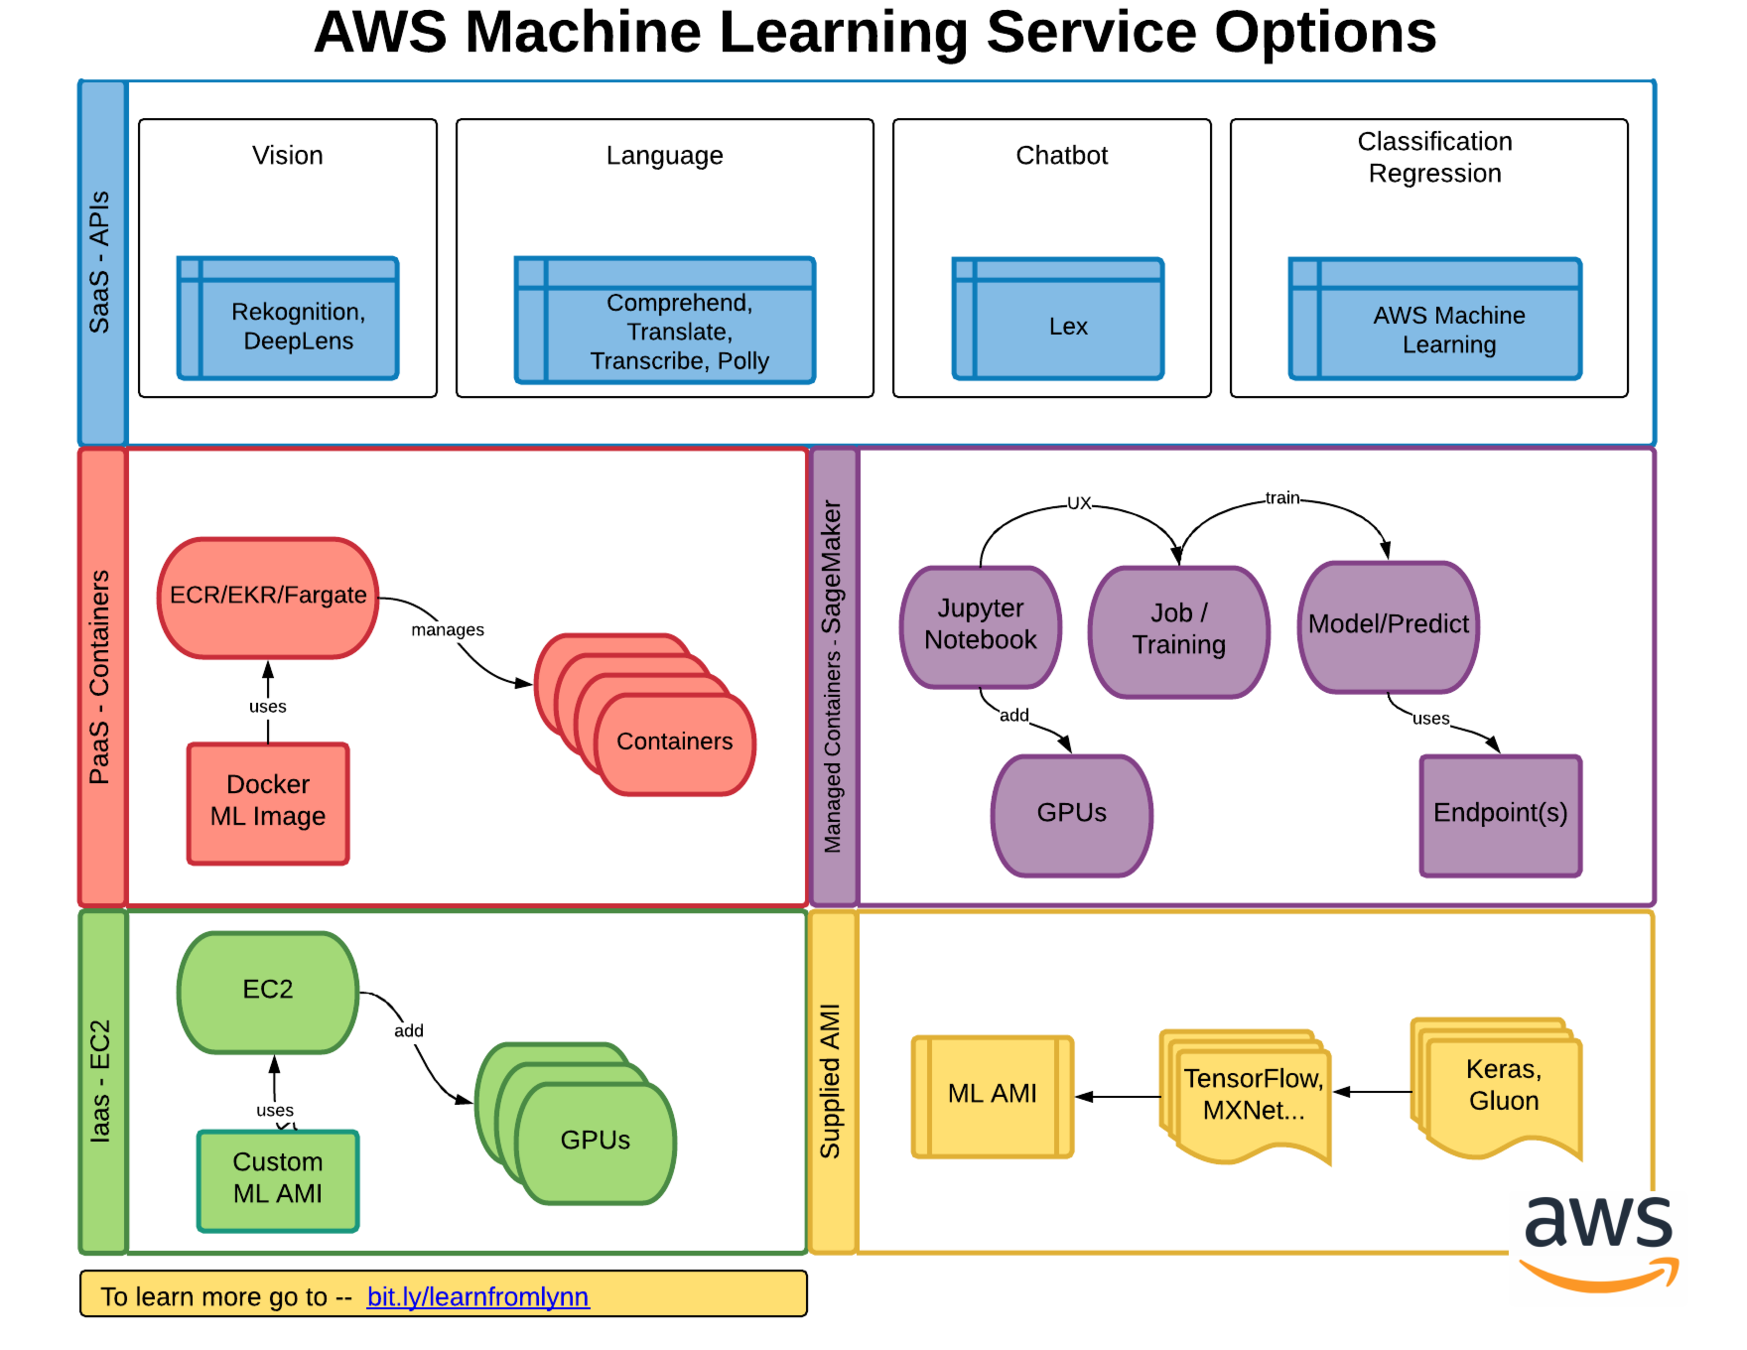
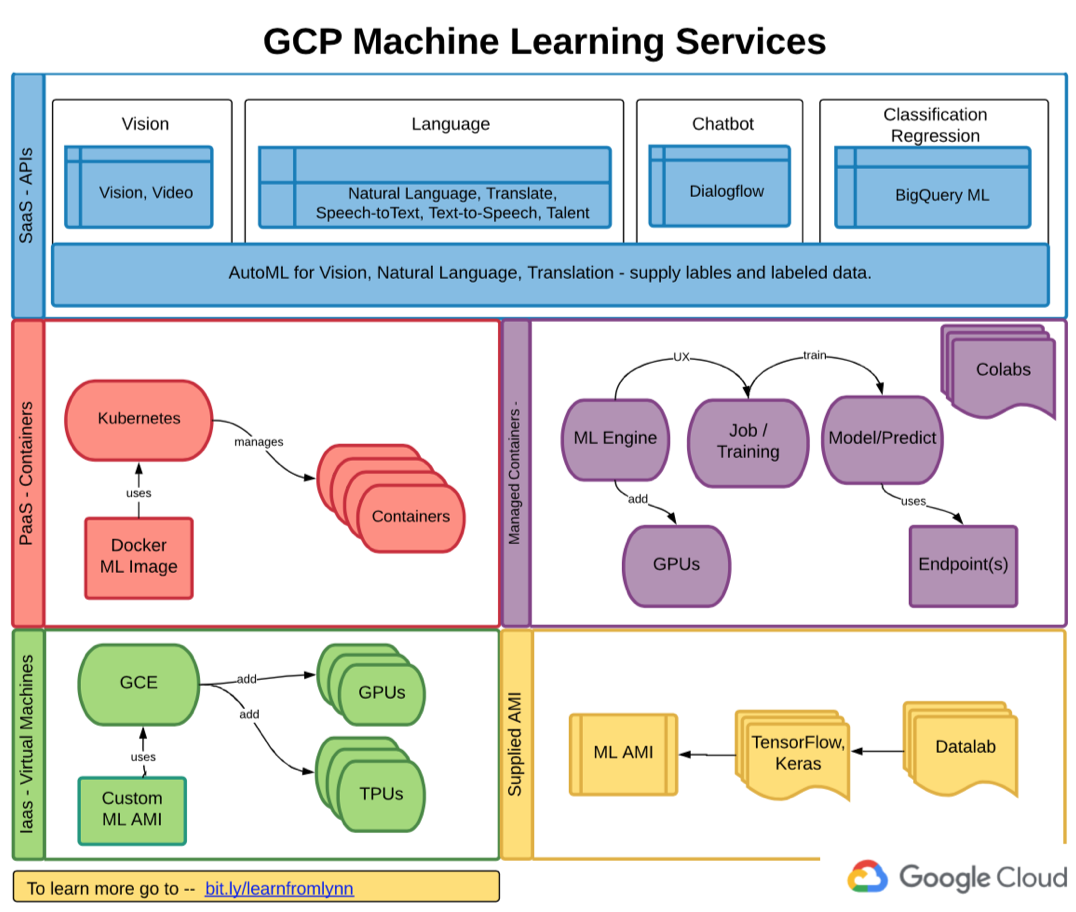
What does this "code" do?
toward adding complexity
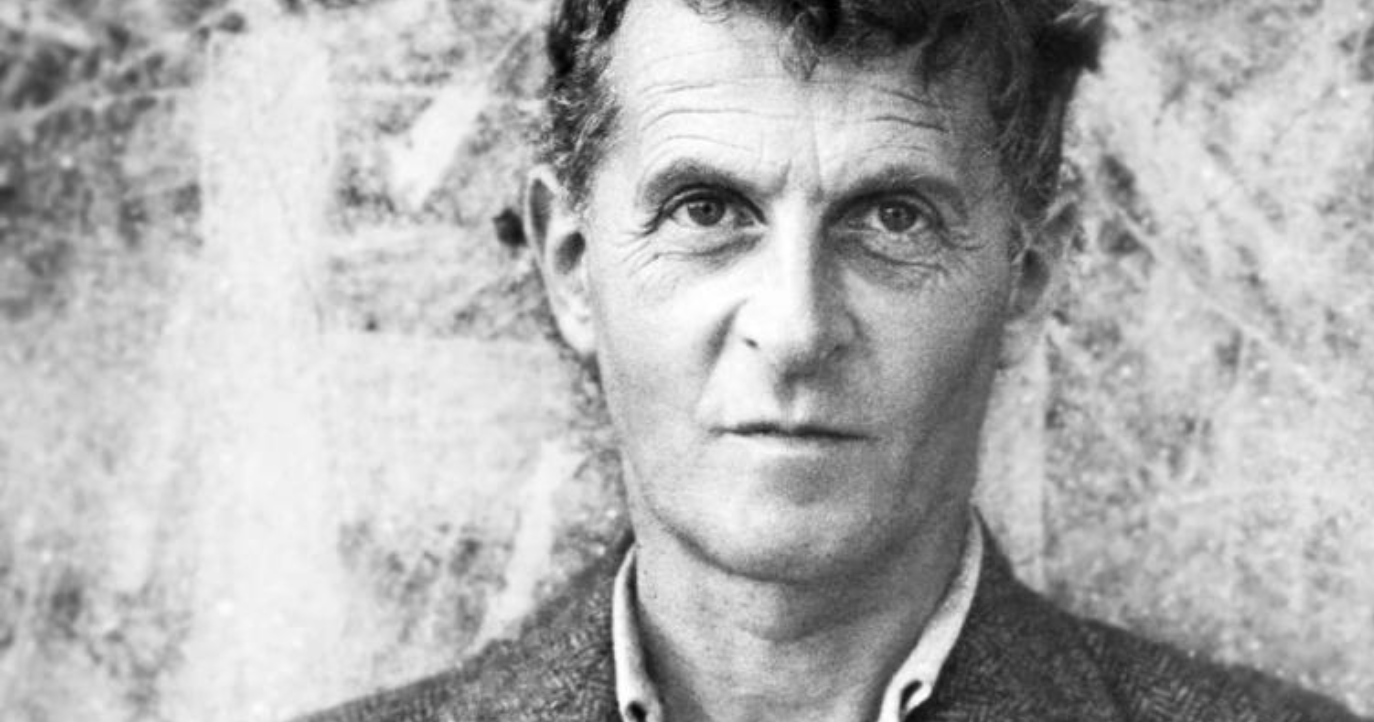
If we spoke a different language, we would perceive a somewhat different world." - Wittgenstein
- "The Dimensionality of Visual Space"
- "A Visual Interaction Framework for Dimensionality Reduction Based Data Exploration"
- "Understanding Visualization: A Formal Approach using Category Theory and Semiotics"
- "Introduction: The Geometry of the Visual Field—Early Modern and Contemporary Approaches"
- "Visualizing MNIST: An Exploration of Dimensionality Reduction"
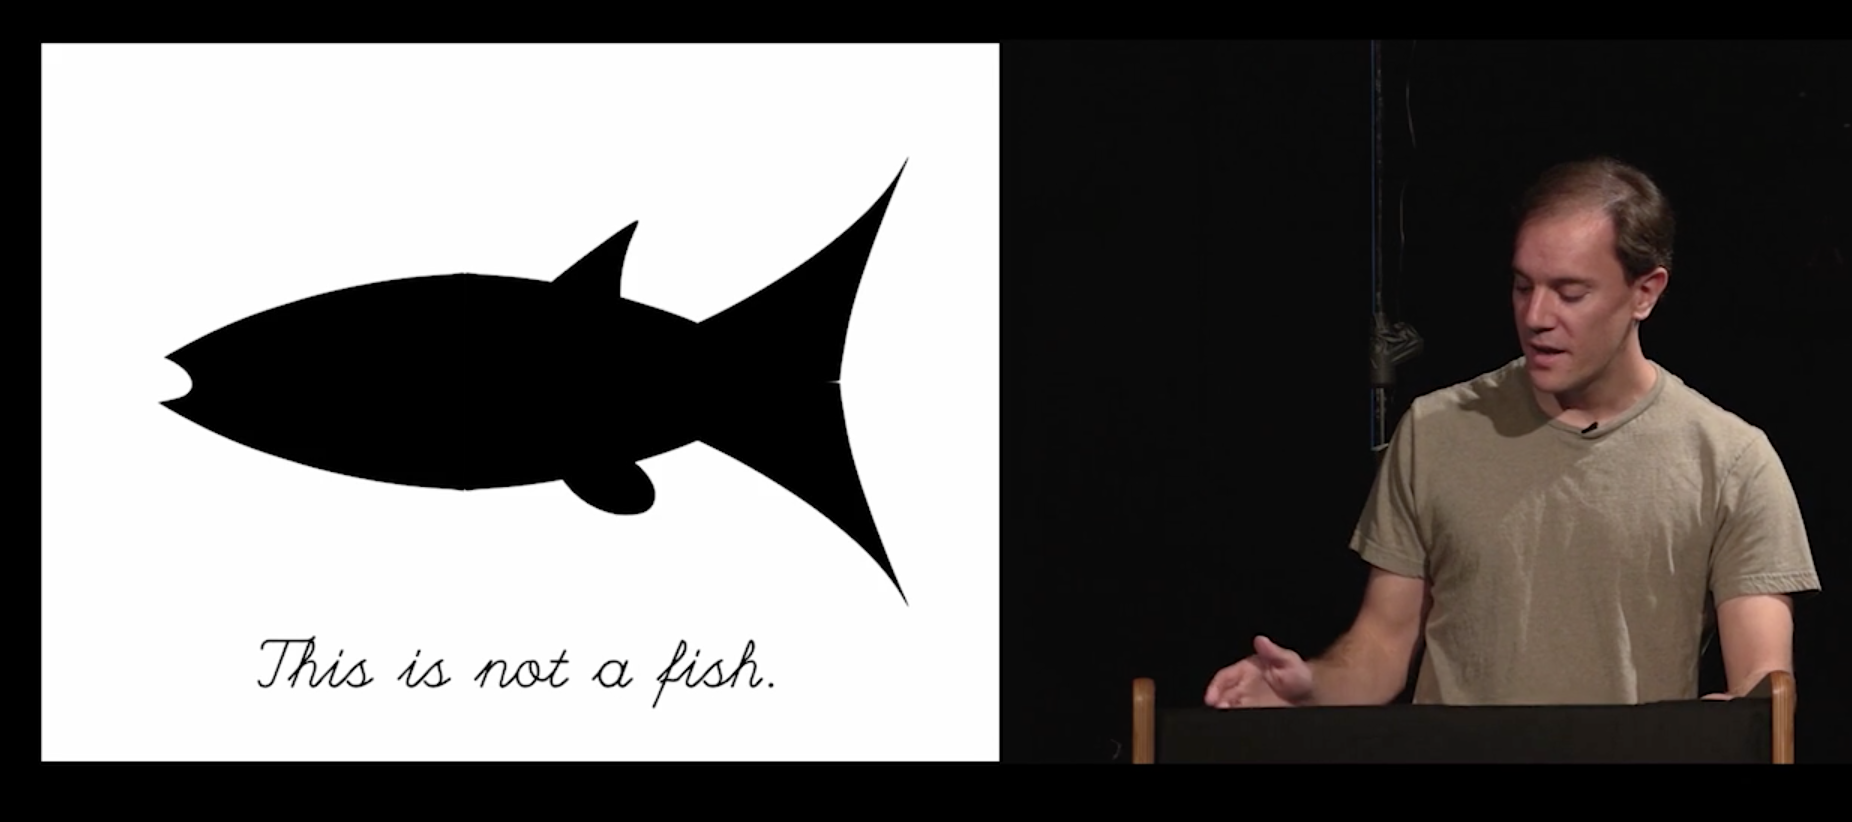
"Artists draw because they want to convey something they can't describe"
- Bret Victor
"If you can walk you can dance,
If you can talk you can sing. "
- African Proverb
not looking outward,
using only your own context
for Cloud Systems
a particular form of a language that is peculiar to a specific region or social group
| synonyms: |
regional language, local language, local speech, vernacular, idiom;
regionalisms, localisms; informal lingo
|
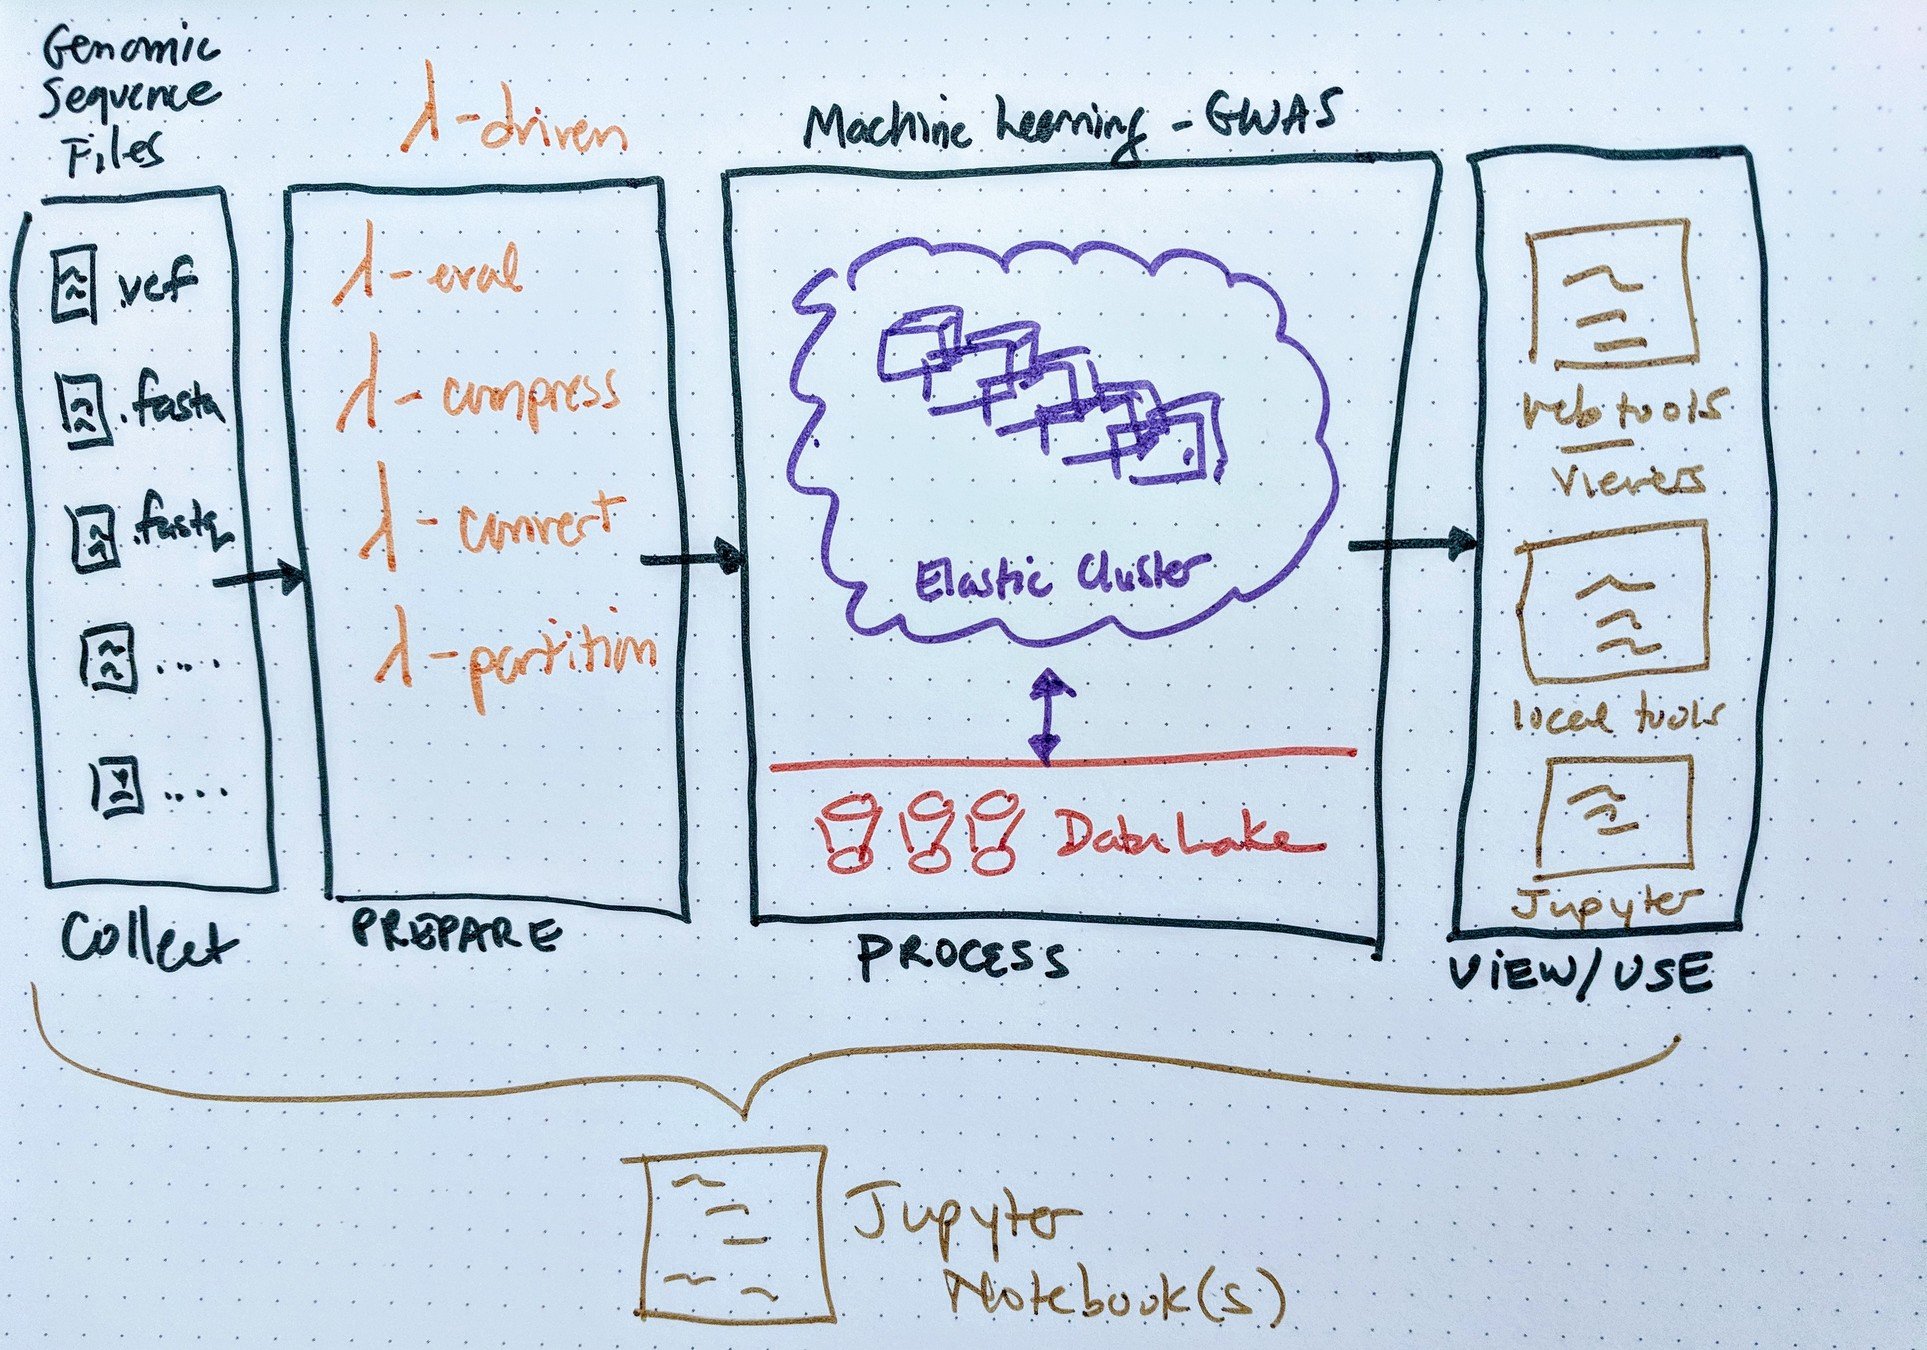
Executable Pathways
Reduction
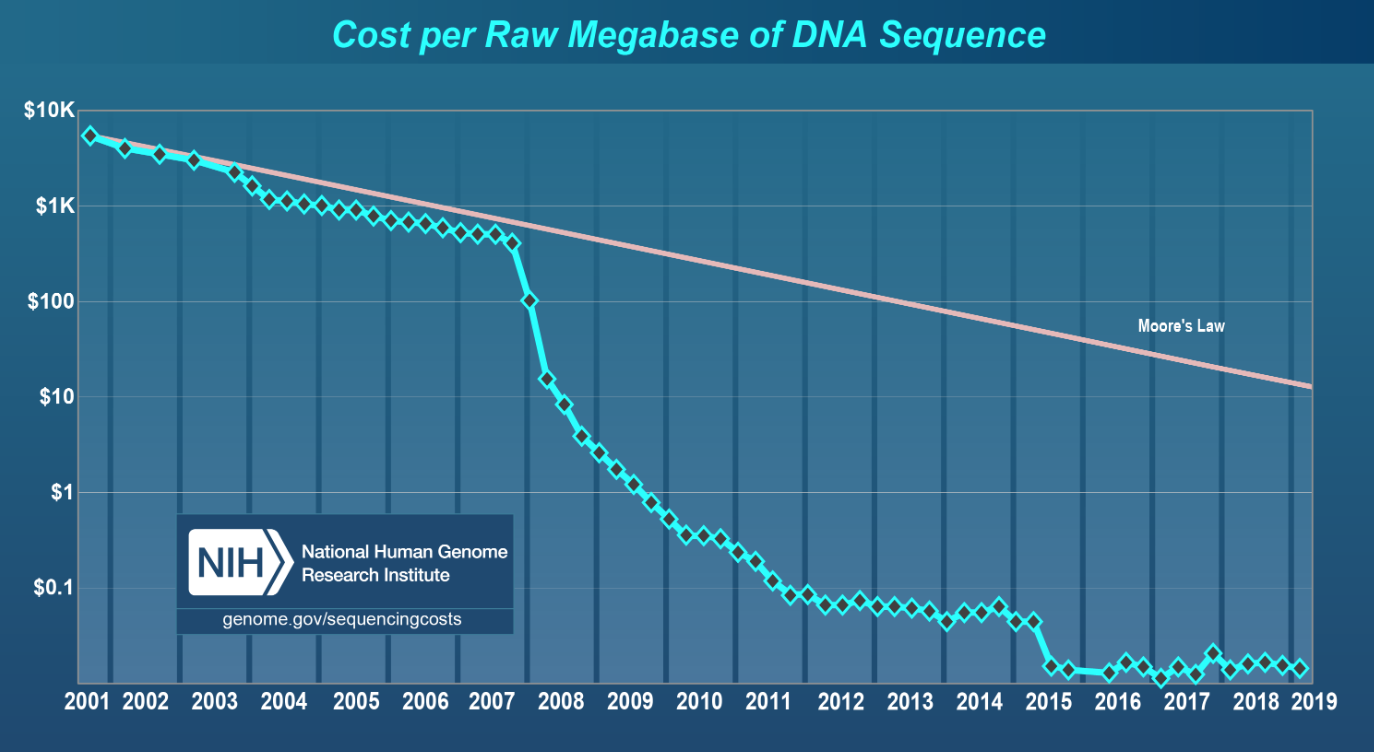
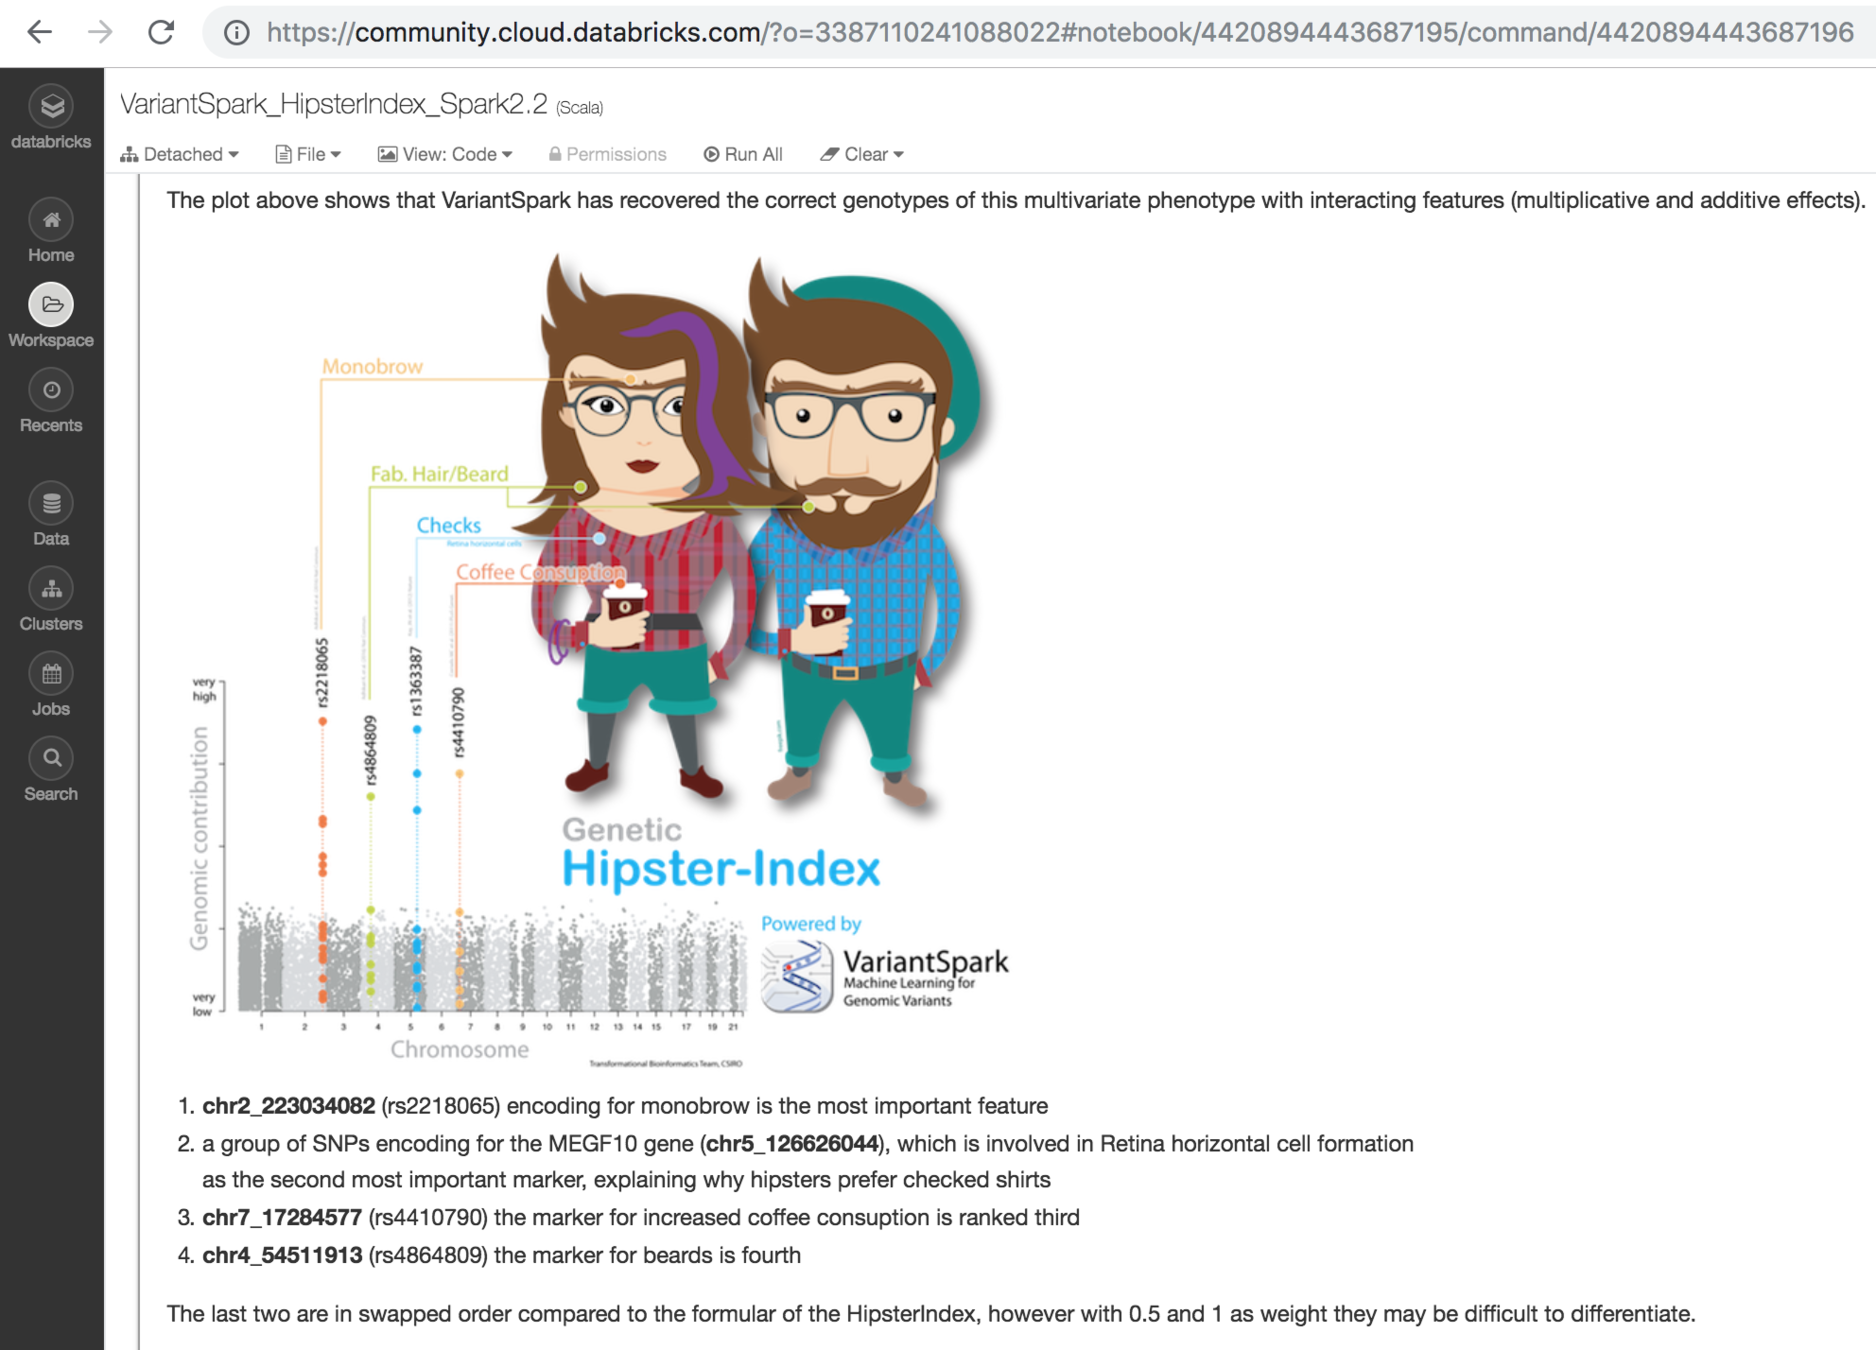
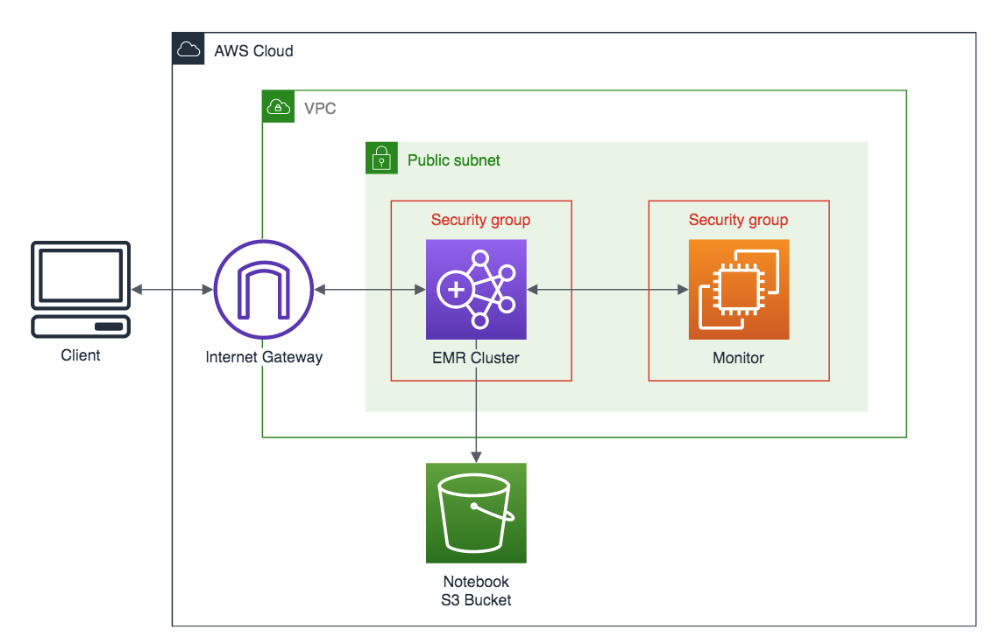
20 Samples w/
80 MILLION Features
1hour / ~ $ 3 USD
User | Developer | DevOps
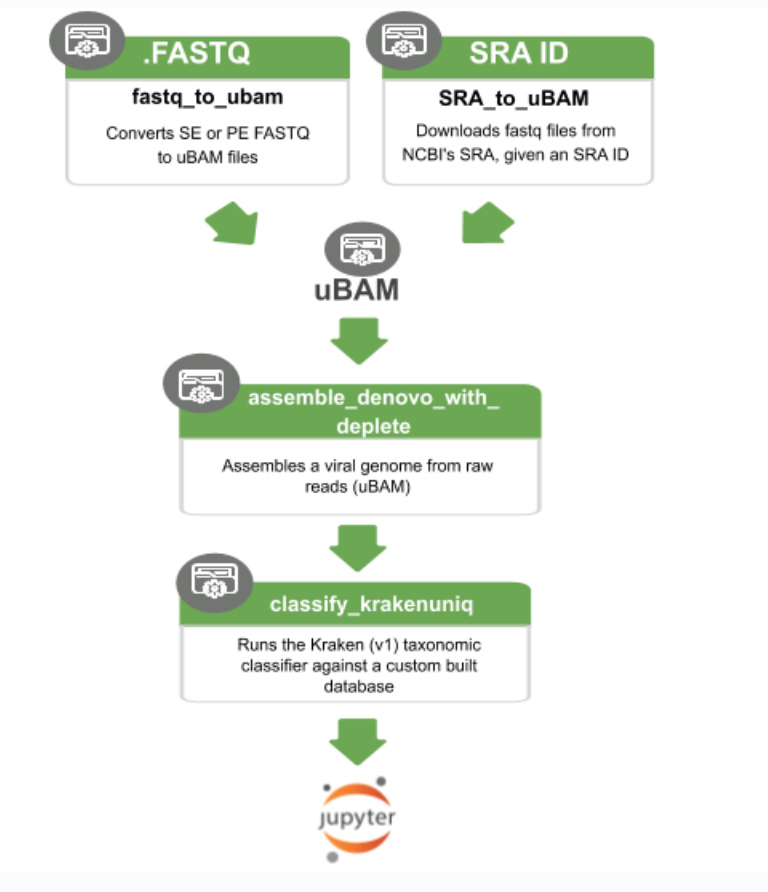
import "https://raw.githubusercontent.com/broadinstitute/viral-pipelines/master/pipes/WDL/tasks/tasks_taxon_filter.wdl" as taxon_filter
import "https://raw.githubusercontent.com/broadinstitute/viral-pipelines/master/pipes/WDL/tasks/tasks_assembly.wdl" as assembly

workflow assemble_denovo_with_deplete {

  call taxon_filter.deplete_taxa

  call taxon_filter.filter_to_taxon {
    input:
      reads_unmapped_bam = deplete_taxa.cleaned_bam
  }

  call assembly.assemble {
    input:
      reads_unmapped_bam = filter_to_taxon.taxfilt_bam
  }

  call assembly.scaffold {
    input:
      contigs_fasta = assemble.contigs_fasta,
      reads_bam = filter_to_taxon.taxfilt_bam
  }

  call assembly.refine_2x_and_plot {
    input:
      assembly_fasta = scaffold.scaffold_fasta,
      reads_unmapped_bam = deplete_taxa.cleaned_bam
  }
}
Text
What does this "code" do?
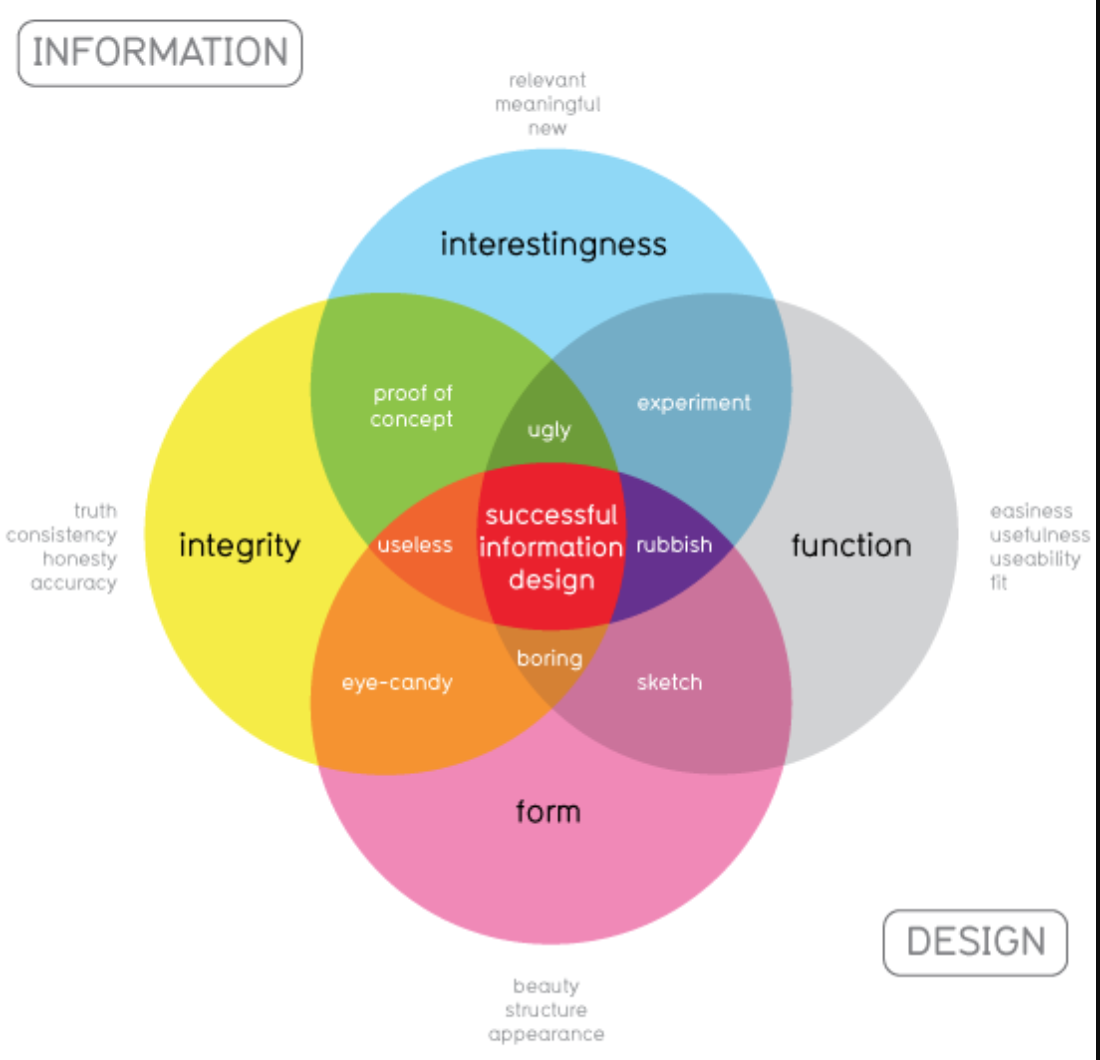
| ACTION | TARGET | INFO |
|---|---|---|
| Visualize | Entire System | Code, Config & Data Entry point (Hello...) |
| Use | Visual Grammars | Account for bias, audience |
| Reduce | Dimensionality | Show 3-5 aspects max |
| Show | System State | Over time |
| Verify | Pictured Objects | Reproducibility |
Cloud Systems
@lynnlangit
Promising Directions
| TYPE | METHOD | INFO |
|---|---|---|
| WebUI | log viewer | AWS CloudWatch, GCP Operations, Alibaba Logs |
| Alerts | bash-like Pythonic |
awscli, gcloud, aliyun |
| Aggregations | script | AWS Log Metrics, GCP Operations Metrics |
| WebUI | language visual tool |
Honeycomb Thundra |
| Vertical WebUI | language visual tool |
Terra.bio JobRunner on GCP Nextflow Tower Galaxy Project Job Executions on AWS |
"a new way to see, hear and interpret scientific data"
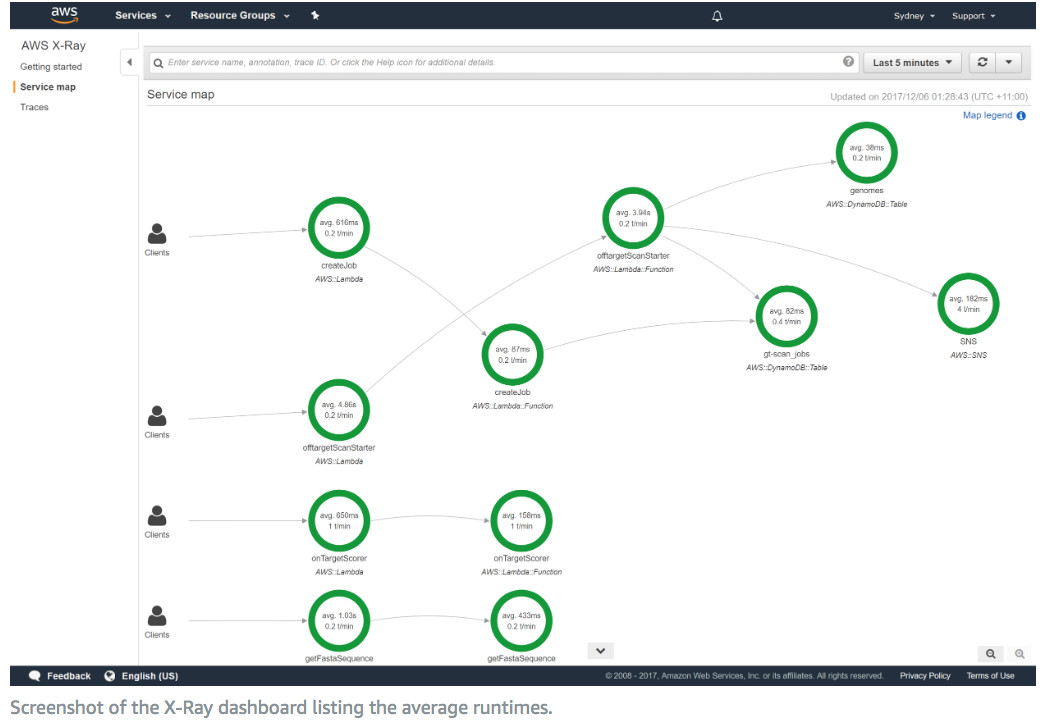
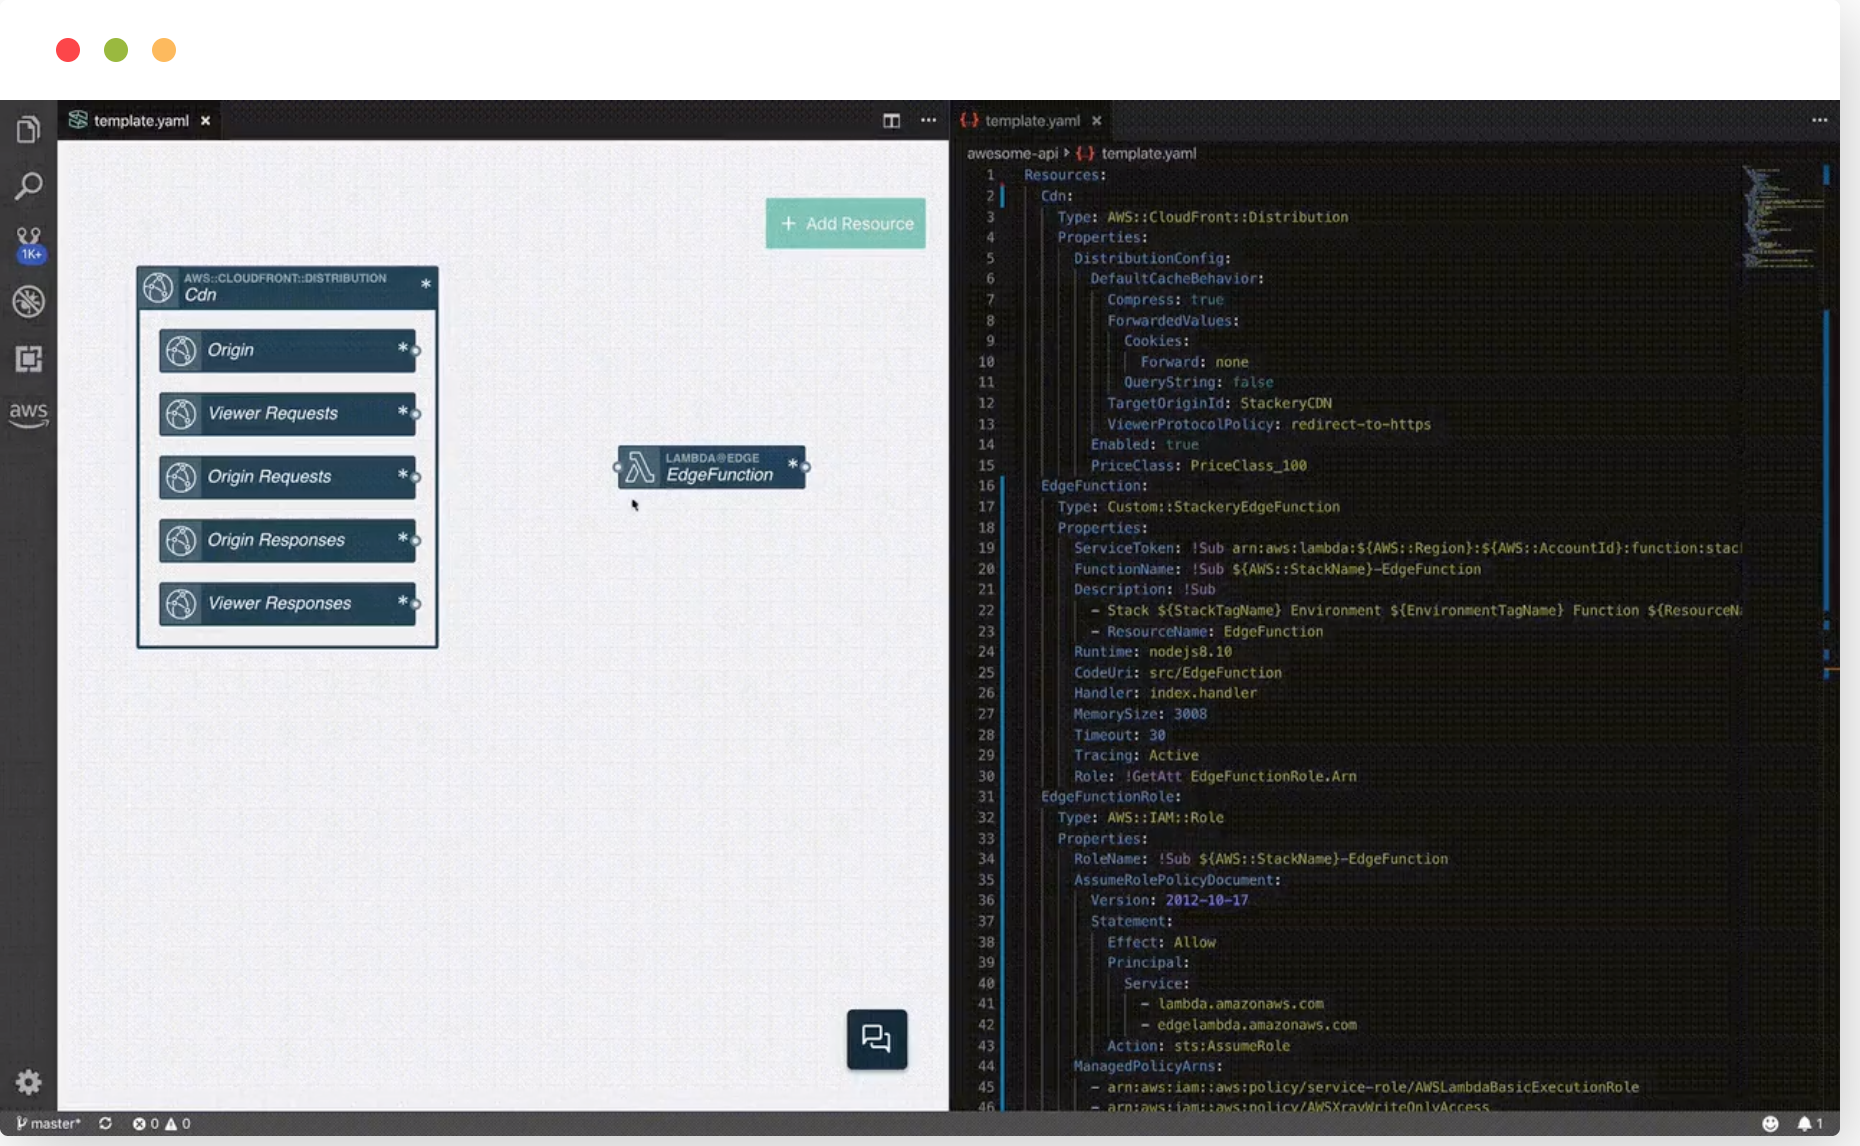
| Company | Product/Service | Notable | Lifecycle |
|---|---|---|---|
| AWS | Cloud Formation X-Ray |
Drift Detection Log Visualization |
ALL |
| GCP | GCP console | Integration of estimated service costs | ALL |
| Stackery CloudCraft |
Draw Config | Generates YAML Monitors costs |
BUILD/DEPLOY |
| Thundra Epsagon |
Log Aggregation | Includes external services Application / transactions |
OPERATE |
| Datadog | ARM for Serverless | Log Visualization | OPERATE |
| Honeycomb | Honeycomb | Query and visualize event patterns | OPERATE |
By Lynn Langit
GOTO Chicago - 2020


