Dataviz 101
Gent
29 november
@maartenzam
REC
Wat? Hoe? Waarom?
Programma
Dataviz 101
Wat is het?
Van waar komt het?
Hoe werkt het?
Wat kan je er mee?
Basisgrafieken
Tools
I
Datavis dissectie
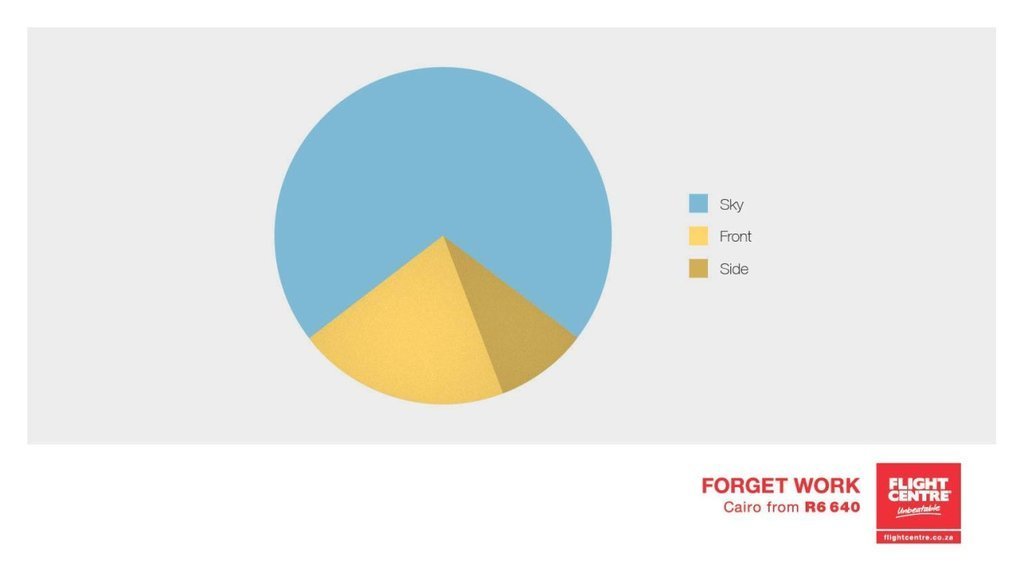
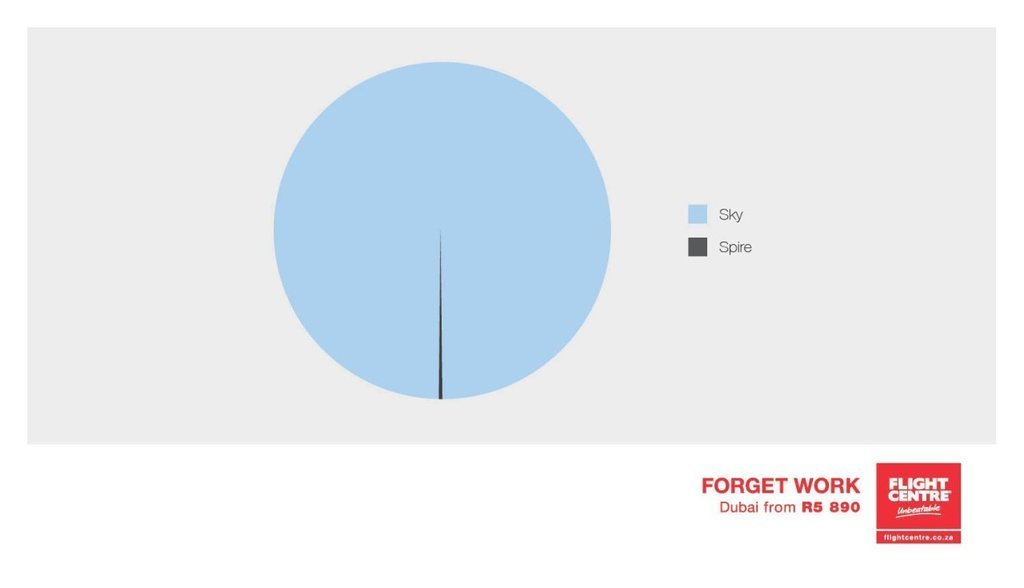
WTFViz
Visualisatie evaluatie
Dataviz Checklist
II
Xenographics
Voorbij lijnen en staven
II
Interactieve viz
Gallery
Why the NYT makes fewer interactives
Tools
Interactieve dataverhalen
III
Maarten Lambrechts?

Dataviz 101
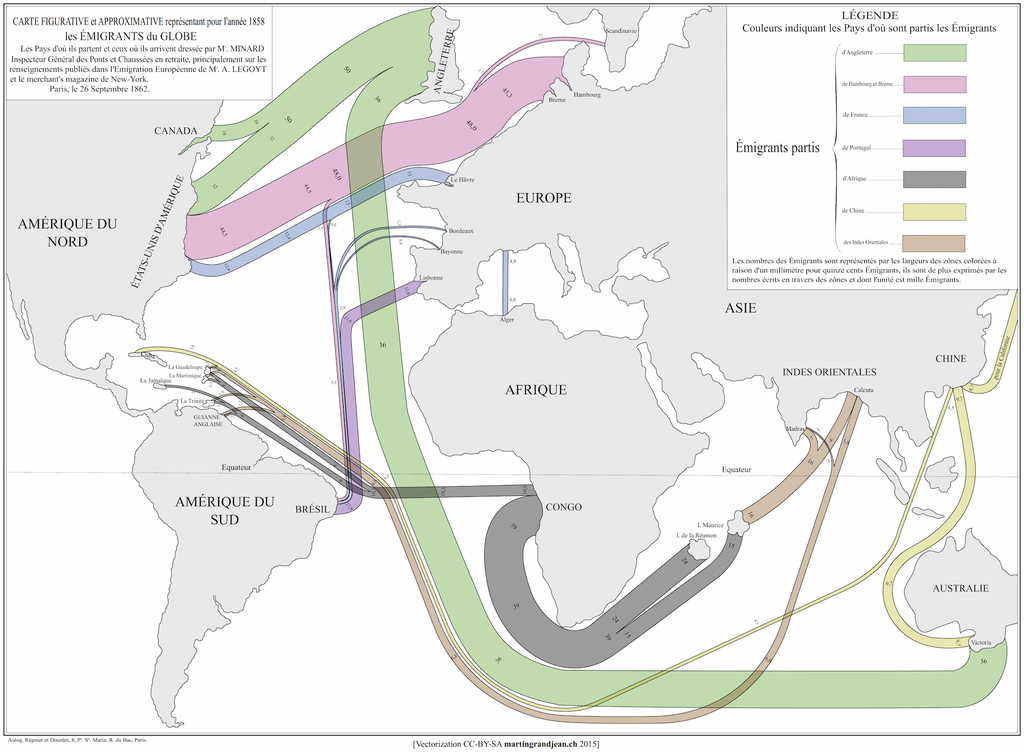
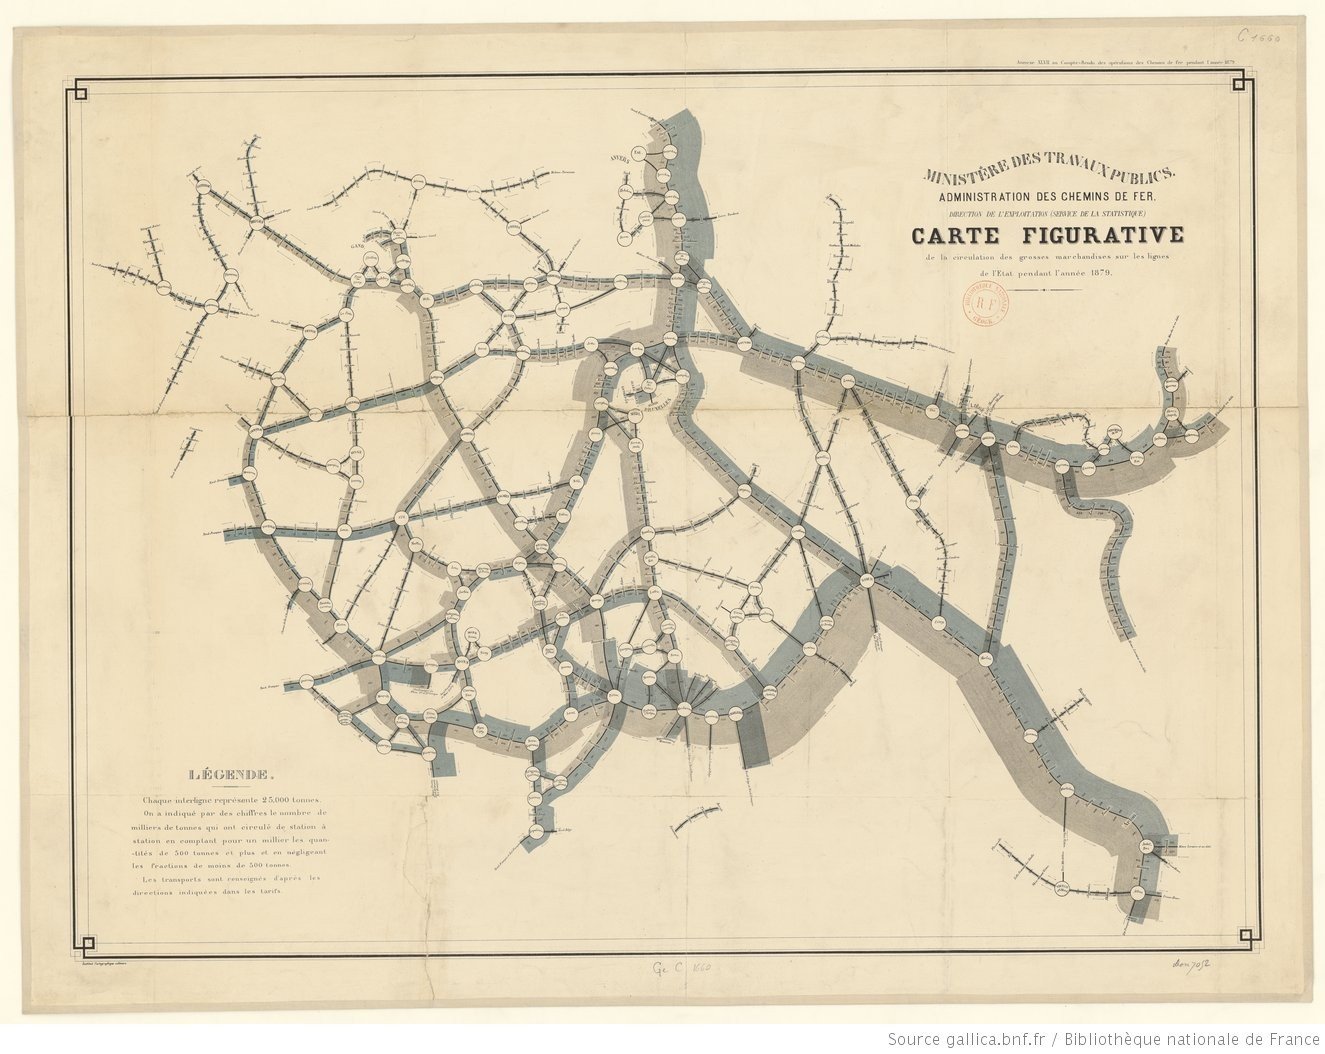
Een streepje geschiedenis
"As knowledge increases amongst mankind, and transactions multiply, it becomes more and more desirable to abbreviate and facilitate the modes of conveying information from one person to another, and from one individual to the many."
William Playfair, 1786
"Everything that can be expressed in numbers can be represented by lines."
John Playfair


Waarom visualisatie?


Cijfers communiceren
Cijfers analyseren
Cijfers in context plaatsen
Het geheim
De vroege waarneming
868888609462834719714449648
122286651978794222484779908
939340243123007392183390116
351684124962334339709749742
            868888609462834719714449648
122286651978794222484779908
939340243123007392183390116
351684124962334339709749742


De basics

Staven


Lijnen


Pies


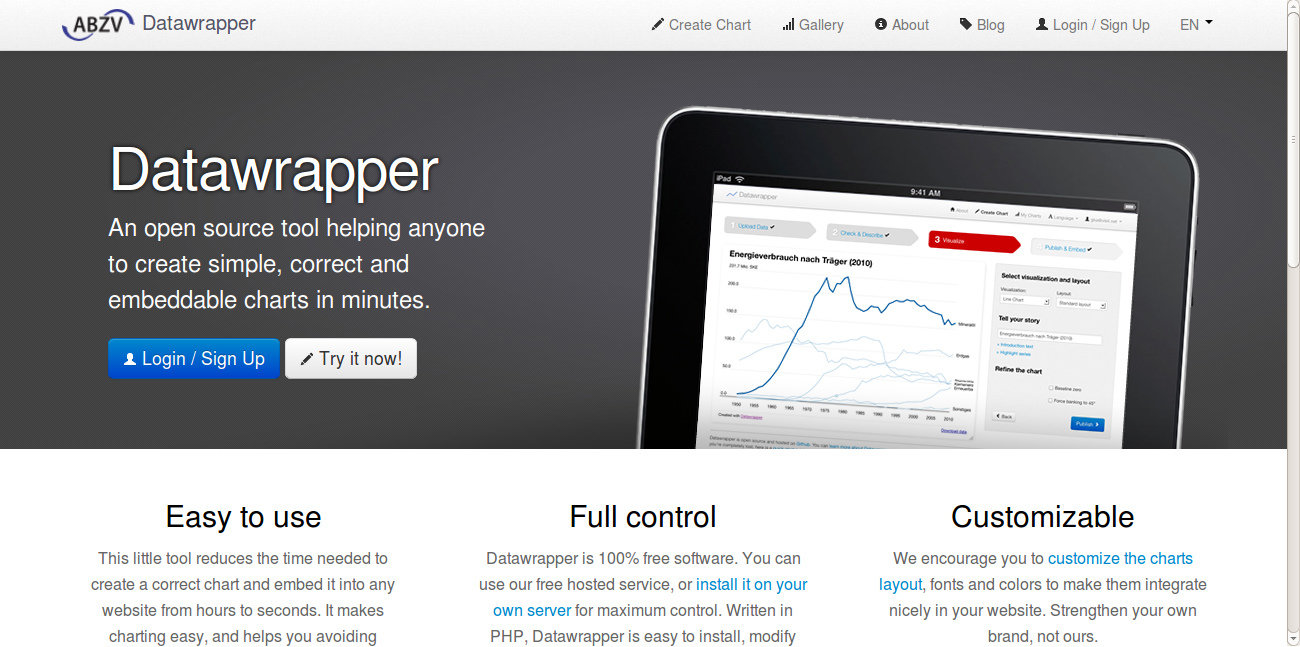
Tools


Next up: Datavis Dissectie
slides.com/maartenzam/rec-1
www.maartenlambrechts.be
@maartenzam
Datavisualisatie 101 | REC
By maartenzam


