Python Pandas
(Basic Tutorial)
Pradeep Macharla
History and Why
- Python Data Analysis Library
- Multi dimensional structured data
- Data Frame (R, numpy: n-arrays, matrices)
- Pandas+numpy+matplotlib+ipython = SciPy Kit
- Pandas (lesser overhead to start) vs. SQL (db realm, sql planner)
- Large Data (< 100gb) vs. Big Data (> 100gb)


Agenda
- Introduction, History and Environment - 10 min
- Basic Exploration - 15 min
- Select, Slice, Filter and Sort - 15 min
- Clean Data - 10 min
- Transform Data (if time permits) - 15 min
- Realtime Use case 1 - 10 min
- Realtime Use case 2 - 10 min
- Q & A
- Next Steps
Environment Set up
-
Write and execute local environment
-
Share and collaborate
-
Manage large user environments *
-
Ipython (REPL - read eval print loop) to execute python programs, other way is .py scripts
-
Jupyter - web interface for REPL (supports ipython, julia , R and others)


- Local Anaconda environment
- pip install jupyter && jupyter notebook
- IDE (PyCharm, VS Code etc.)
- Jupyterhub - cloud, datacenter
Basic Exploration
- Basic Exploration - df.shape, df.info(), df.mean(), df.head(), df.tail(), df.sample()
- Statistical - df.describe(), df['col_name'].mean(), df['x'].cor(df['y'])
- df['col_name'].value_counts() (* share/collab)
Indexing: List, Slice, loc, iloc, Sort
- df['col_name'], df['col_name']['row_name'] - Index by column
- df[['Weight','Height']] - Retrieve multiple columns
- df[2:20] - Slice returns rows not columns
- df.loc['row_name']['column_name']
- df.iloc[index][index] - Retrieve by position
- df.sort_index, df.sort_index(axis=1), df.sort_index(inplace=True)
- df.sort_values(by='col1'), df.sort_values(by=['col1','col2']
Cleaning Data
- Identify [at least, all] null/NaN across Data frame, column or row
- Drop columns or rows - no mercy !
- Drop based on threshold
- Fill null cells with specific value, derived value based on nearest cell values (forward fill, backward fill)
- Fill null cells by interpolating data (linear, polynomial etc.)
- Fill null cells with mean or mode
- Drop duplicated rows, identify unique rows
- Convert datatype of a column with astype
- Set index for data frame and rename columns
- Reset index to a simple integer sequence
Transforming Data
- Apply mathematical operators on columns, rows and cells
- Apply custom function to every cell in Data Frame
- Stack, UnStack, Pivot and Melt functions
Share and Collaborate
- Export to html, pdf and other formats
- Start and Stop Server
- Intellisense
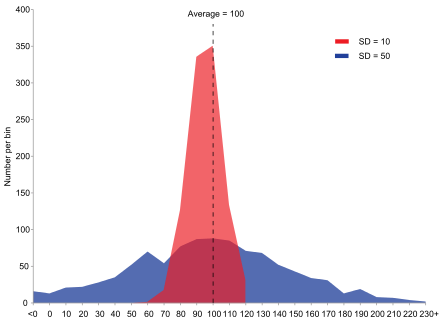
Plots & Visualization
- plots are from matplotlib library mostly
- df.plot() draws and exits immediately (what if you need to make customizations and overlay stuff ?)
- matplotlib object oriented api are for customization and overlay multiple plots
- fig, ax = plt.subplots(3,4) # use subplots() for 1 plot, ax[0,0].plot(x,y) , ax[0,0].set_title('blah')
- df.plot(ax=ax[0,0]) # To send data input to the ax layout
- %matplotlib {inline, notebook, widget...}. Inline closes graph as soon as it draws, notebook supports some interactivity, widget for jupyterlab
- df.plot(subplots=True, layout = (3,4), sharex=True, sharey=True). By default x axis is shared
- matplotlib gridspec, for more control on layout
- plt.style.available # For various matplotlib themes/styles
- plt.style.use('classic') , with plt.style.context('classic'):
- df.plot(figsize=(3,3) , call fig.tight_layout(), so that labels fall within the figure bounds
- plt.rcParams['figure.figsize'] = (5,5) for global figure settings
RealTime Project - 1
(Scrape which dataset)
RealTime Project - 2
(Real Estate Prices in Connecticut)
Reference(s)
Pandas-BasicTutorial
By Pradeep

