


MAPC PRO
Metropolitan Area Planning Council is a regional planning agency promoting smart growth and regional collaboration for the Metro Boston area.
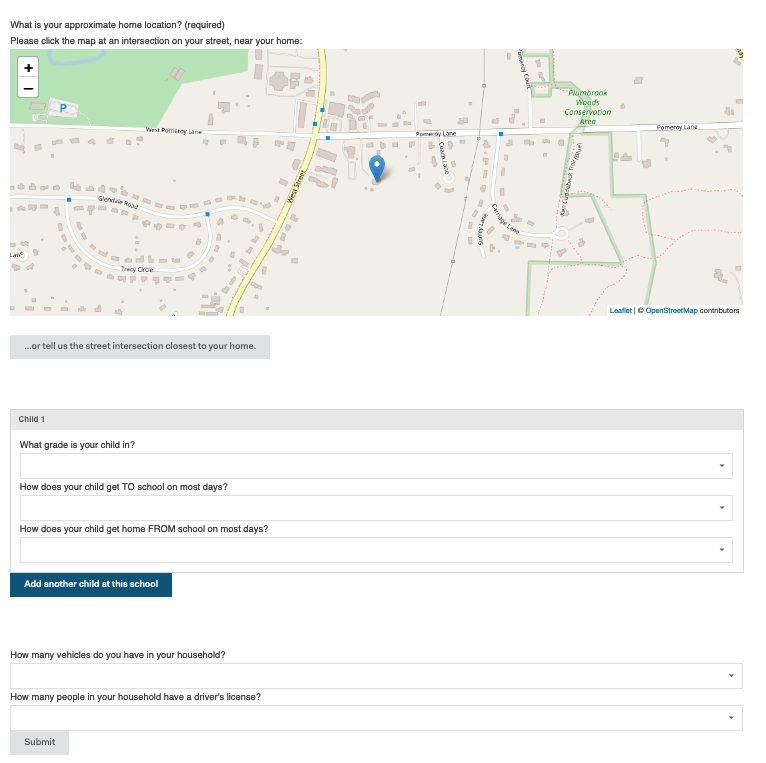
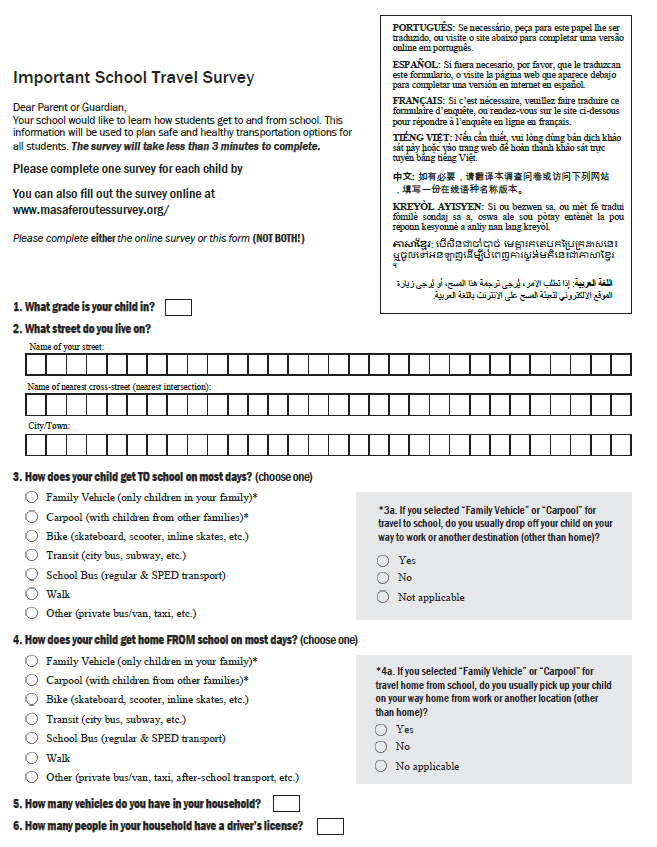
6-question school commute survey
Offered in 9 lanaguges
Online and paper survey available
Over 47,000 surveys completed by parents as of 2020
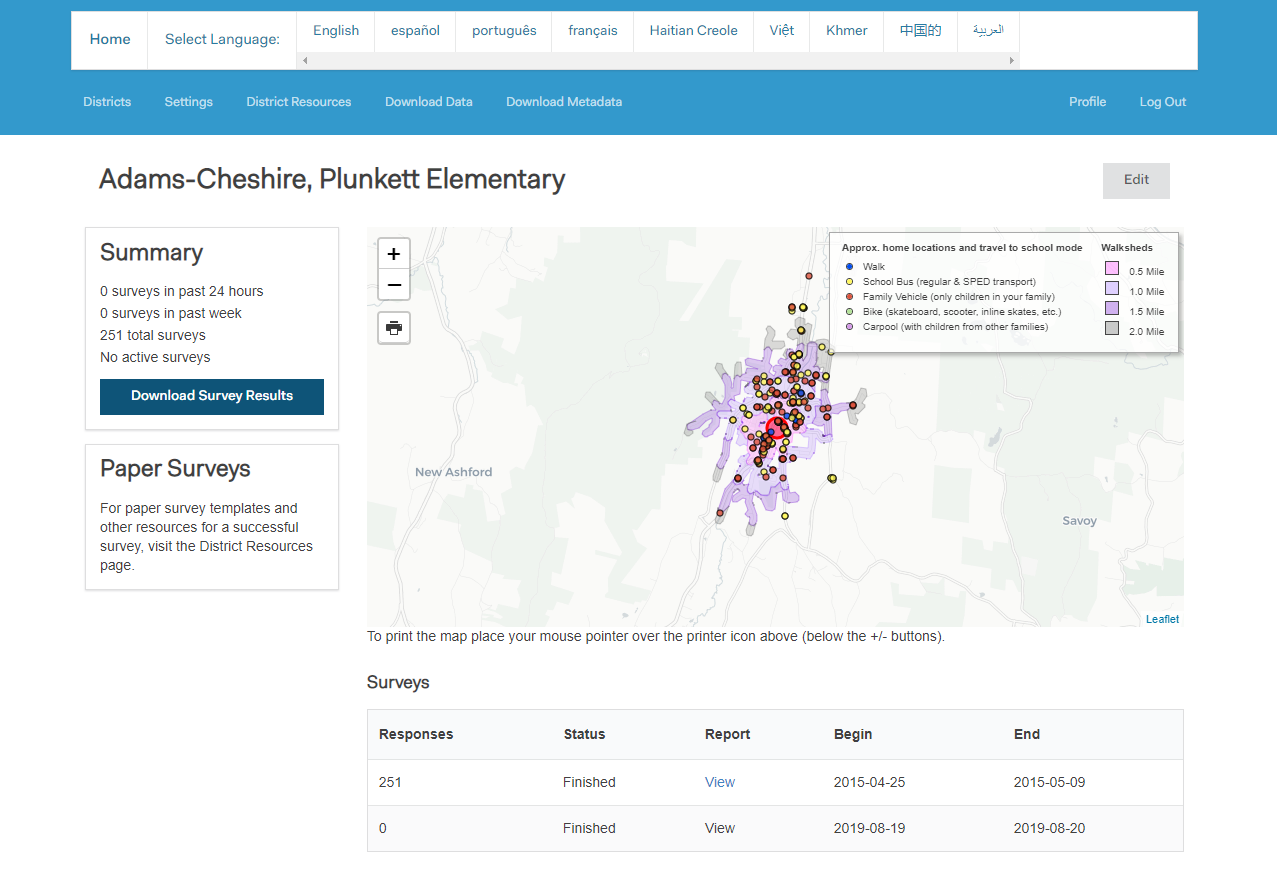
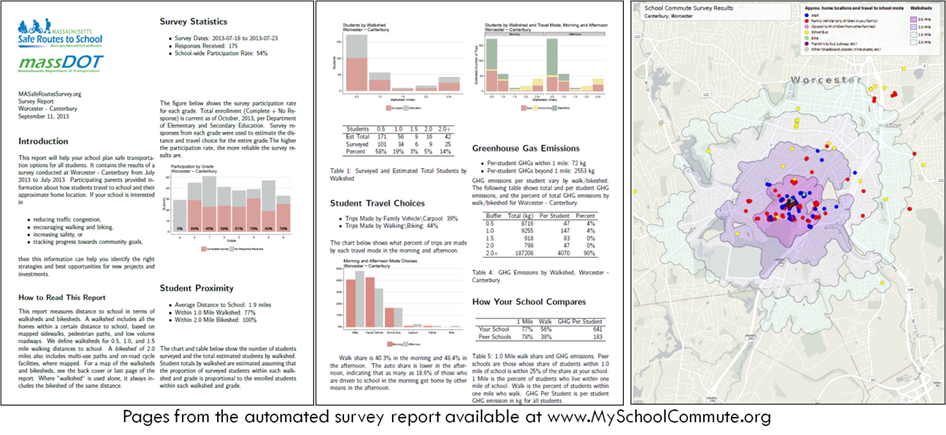
Automated reporting available
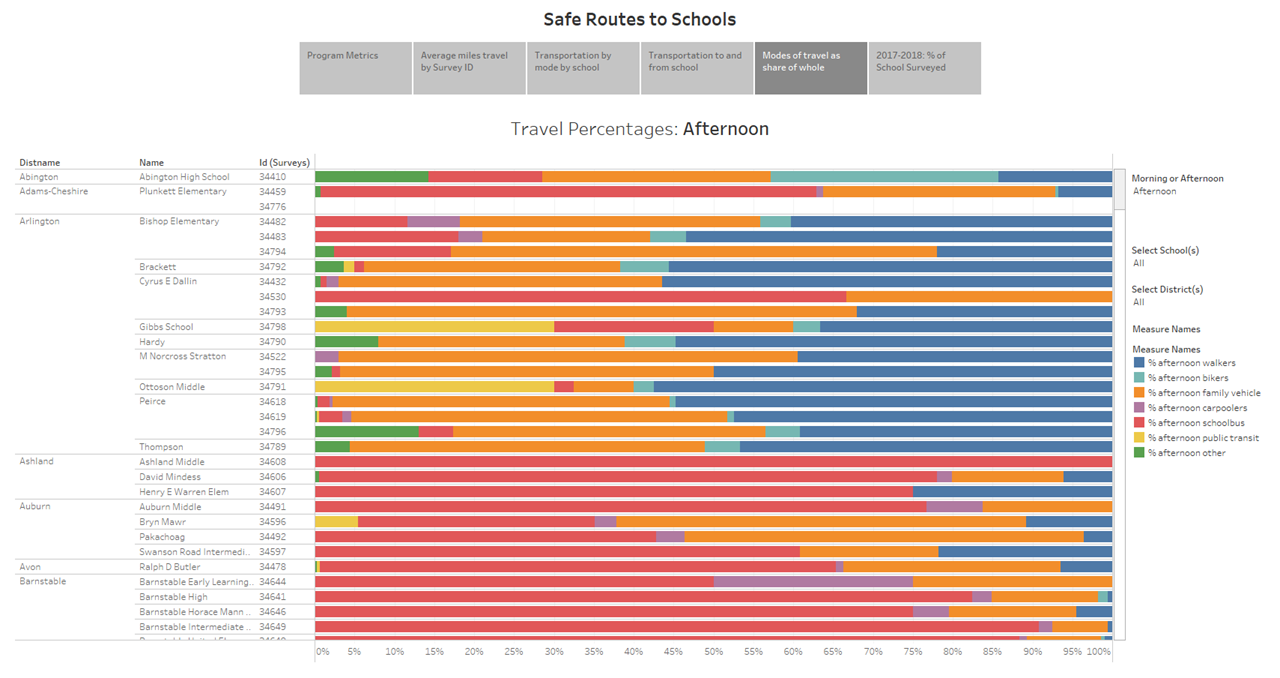
Evaluating trends in how students and families travel to and from school is a key component to building a successful Safe Routes to School program.
Parent responses to this survey provide valuable information and help determine how we can improve the environment around the school, target investments, track progress toward goals.
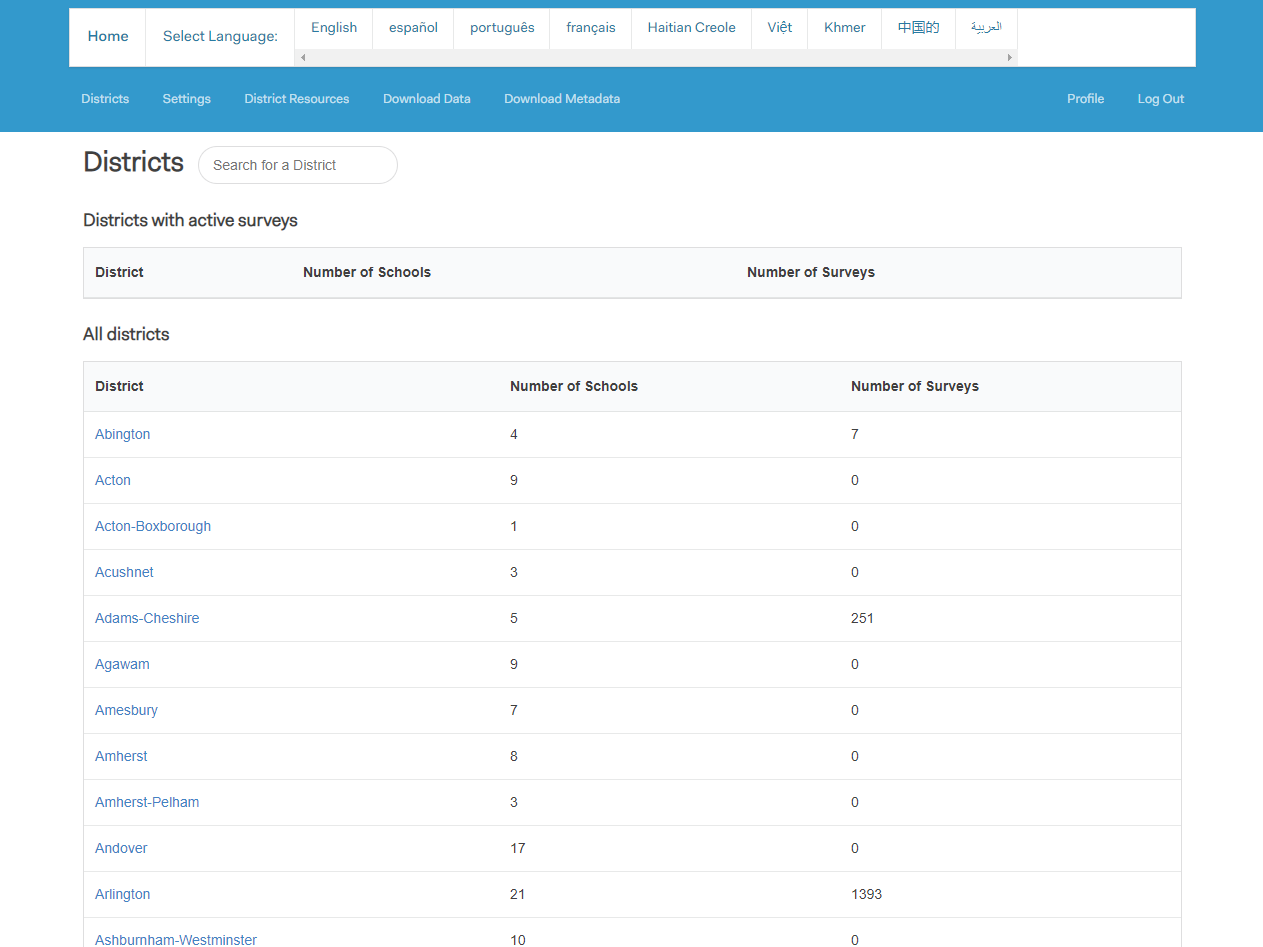
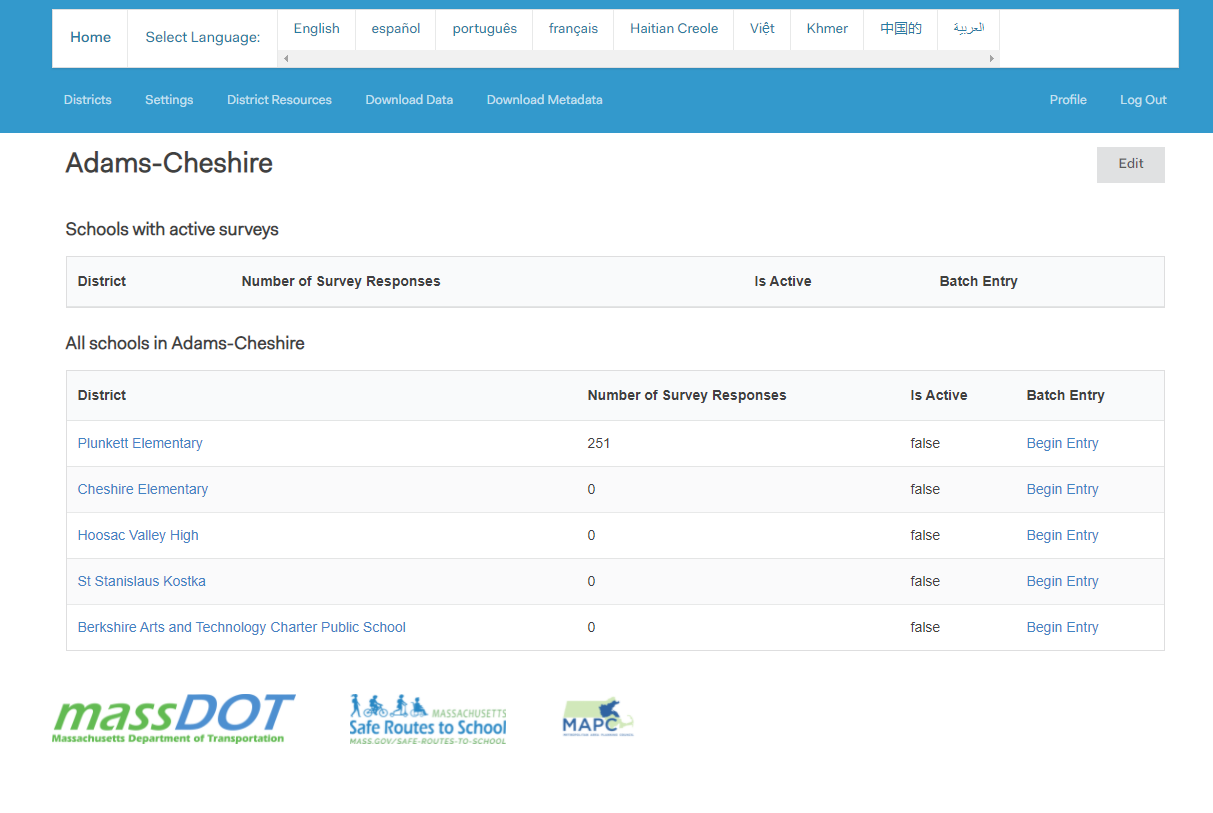
Survey Management & Report Generation
Automated Reports
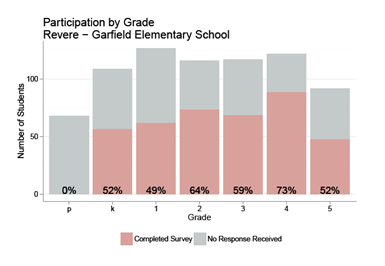
Response Rate
Report Elements
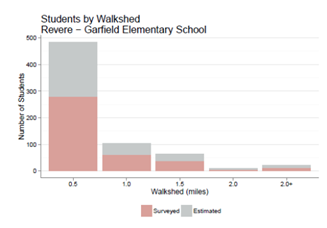
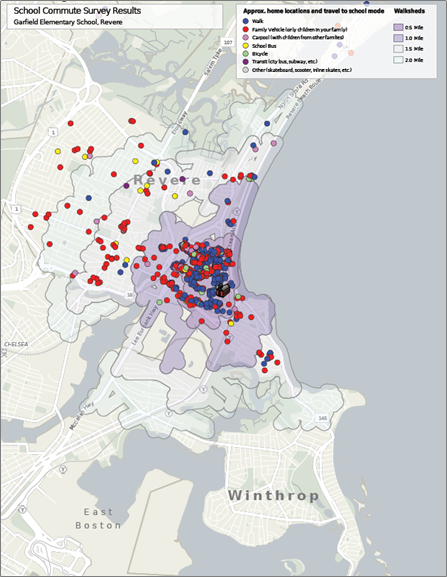
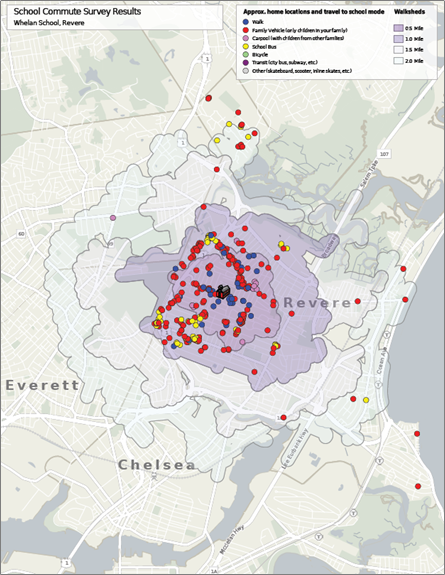
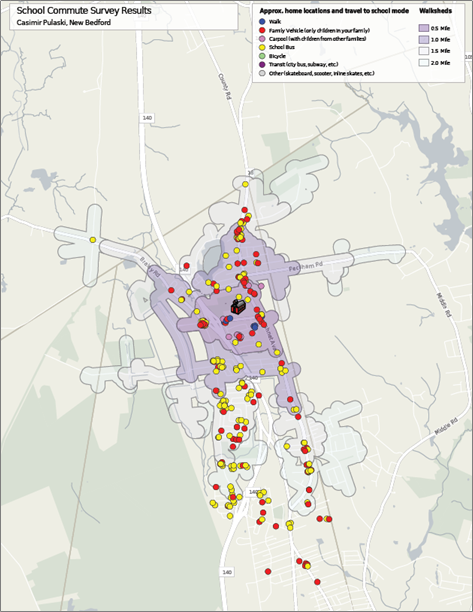
Student Proximity
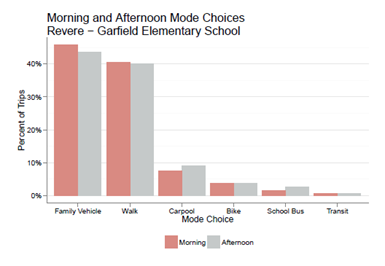
Overall Mode Choice
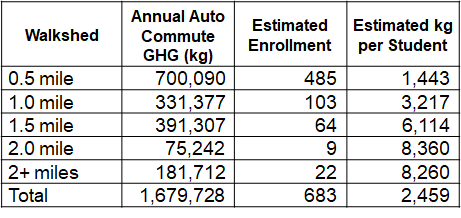
GHG Emissions
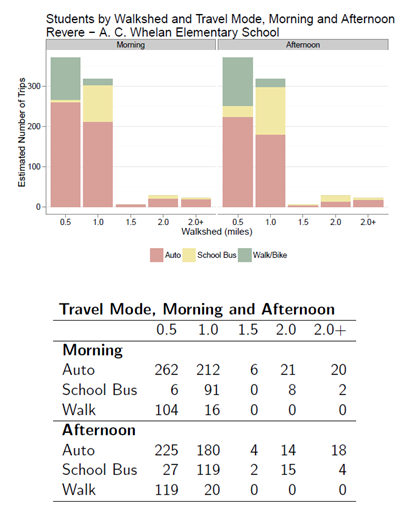
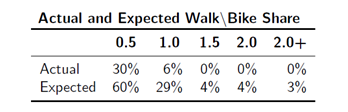
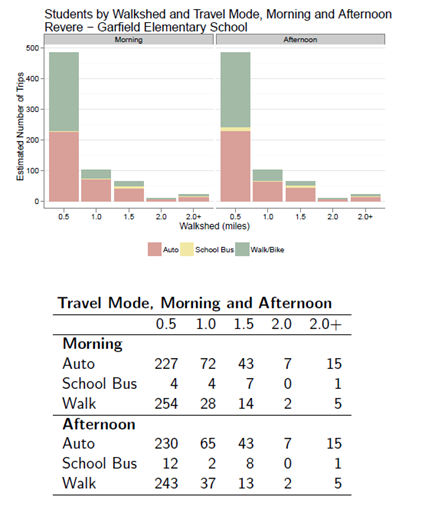
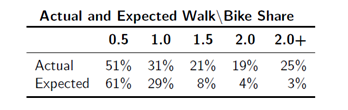
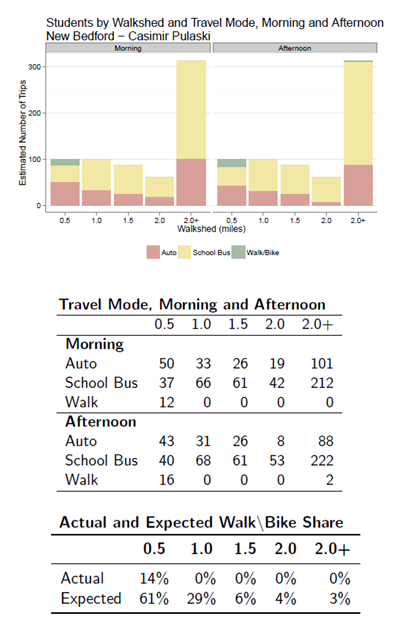
Mode Choice by Walkshed
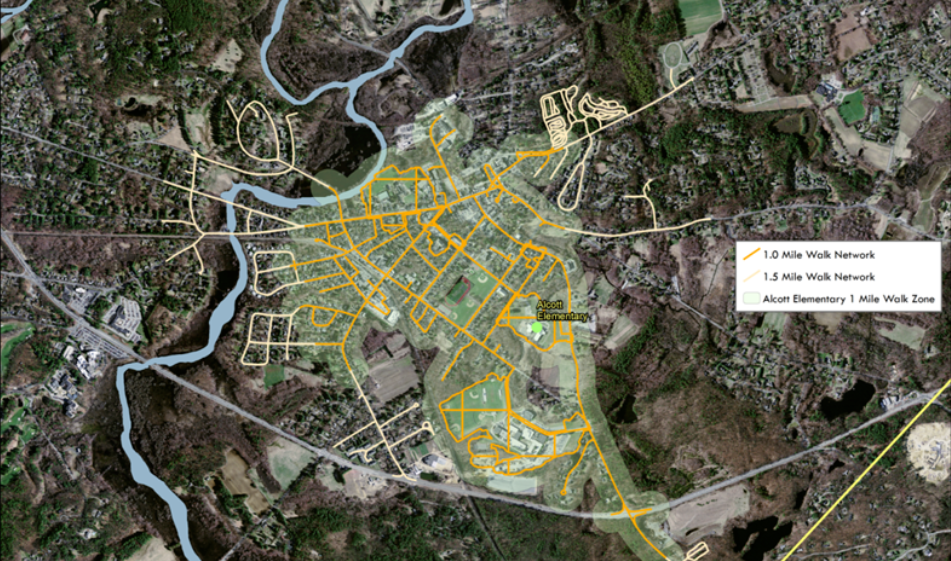
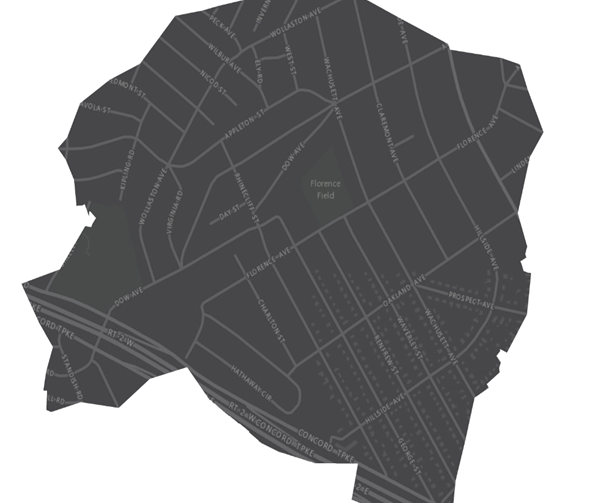
Walk Network Example: Alcott Elementary, Concord
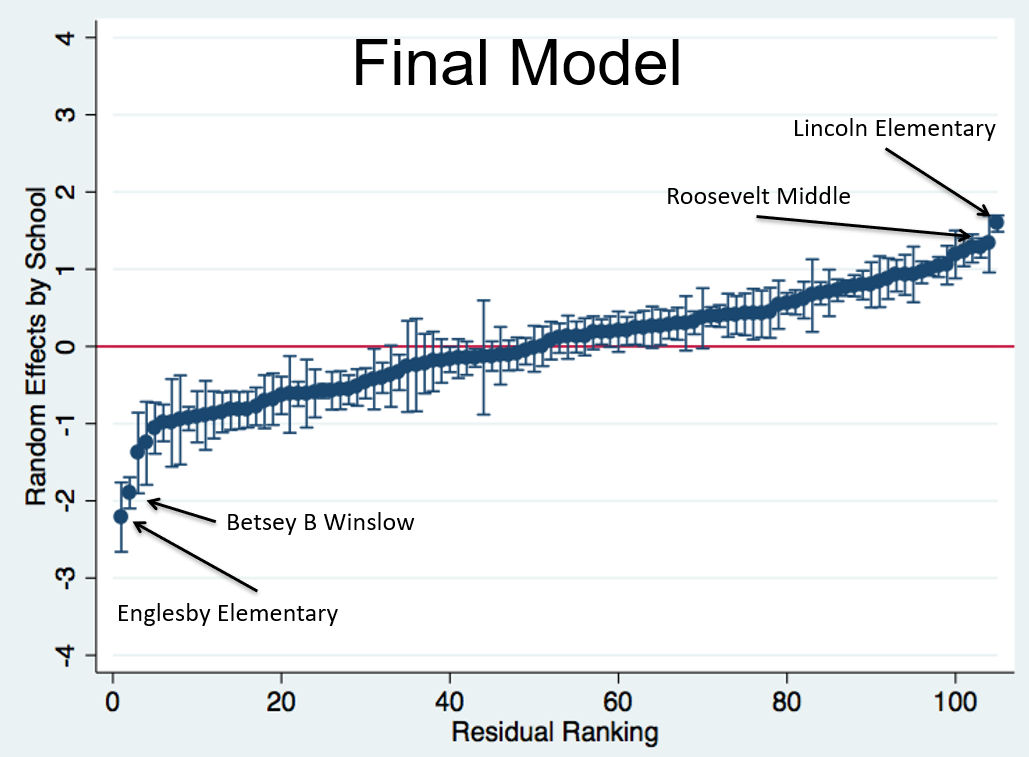
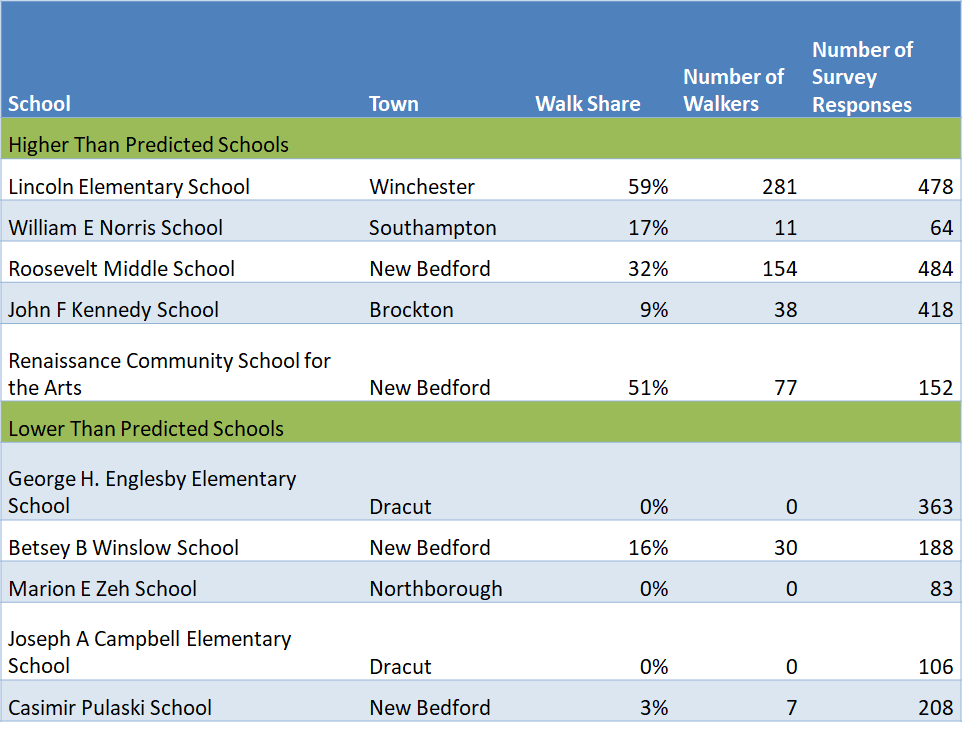
School Comparison -- Mapped
Low Walk-to-School Potential
Data Connection Available for Additional Reporting
Open Source and Transferable
Programming “Stack”
Input files
Research Project: Neighborhood Characteristics
Explore More Below
Route
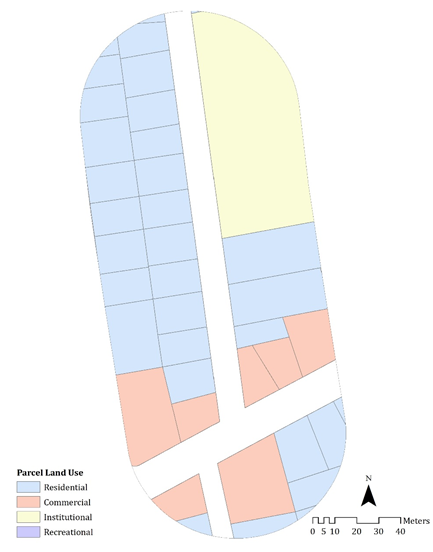
• Land Use Mix
• Industrial Land Use
• Intersections
• Major Roads
• Route Directness
• Population Density
• Median Household Income
School
• Intersection Density
• School Enrollment
• Race/Ethnicity
• English Language Learners
• Low Income Students
• Population Density
• Median Household Income
Research Project: Neighborhood Characteristics
What Did We Look At?
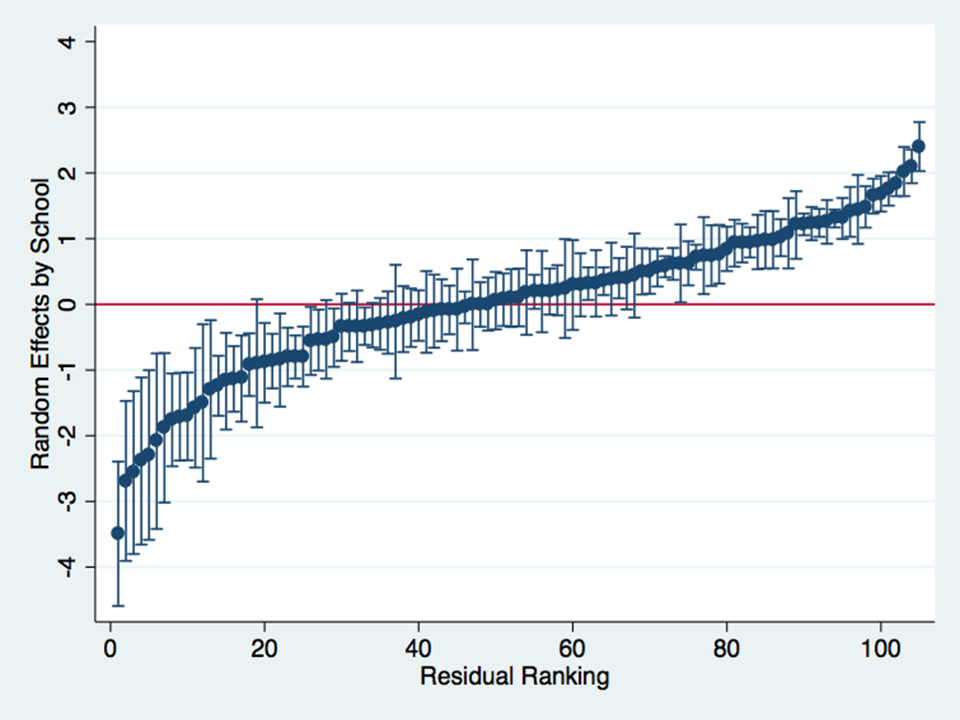
Research Project: Neighborhood Characteristics
Research Project: Neighborhood Characteristics
| Fully Adjusted Model Results | Walk To School |
|---|---|
| Grades 2-4 | |
| Grades 5-8 | |
| More Drivers Than Cars | |
| At Least One Car per Driver | |
| Distance (miles) | |
| Route Land Use Mix | |
| Major Road on Route | |
| Indirect Pedestrian Route | |
| School Enrollment | |
| School Neighborhood Intersection Density | |
| School Neighborhood Median Household Income |
Research Project: Neighborhood Characteristics
Research Project: Neighborhood Characteristics
Research Project: Neighborhood Characteristics
Future Opportunity: Points to Lines
Enabling targeting investments to routes that have a high potential for mode shifting of student commutes.
Explore More Below
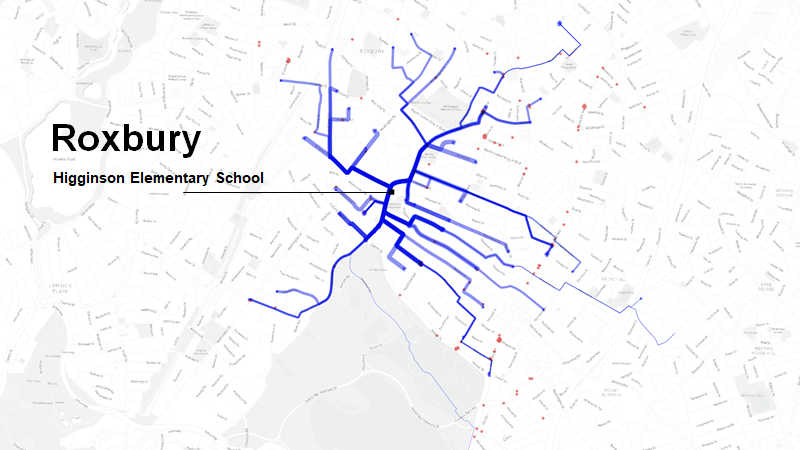
Points to Lines: Example
Using open data and software, MAPC developed a examples of what this analysis would look like.
Blue = Predicted route to school for students that walk
Size = Number of Students
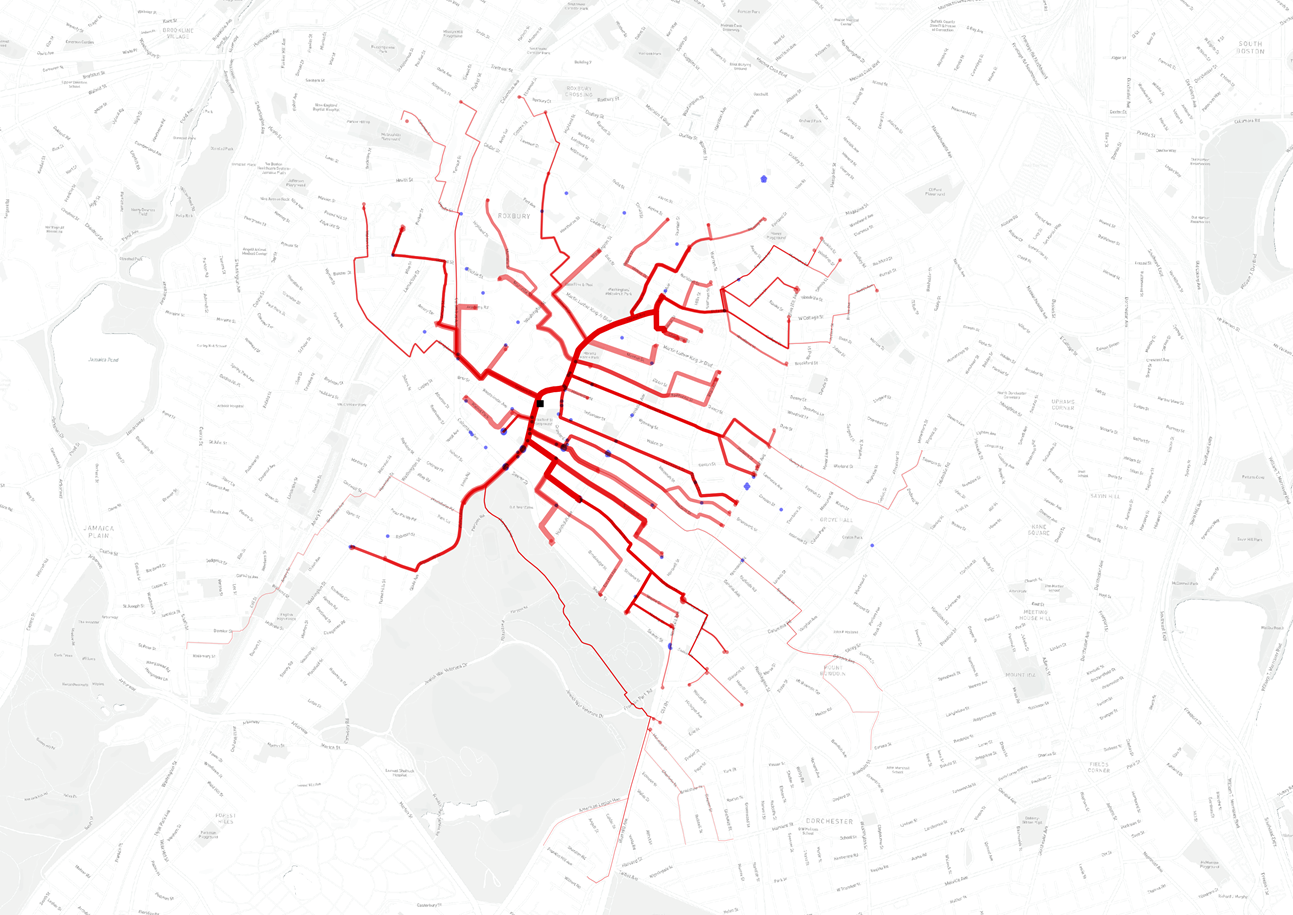
Points to Lines: Example
Red = Predicted route to school for students that don't walk
Points to Lines: Example
Size = Number of Students
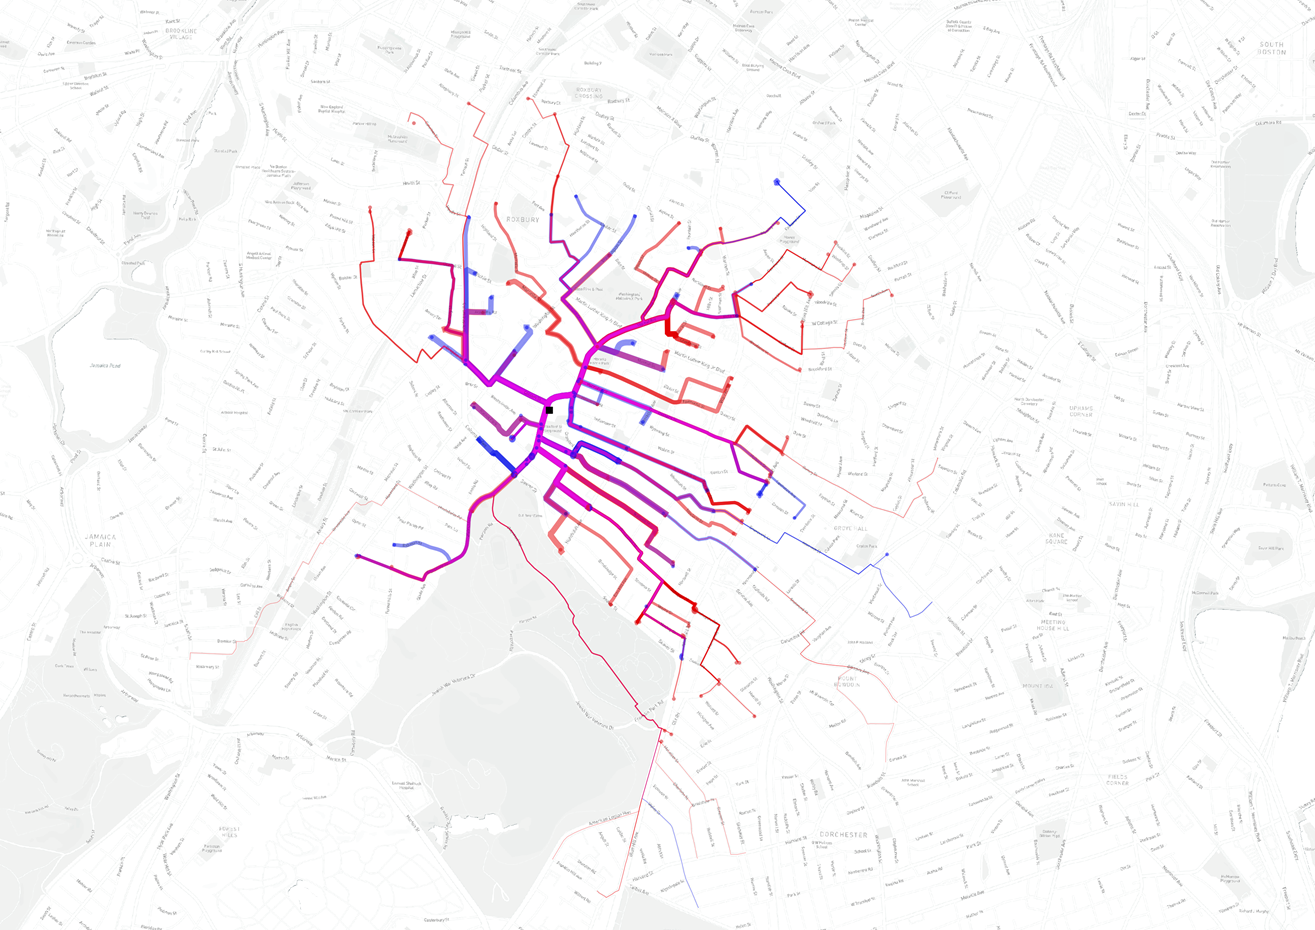
Purple = Overlay Of Routes
Color weighted to highlight areas with walkers and potential walkers
Points to Lines: Example
Finding the Walk-to-School “Target Market”
Mode Shift
By MAPC


