Debugging JavaScript with Chrome DevTools
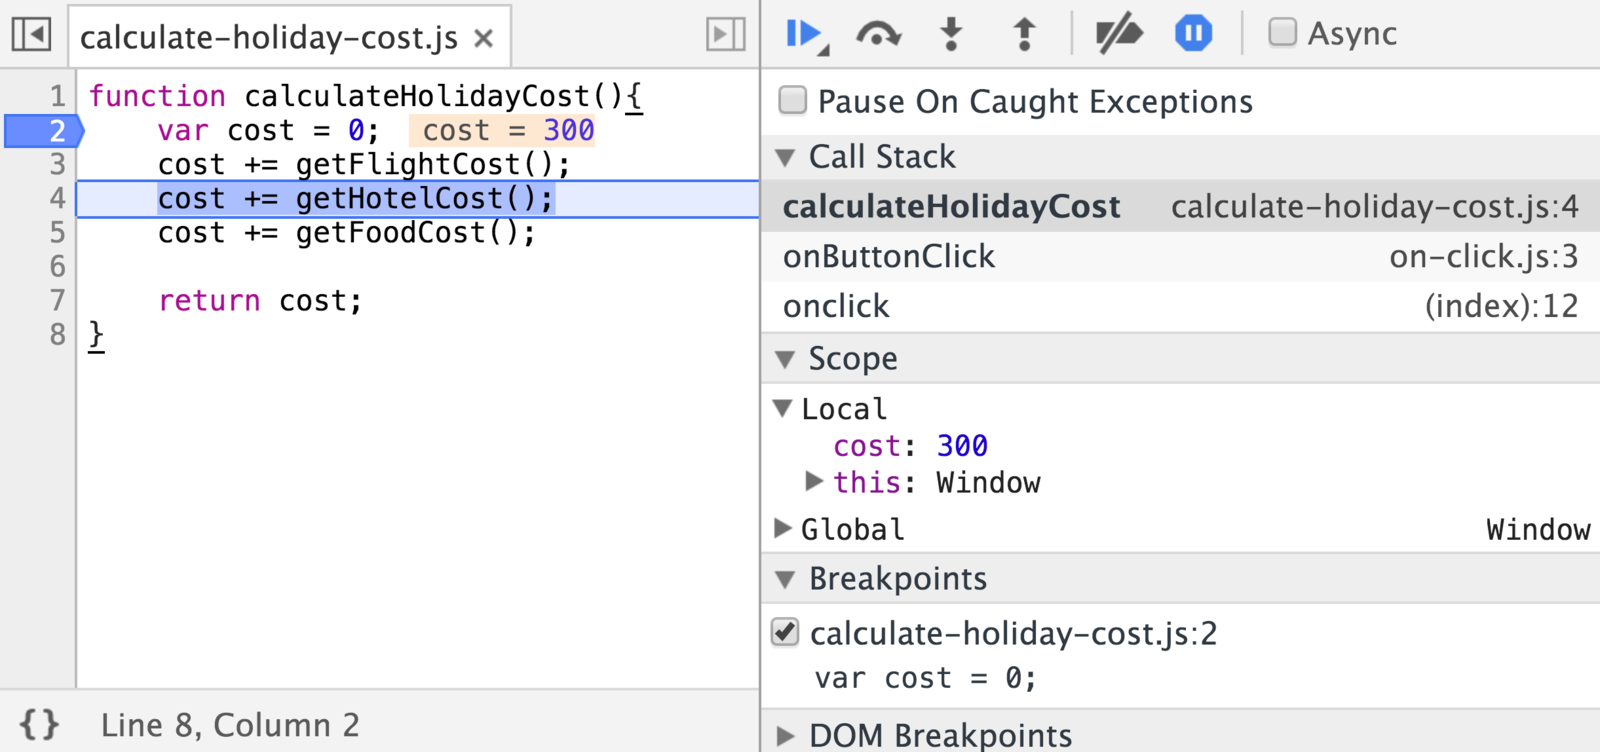
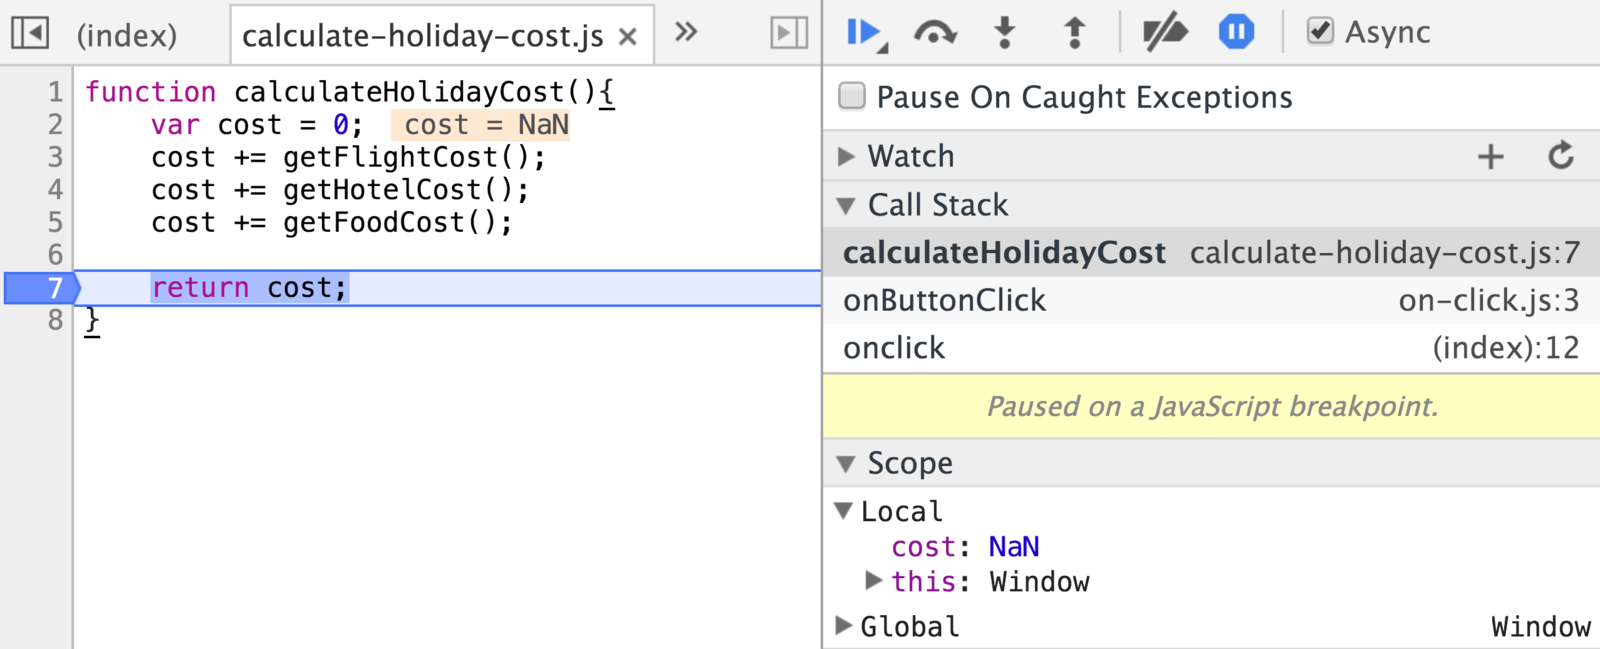
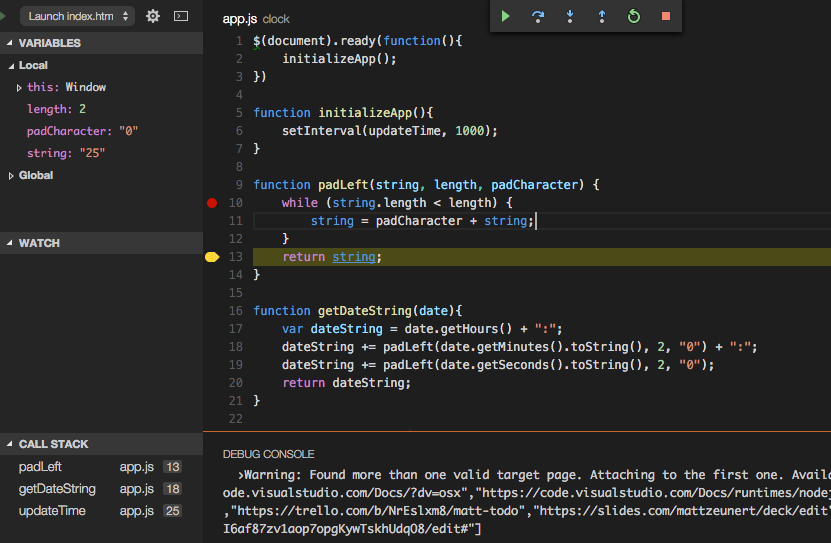
Paused Execution
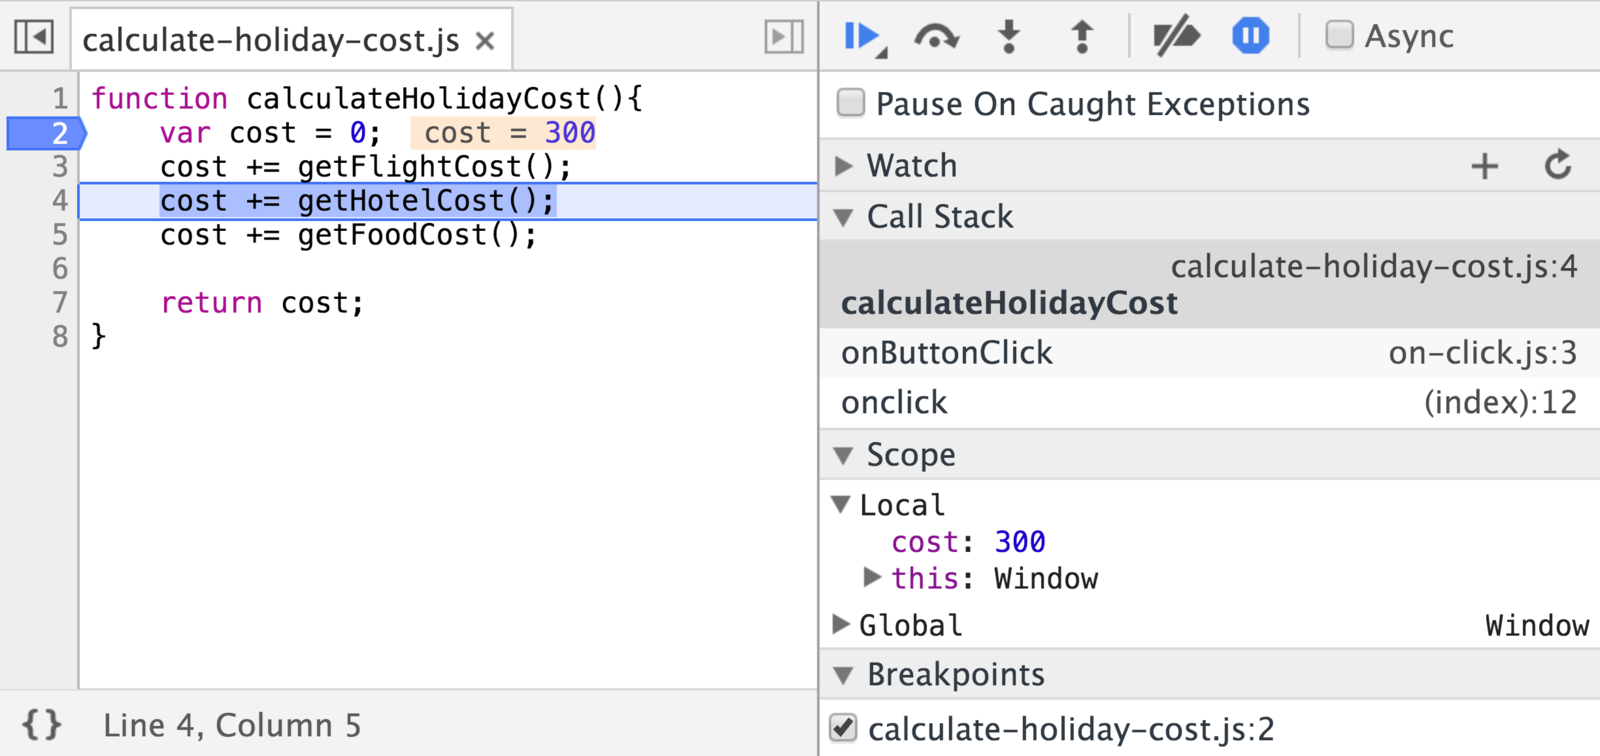
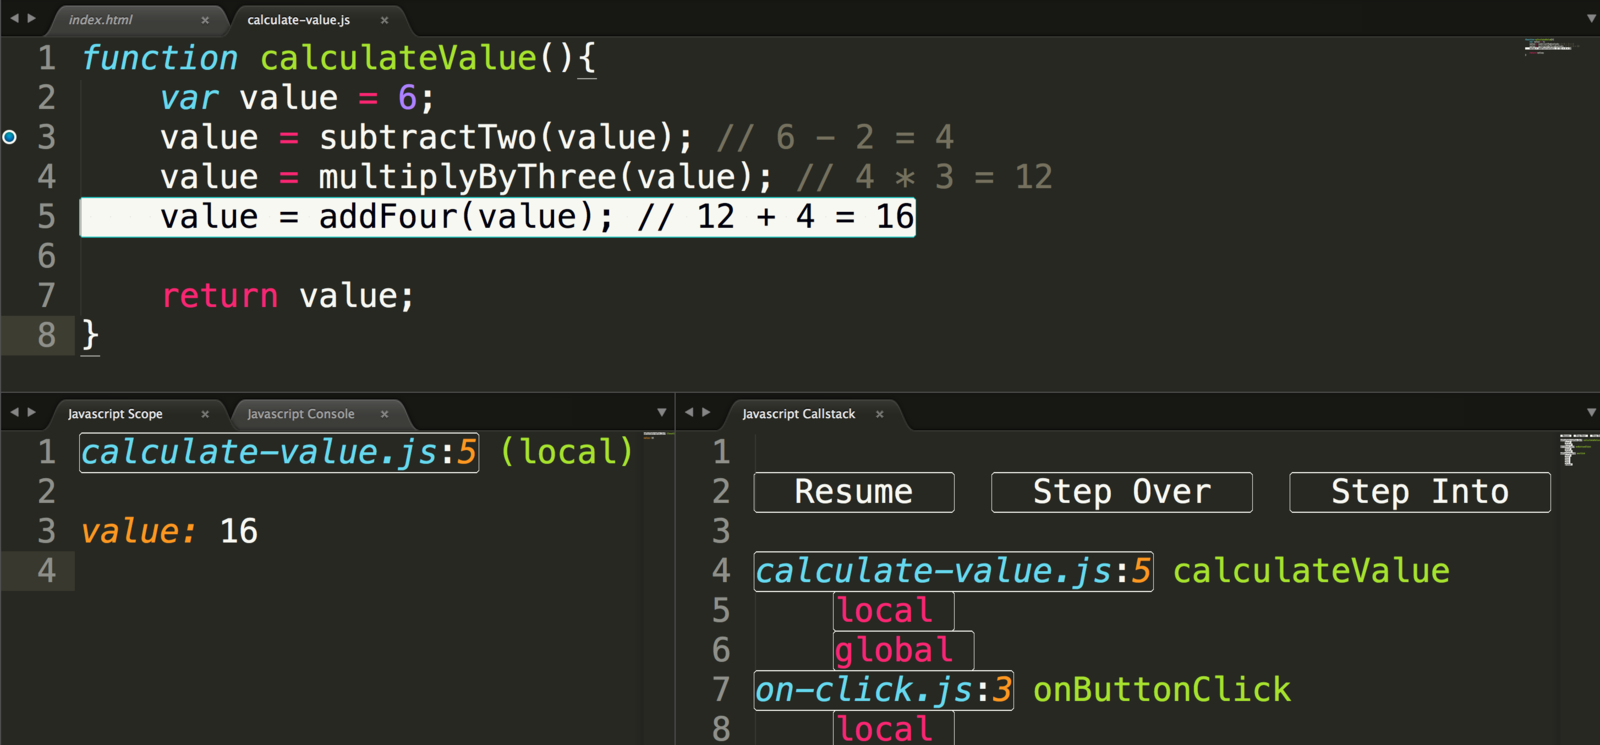
Call Stack
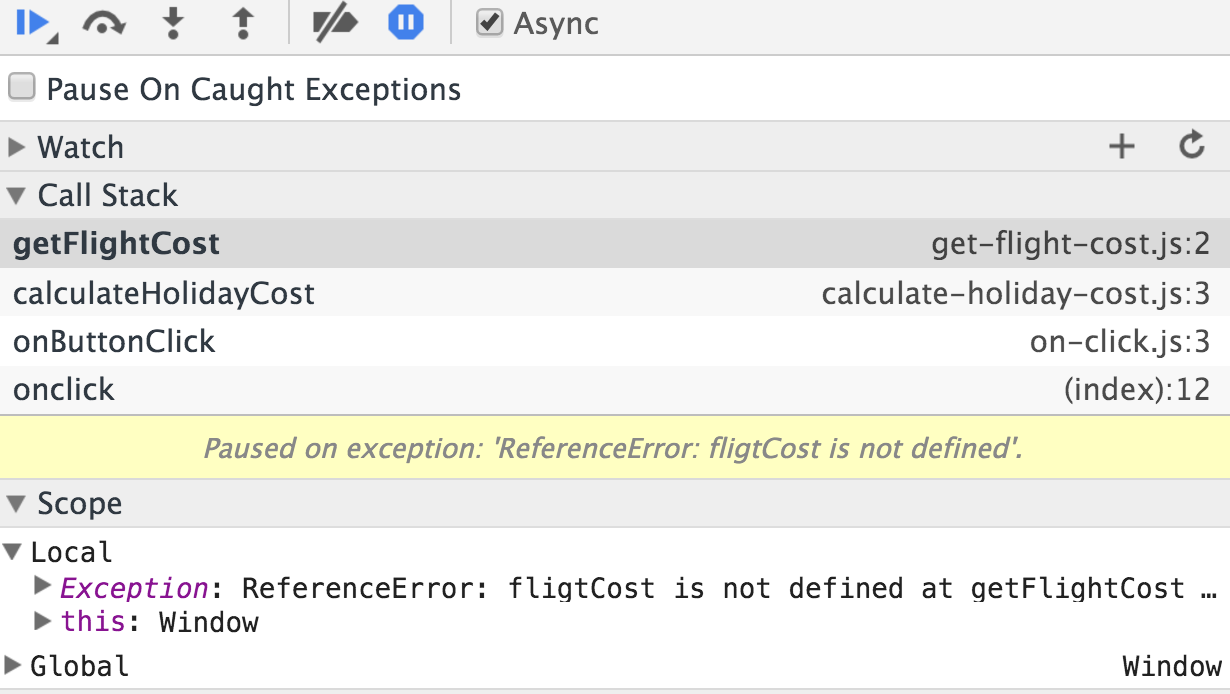
Reason For Pausing
Switch Call Frames
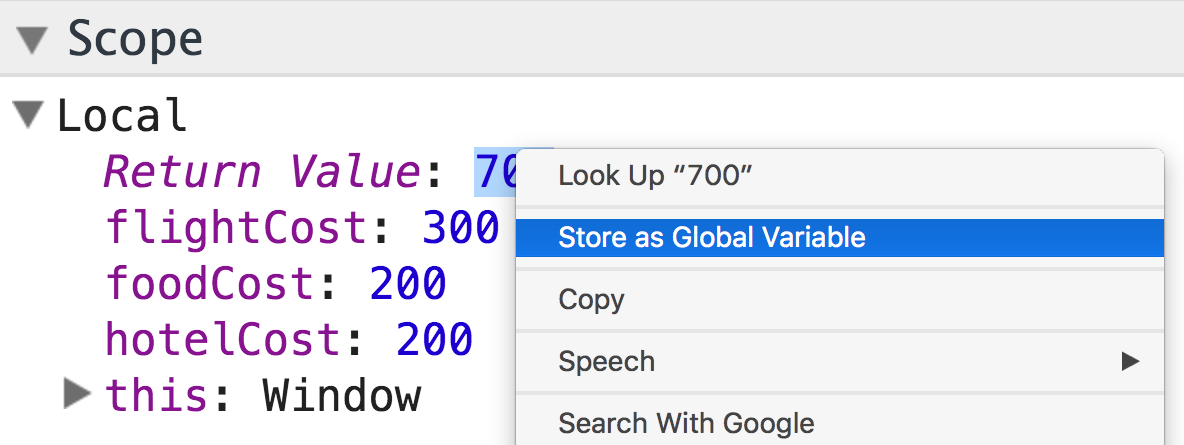
Scope Panel
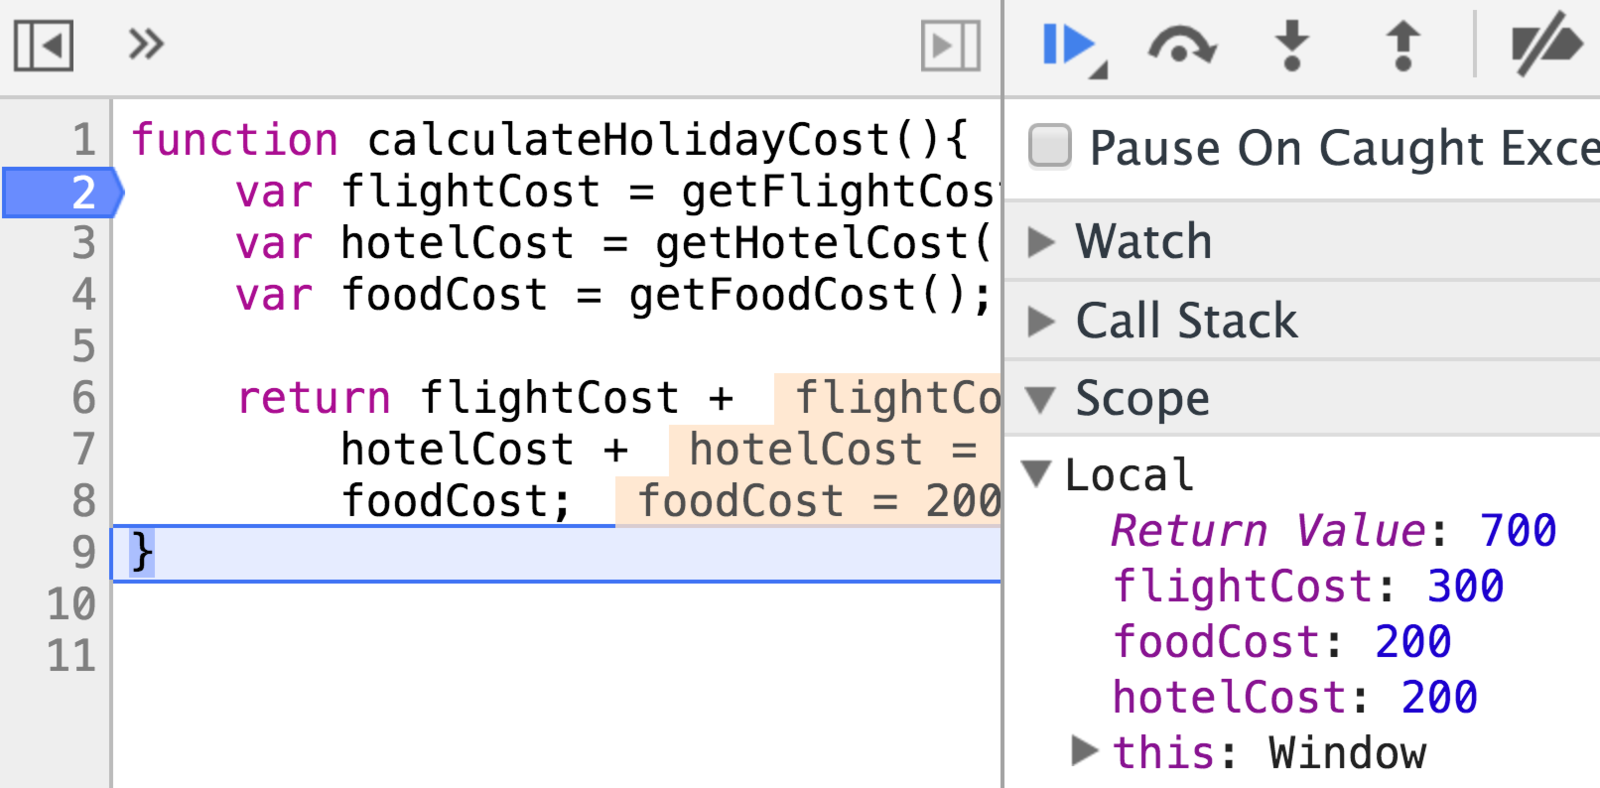
Scope Panel
Stepping Controls

- Resume
- Step Over
- Step Into
- Step Out
Long Resume
Long Resume
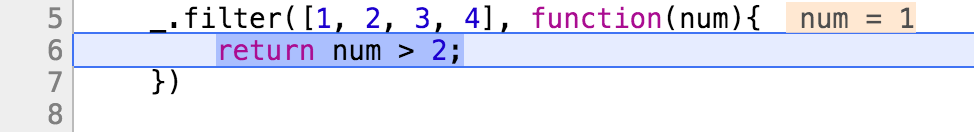
Blackboxing Library Code
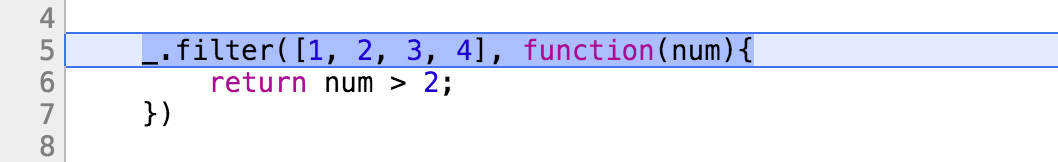

Blackboxing Library Code
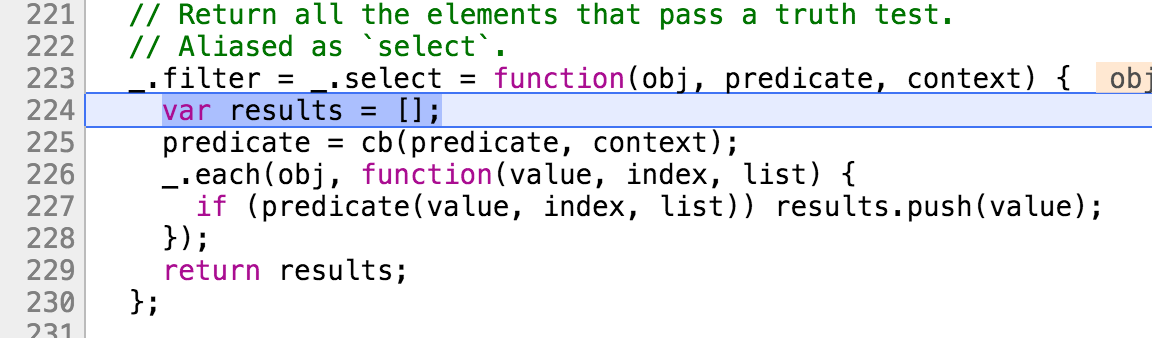
Blackboxing Library Code
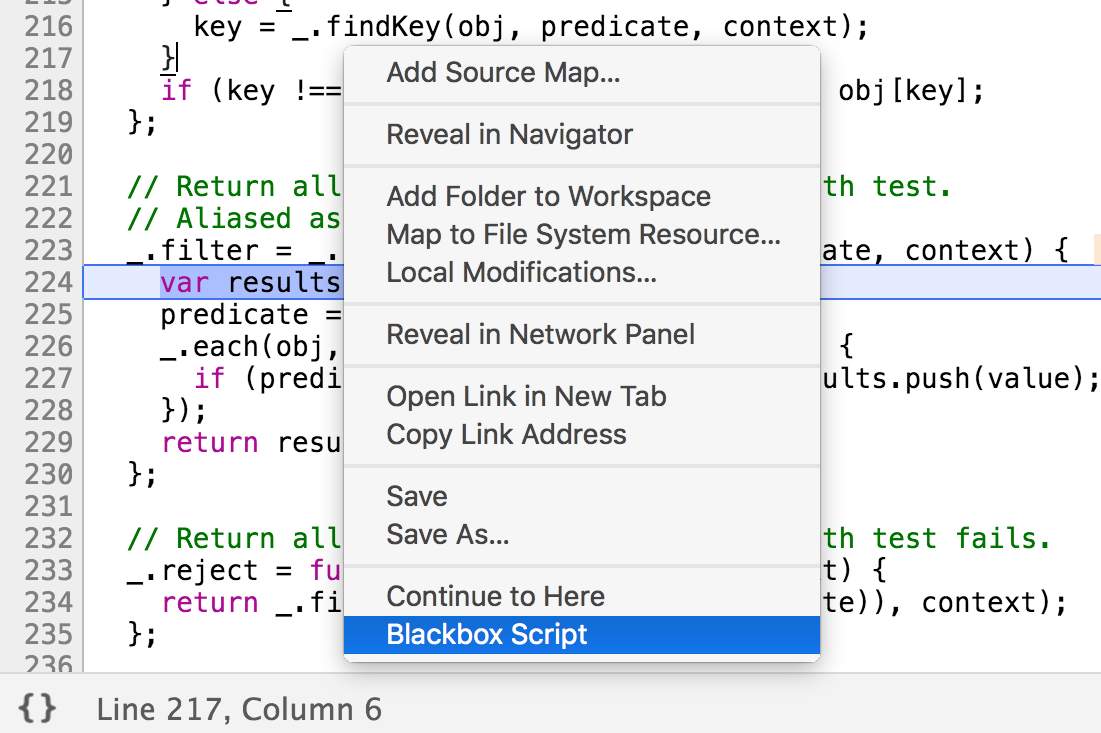
Blackboxing Library Code
Restart Frame
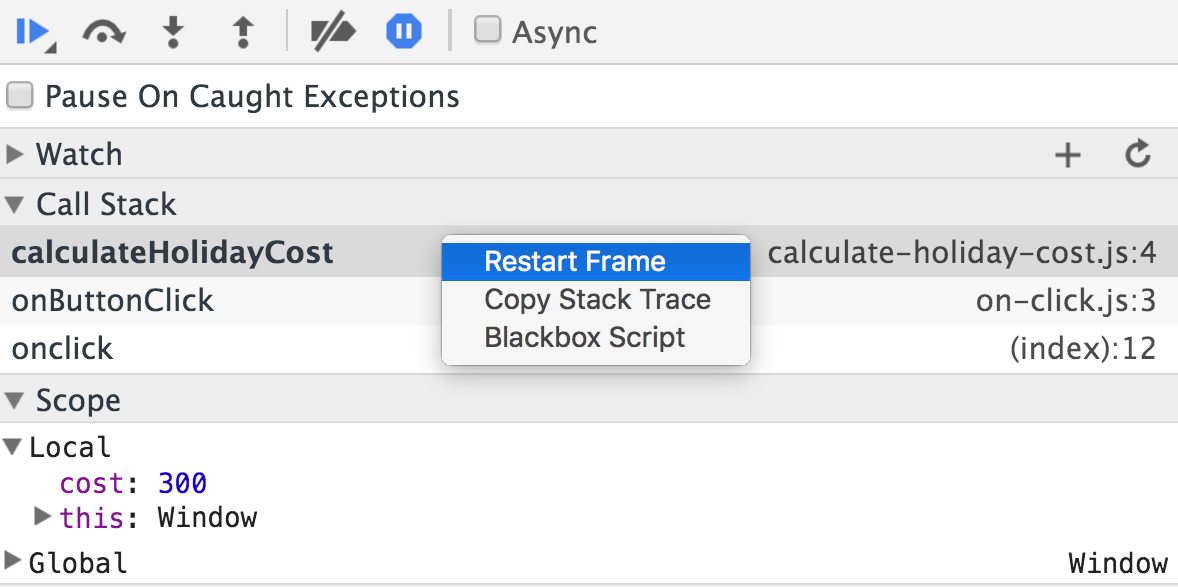
Restart Frame
Restart Frame
Restart Frame
Restart Frame (Limitations)
Behaviour-based Breakpoints
DevTools can pause on
- Exceptions
- DOM changes
- DOM events
- Ajax requests
Debugging Snippets
Break on
- LocalStorage access
- Object property access
- ...
Remote Debugging
<=> WebSockets <=>
Chrome Desktop
DevTools
(Chrome Debugger Protocol)
Remote Debugging
<=> WebSockets <=>
Chrome Desktop
Chrome on Android
Node
DevTools
(Chrome Debugger Protocol)
Node-Inspector
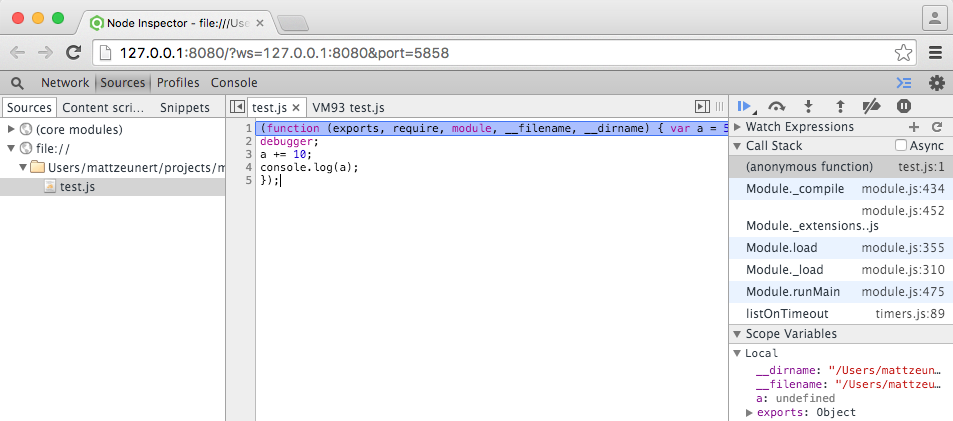
$ node-debug test.js
Remote Debugging
<=> WebSockets <=>
Chrome Desktop
DevTools
Sublime Text
WebStorm
IntelliJ IDEA
Visual Studio Code
(Chrome Debugger Protocol)
Sublime WebInspector
Visual Studio Code
Learn More
https://umaar.com/dev-tips/
Thanks
@mattzeunert
front-endgineers
By Matt Zeunert


