Debugging JavaScript with Chrome DevTools
-
Stepping Through Code
- Closer look at the call stack
- Debugging code you don't know
- Remote Debugging
DevTools Debugging
- Logging
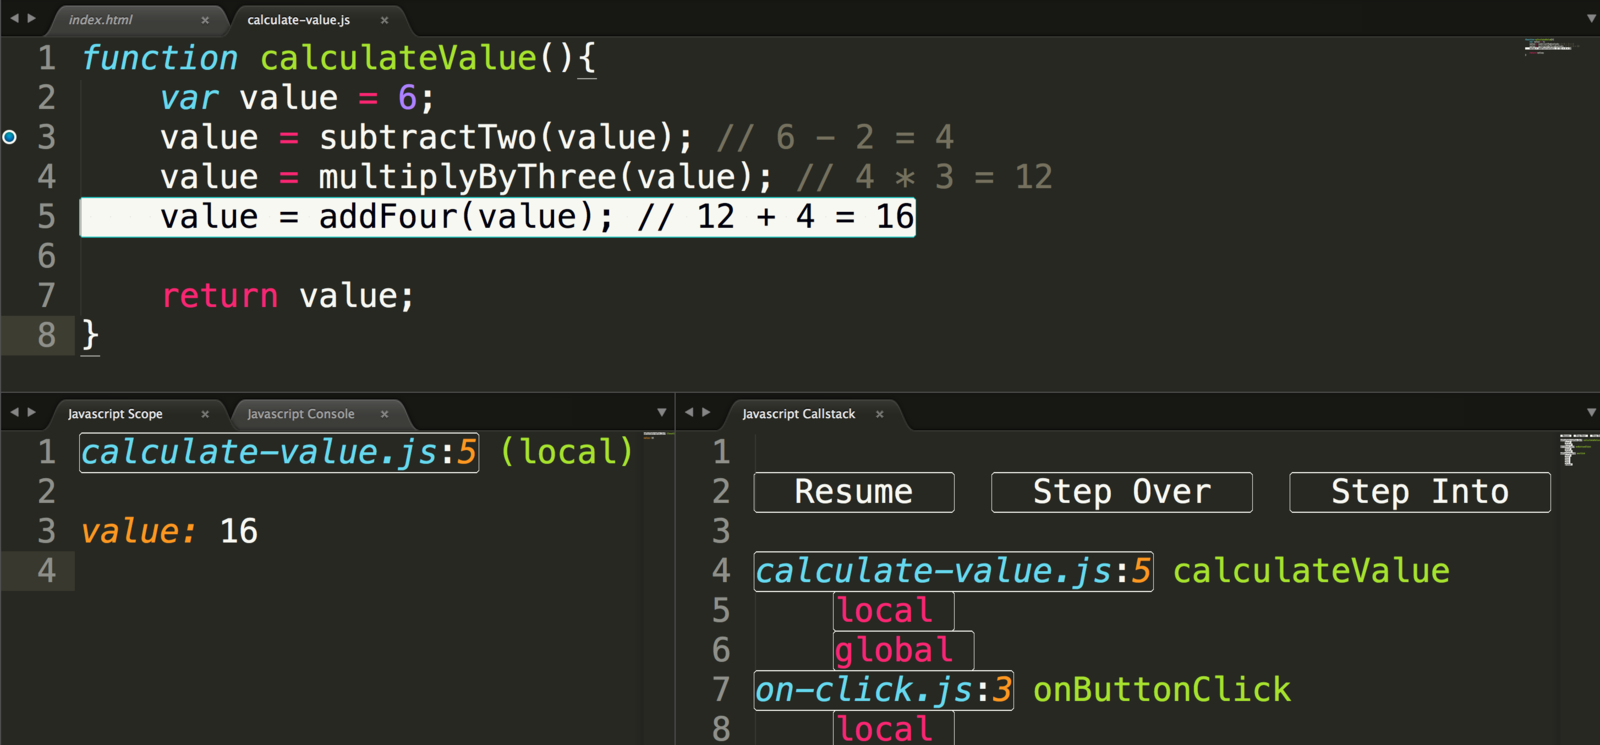
- Run Code Line By Line
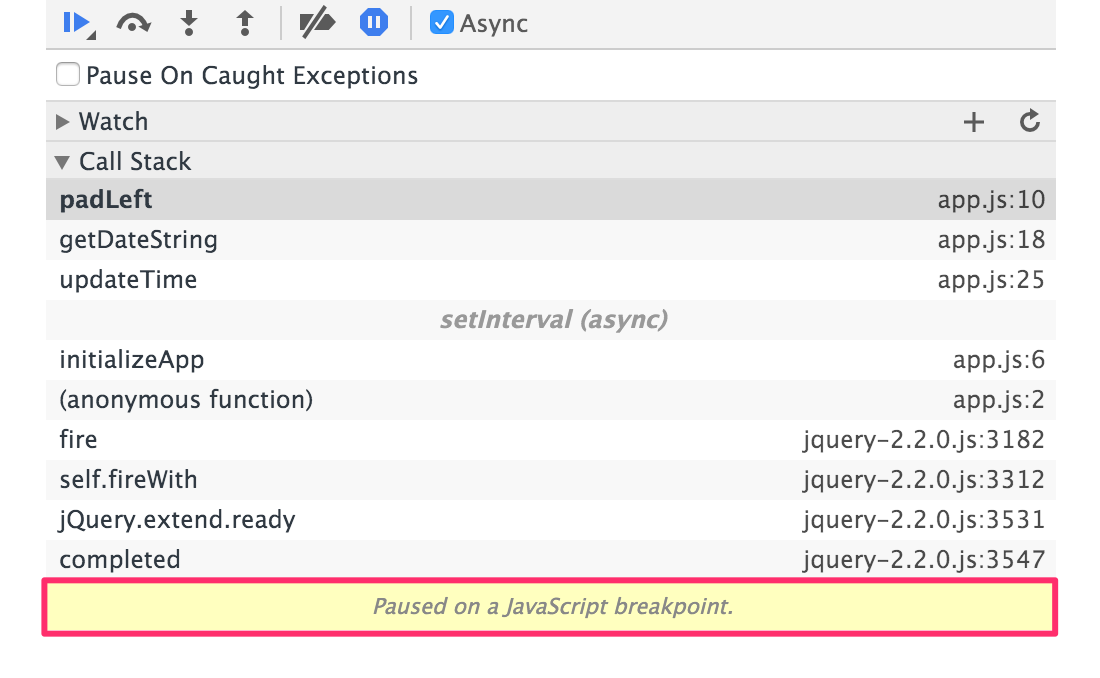
Paused Execution
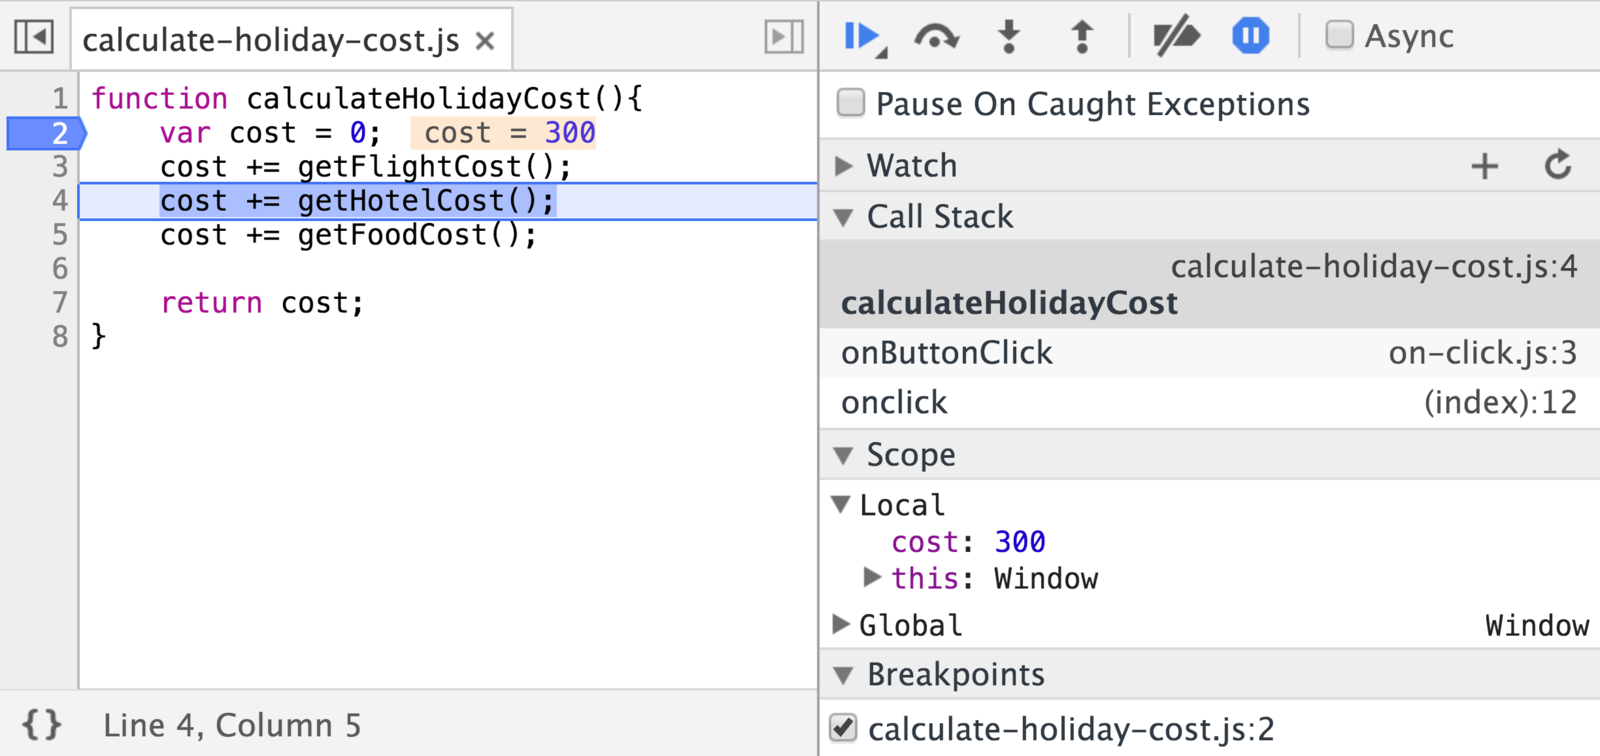
Call Stack
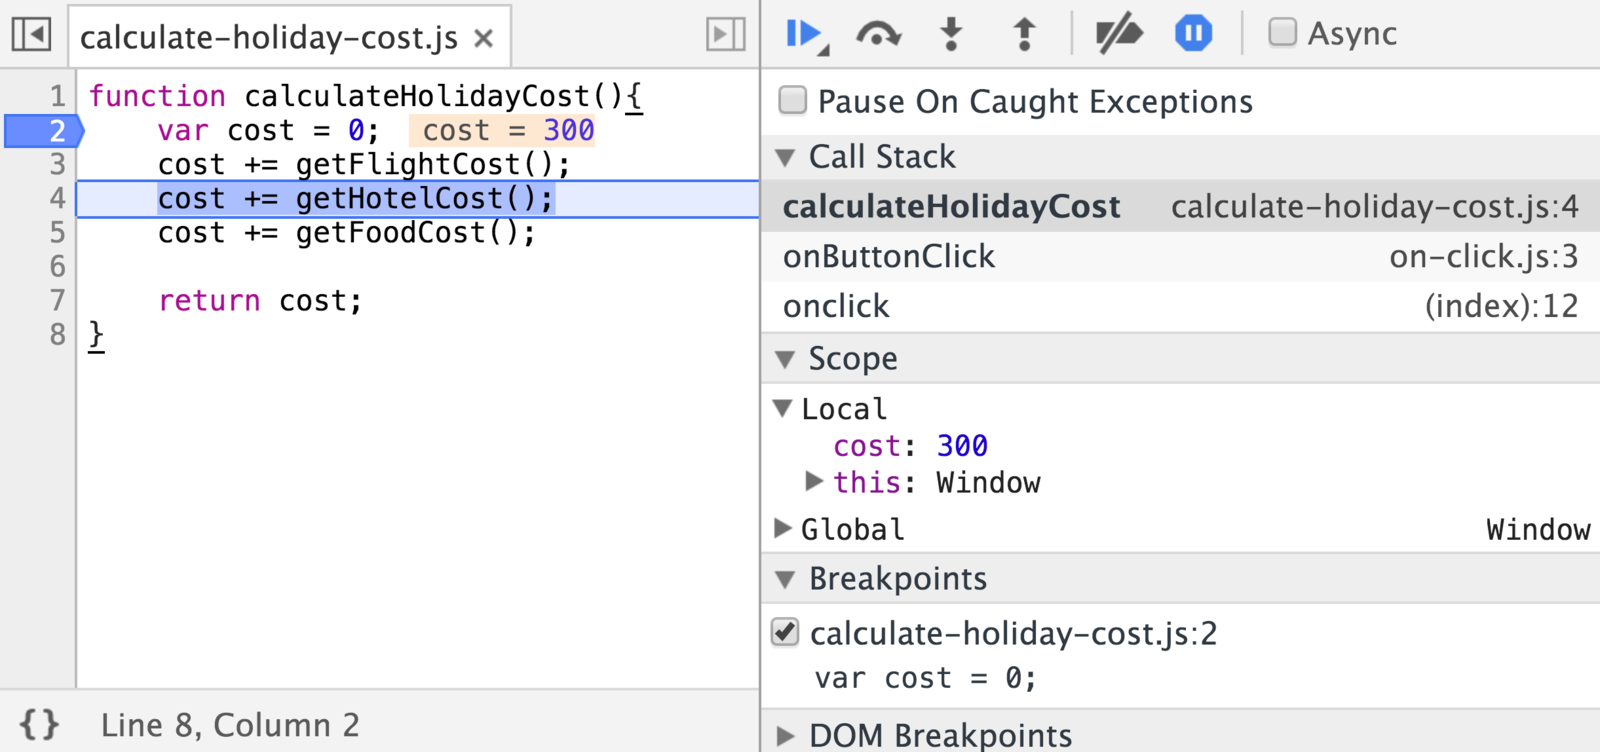
Switch Call Frames
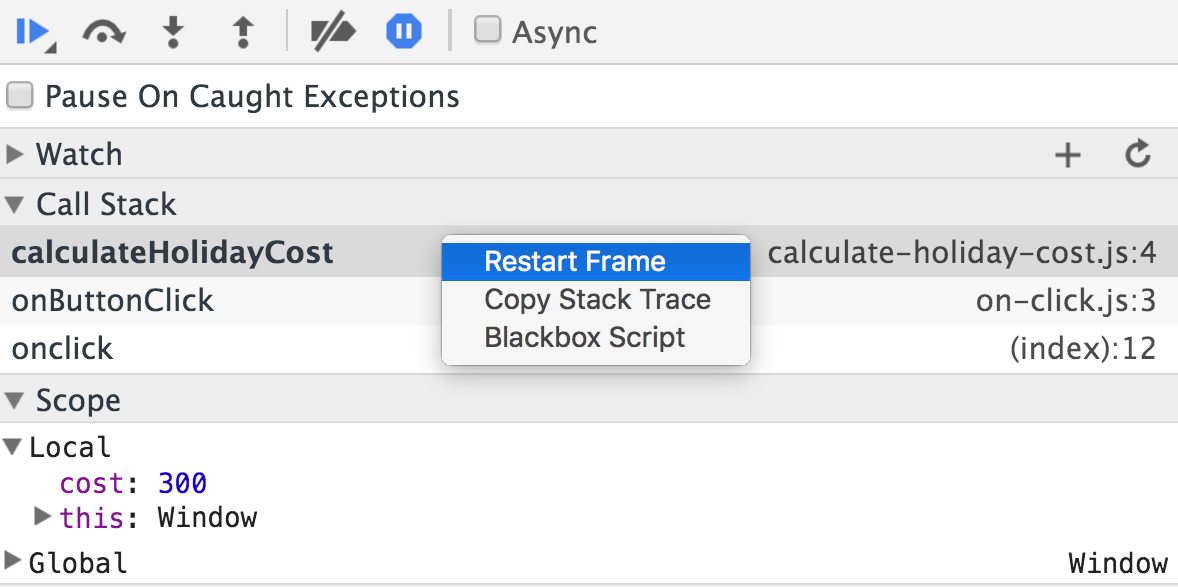
Restart Frame
Call Stack

Call Stack
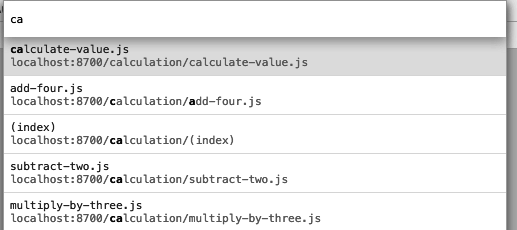
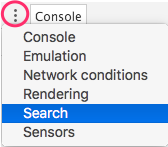
Search for Code
Cmd + O
Ctrl + O
Search for Code
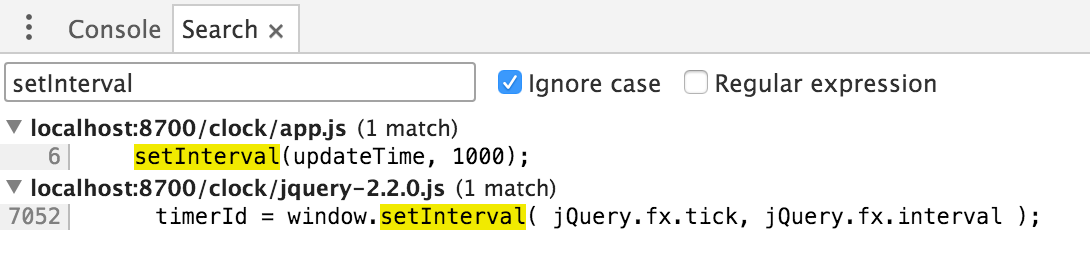
Cmd + Opt + F
Ctrl + Shift + F
Advanced Breakpoints
- Pause on exception
- DOM breakpoints
- Event listener breakpoints
- XHR breakpoints
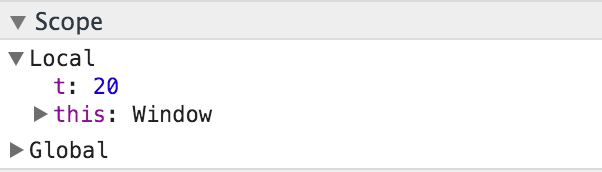
- Make your own with the debugger statement
Bundled Code (SKIP)
function addFour(num) {
return num + 4;
}
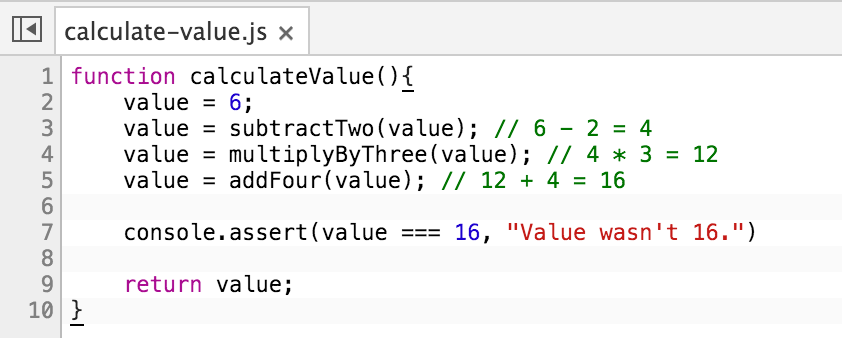
function calculateValue() {
...
}
function multiplyByThree(num) {
...
}
function subtractTwo(num) {
...
}
function onButtonClick() {
...
}Bundled and Minified Code (SKIP)
function addFour(t){return t+4}function calculateValue
(){var t=6;return t=subtractTwo(t),t=multiplyByThree(t)
,t=addFour(t),console.assert(16===t,"Value wasn't 16.")
,t}function multiplyByThree(t){return 4*t}function
subtractTwo(t){return t-2}function onButtonClick(){var
t=document.getElementById("value");t.innerHTML="Value:
"+calculateValue()}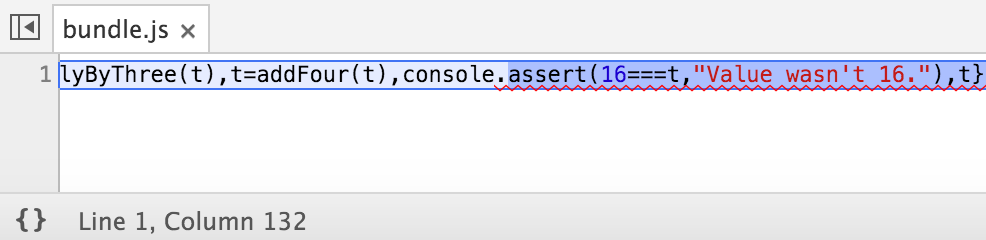
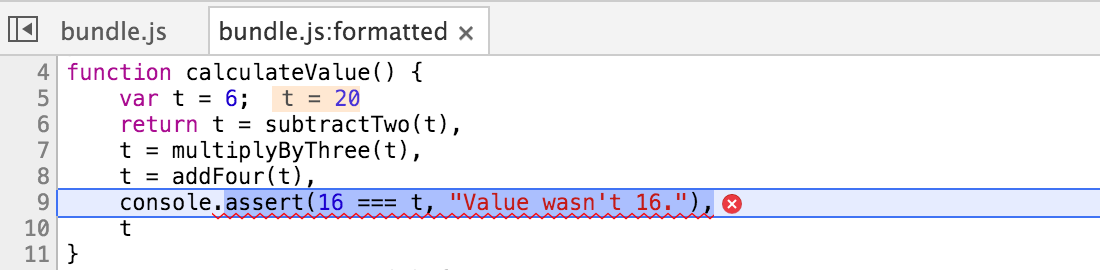
Prettify Code (SKIP)
Source Maps (SKIP)
Source Maps (SKIP)
Source Maps (SKIP)
function calculateValue() {
    var t = 6;
    return t = subtractTwo(t),
        t = multiplyByThree(t),
        t = addFour(t),
        console.assert(16 === t, "Value wasn't 16."),
        t
}
Source Maps (SKIP)
Source Maps (SKIP)
{
    "version": 3,
    "sources": ["add-four.js", "on-click.js",...],
    "names": ["addFour", "num", "value",...],
    "mappings": "AAAA,QAASA,SAAQC,GACb,...",
    "file": "bundle.js"
}
Source Maps (SKIP)
todo: pic of visualizer
"all source maps do is map a position in the compiled source to a position in the original source"
Remote Debugging
<=> WebSockets <=>
Chrome Desktop
DevTools
(Chrome Debugger Protocol)
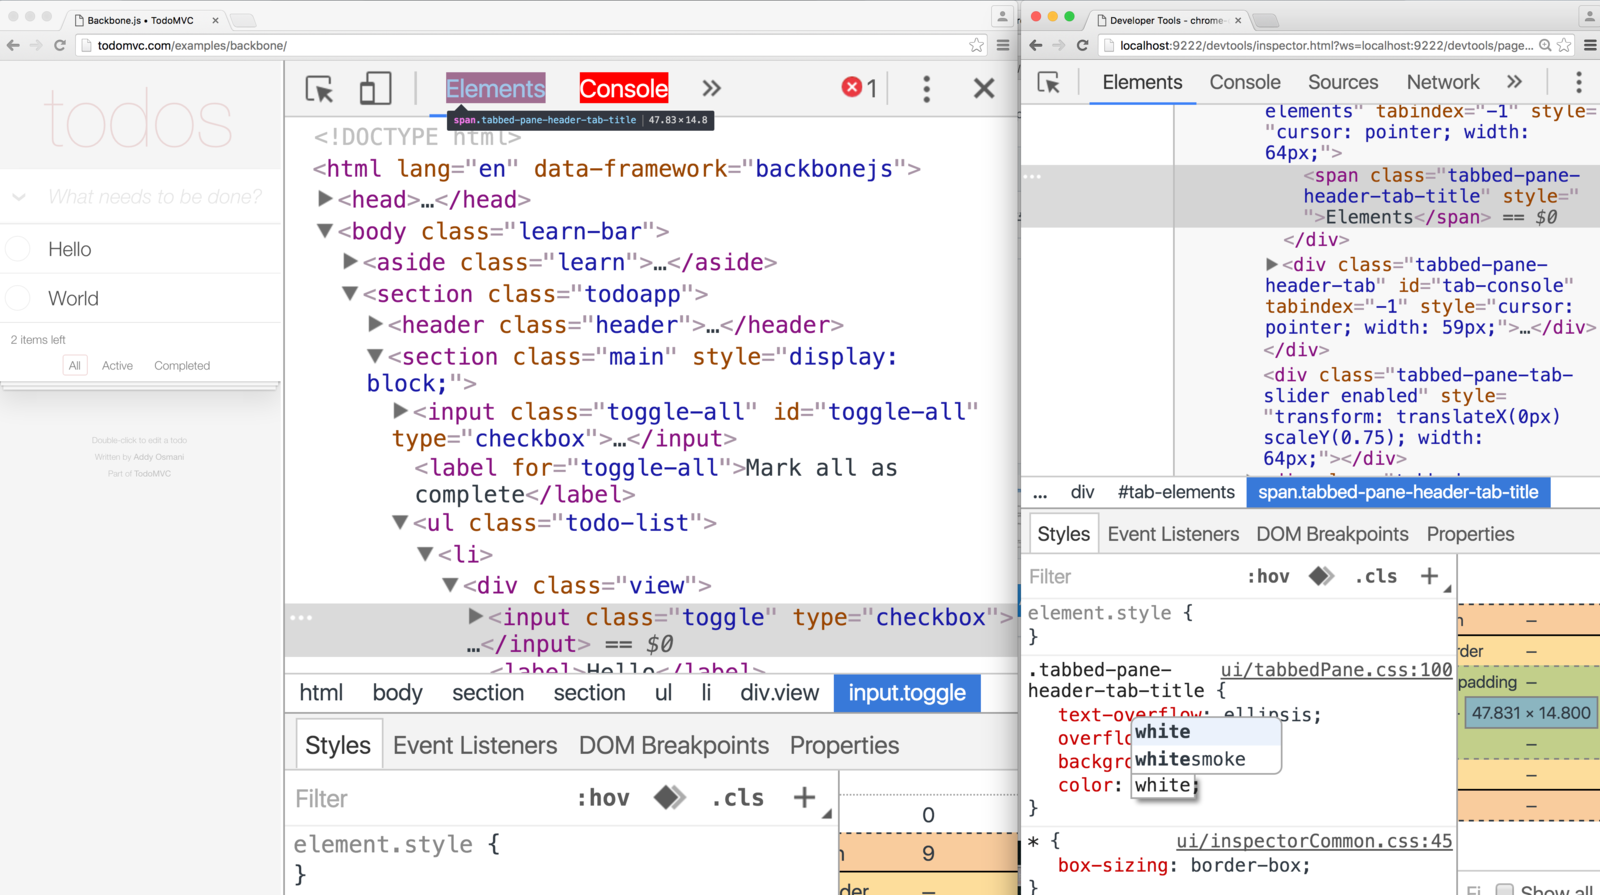
Debugging DevTools
Remote Debugging
<=> WebSockets <=>
Chrome Desktop
Chrome on Android
Node
DevTools
Sublime Text
WebStorm
Visual Studio Code
IntelliJ IDEA
(Chrome Debugger Protocol)
Node-Inspector
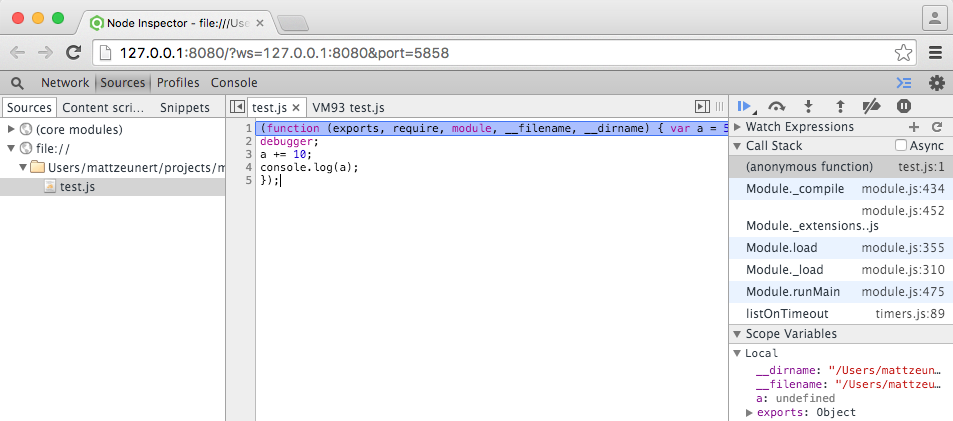
node-debug test.js
Remote Debugging
<=> WebSockets <=>
Chrome Desktop
Chrome on Android
Node
DevTools
Sublime Text
WebStorm
Visual Studio Code
IntelliJ IDEA
(Chrome Debugger Protocol)
Sublime WebInspector
DevTools Extensions (SKIP)
Thanks
bit.ly/js-debugging
@mattzeunert
1
Copy of front-endgineers
By Matt Zeunert


