Debugging JavaScript with Chrome DevTools
- Debugger Intro
- Stepping Through Code
- Behaviour-based Breakpoints
- Console Logging
- Source Maps
- Remote Debugging
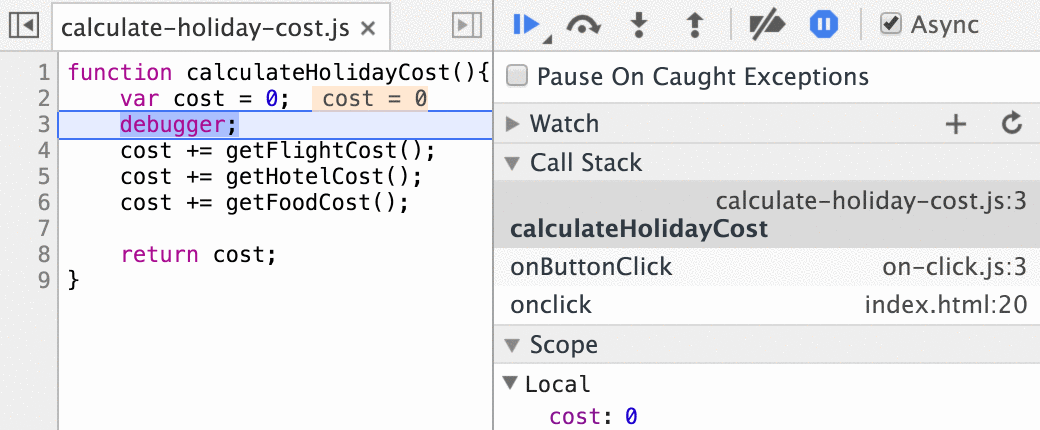
JavaScript Debugging
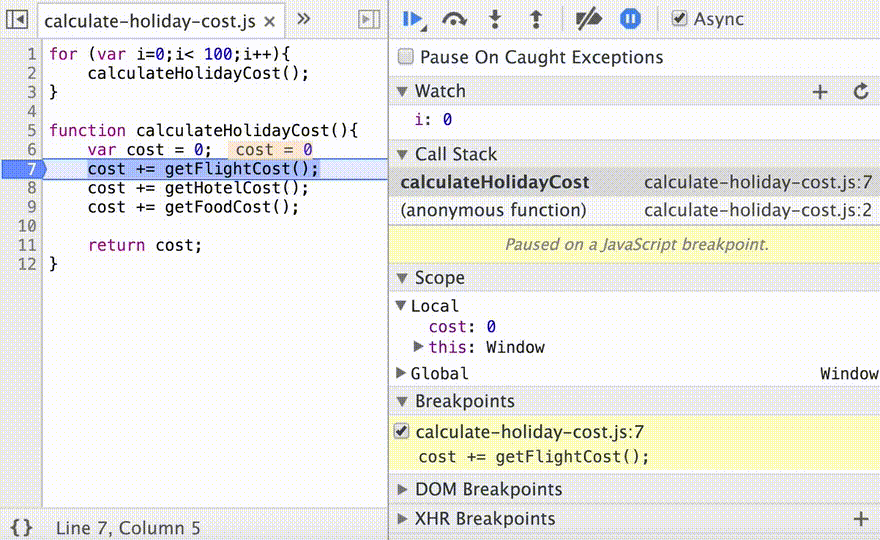
Paused Execution
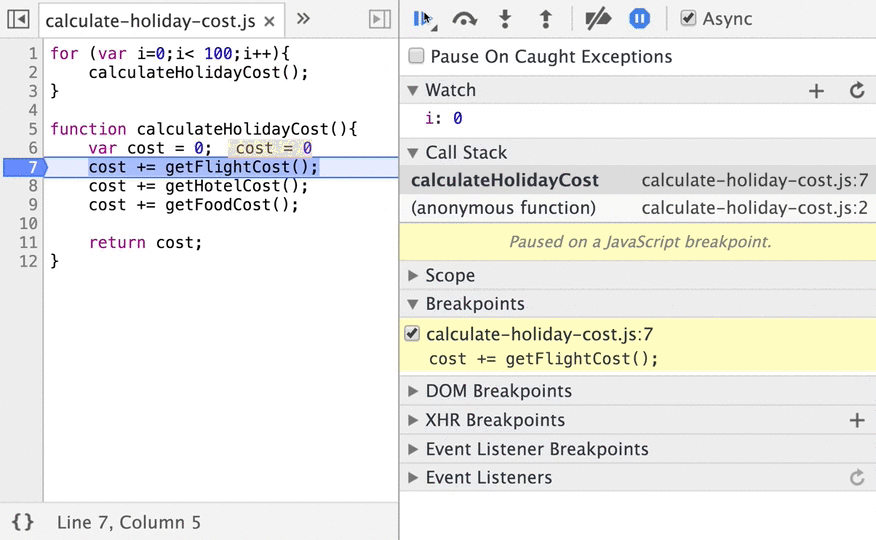
Add Breakpoint
Searching For Code
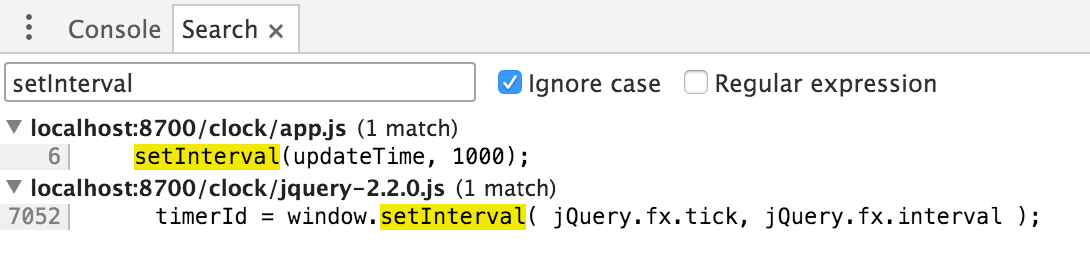
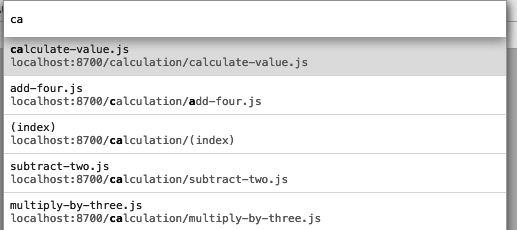
Cmd + O
Cmd + Opt + F
Windows: Ctrl + O, Ctrl + Shift + F
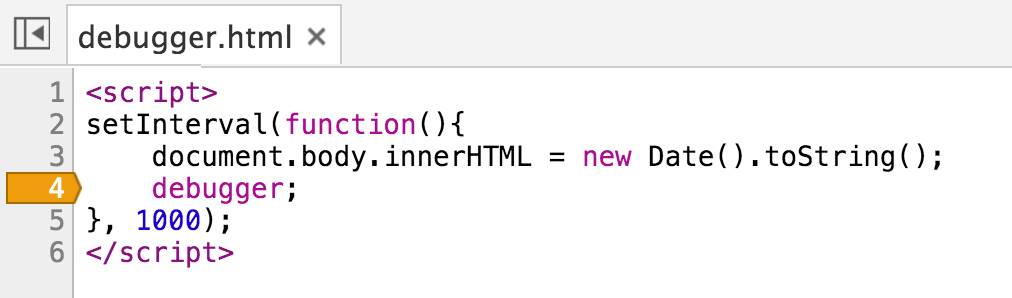
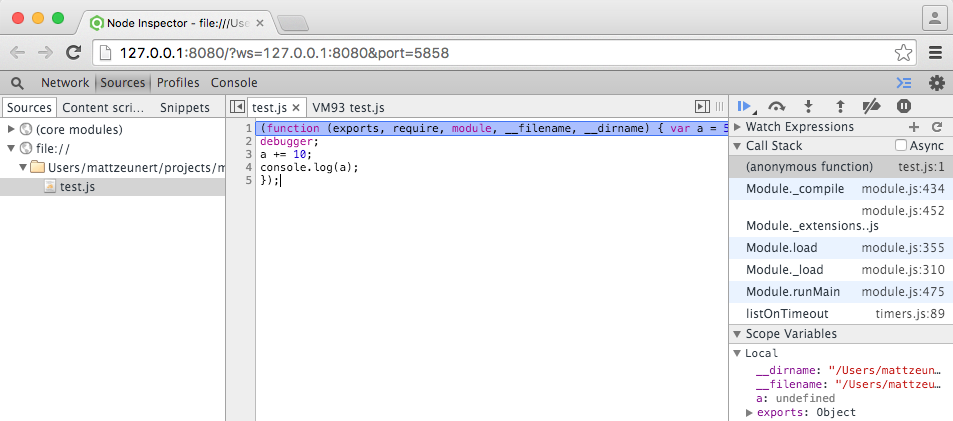
Debugger Statement
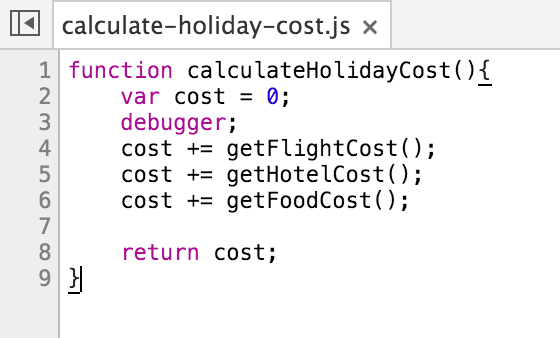
Debugger Statement

Step Through
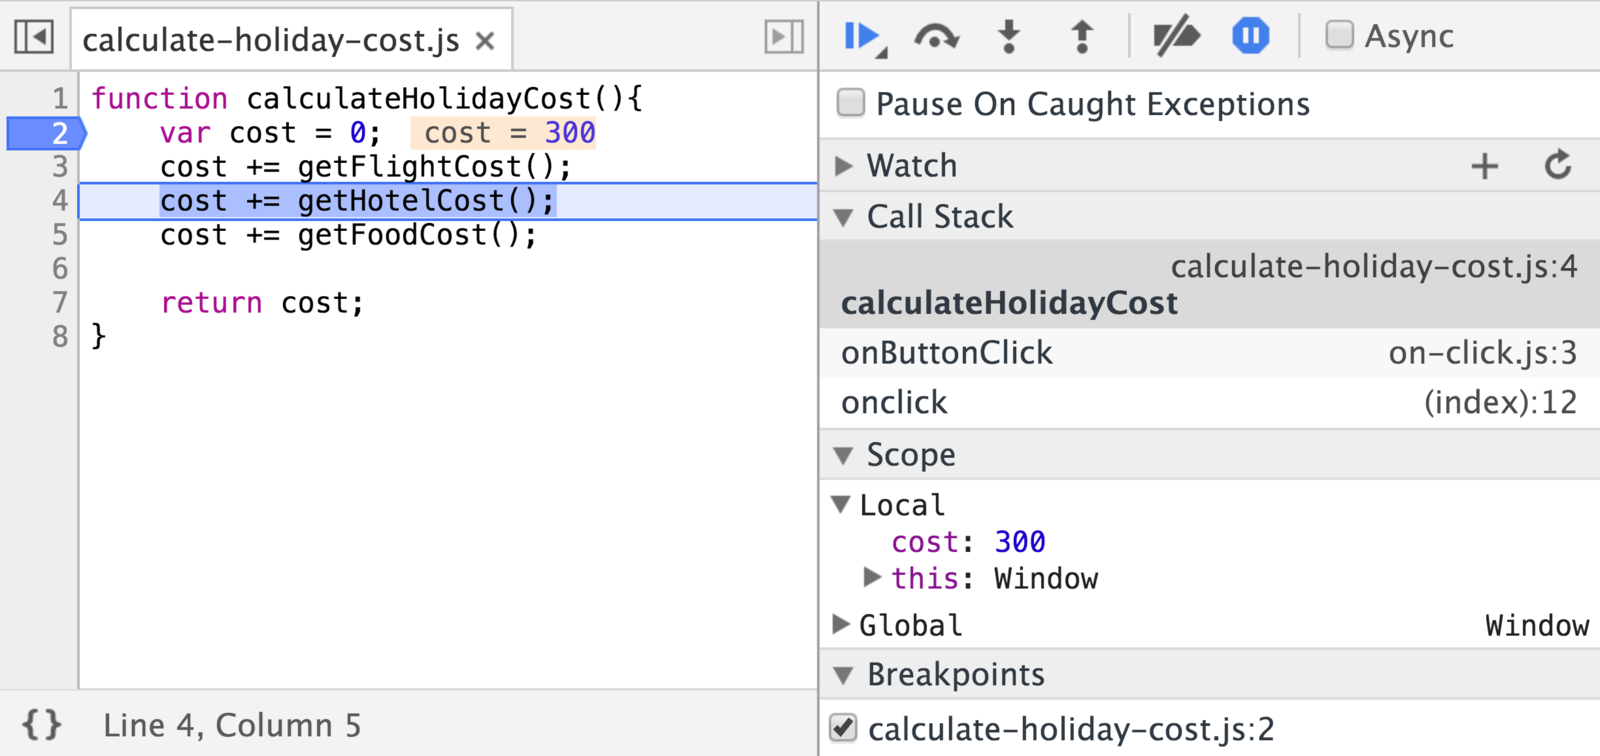
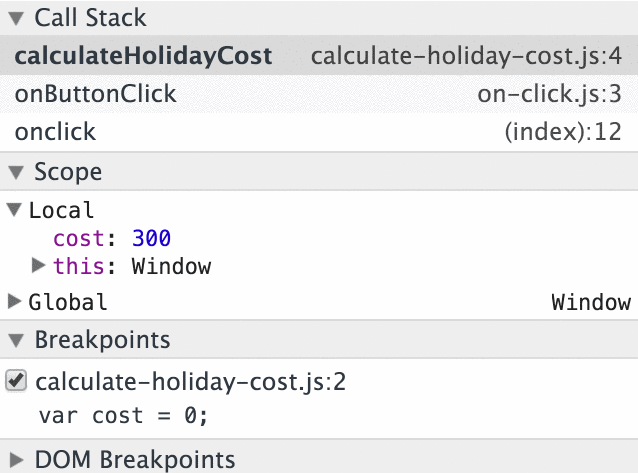
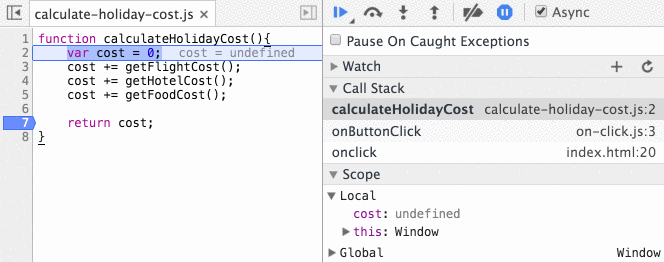
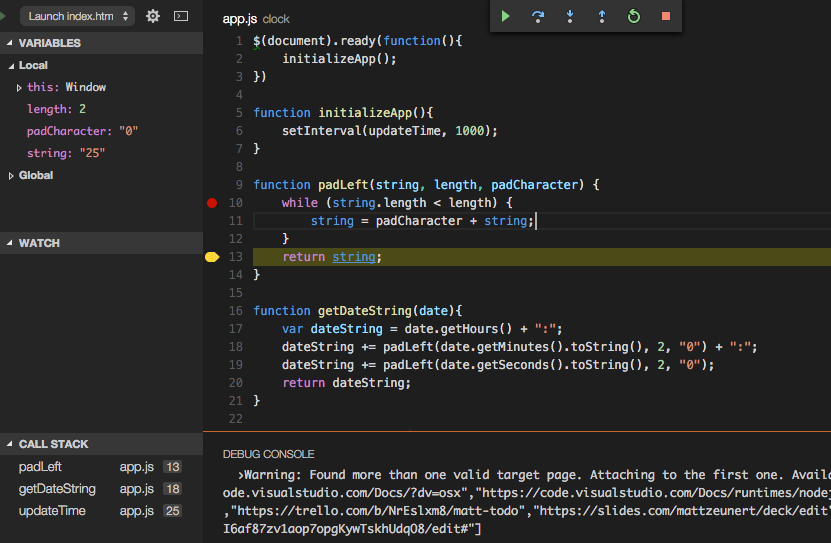
Call Stack
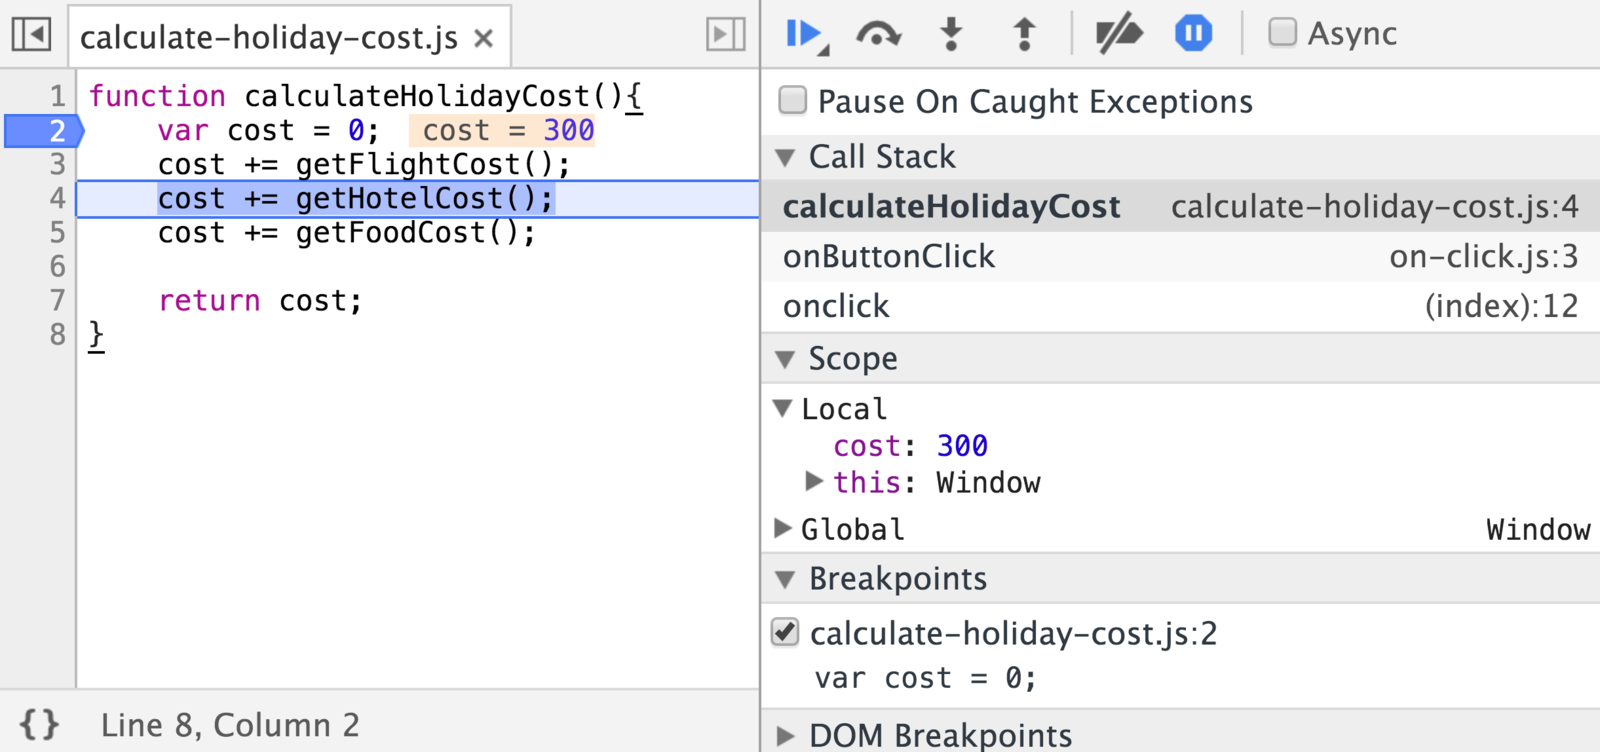
Switch Call Frames
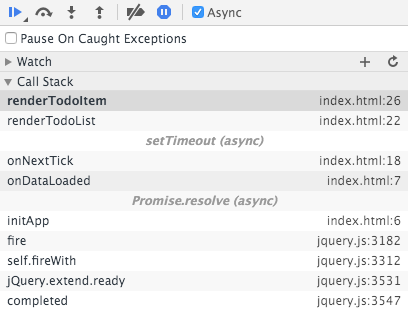
Async Call Stack
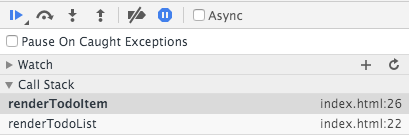
Async Call Stack
Return Value
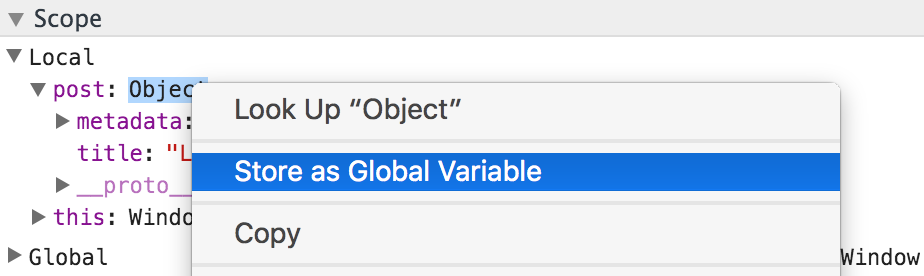
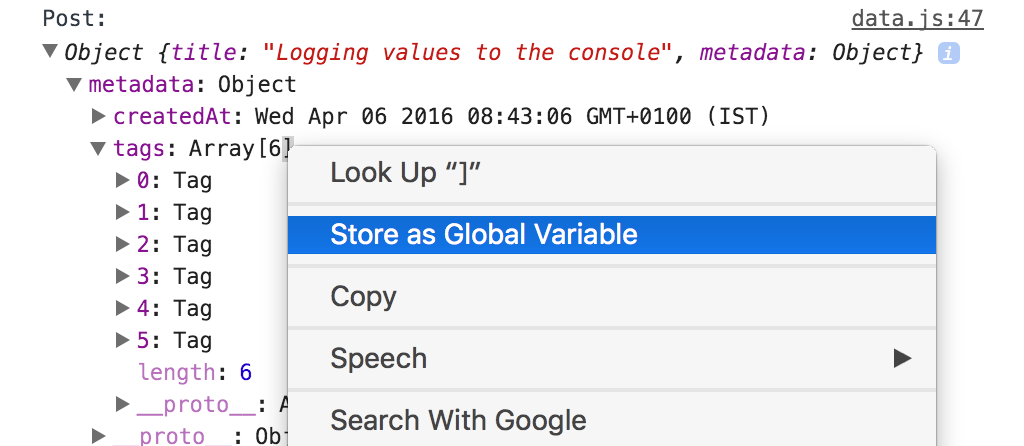
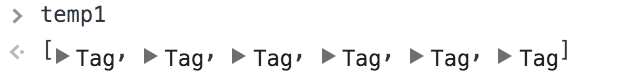
Store As Global Variable

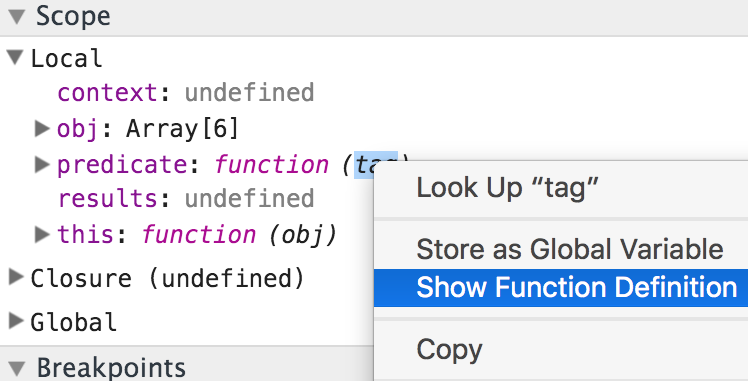
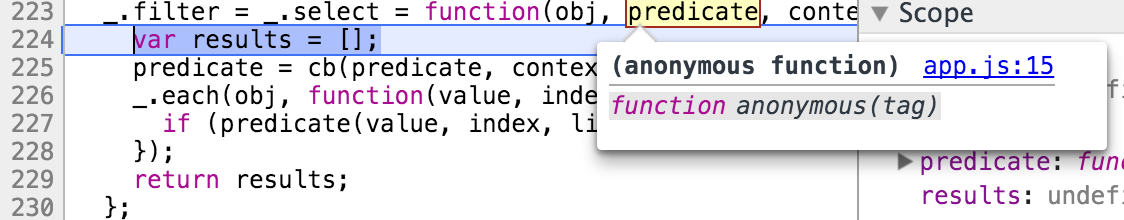
Show Function Definition
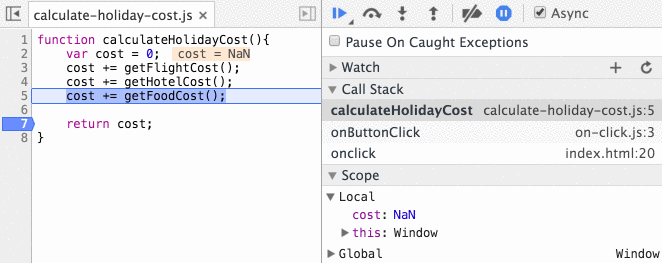
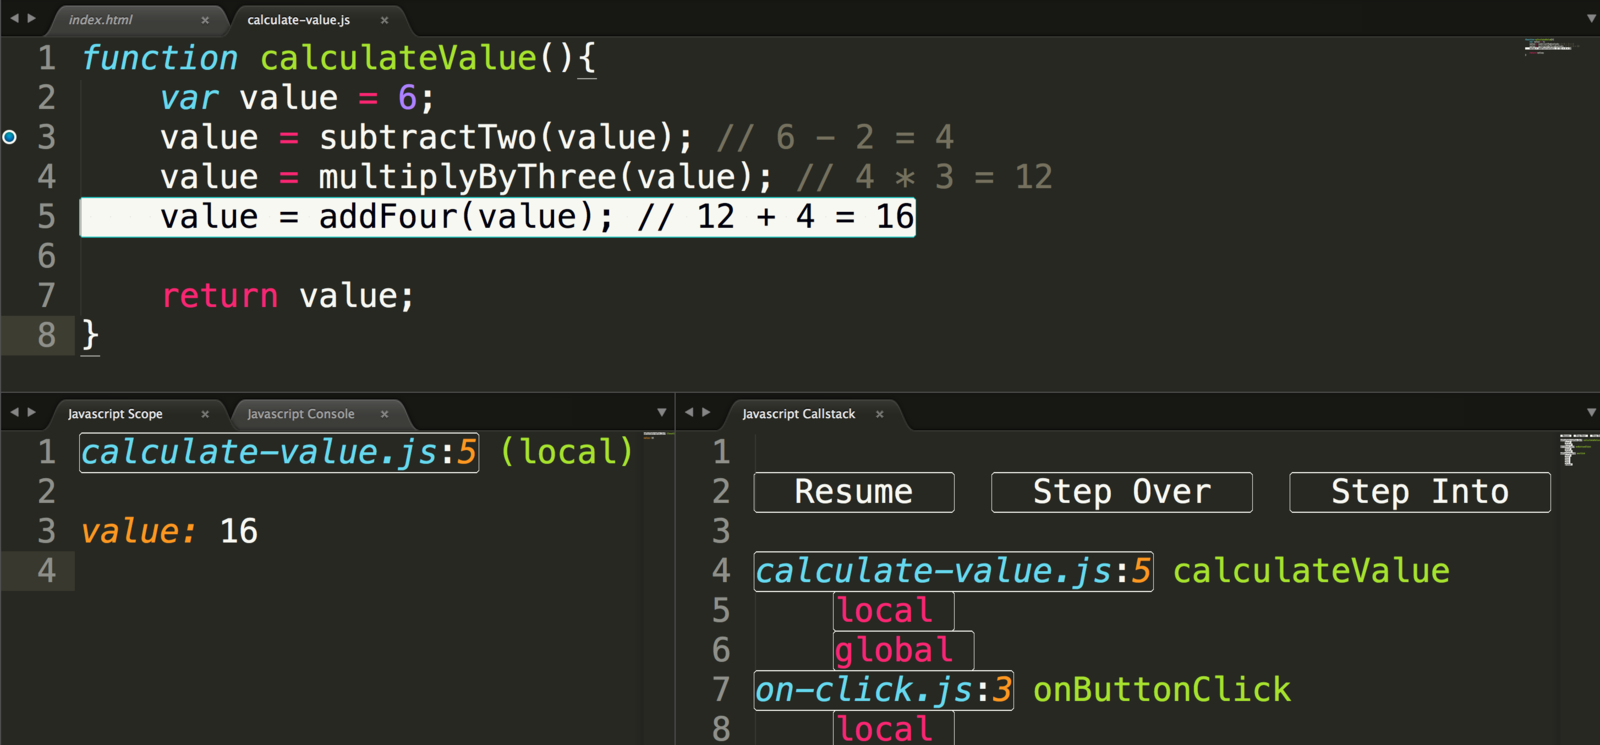
Stepping Through Code
Stepping Controls

- Resume
- Step Over
- Step Into
- Step Out
Long Resume
Long Resume
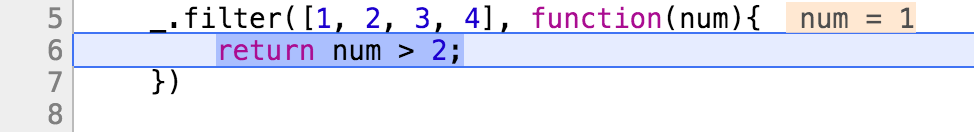
Blackboxing Library Code

Blackboxing Library Code
Blackboxing Library Code
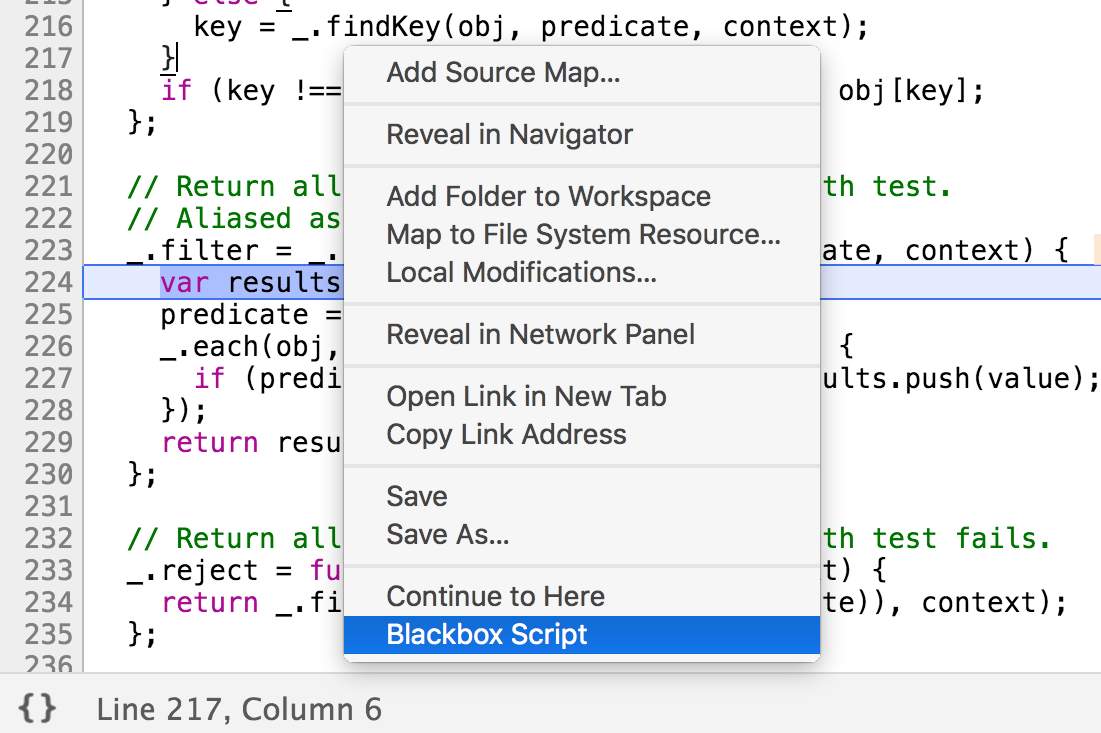
Blackboxing Library Code
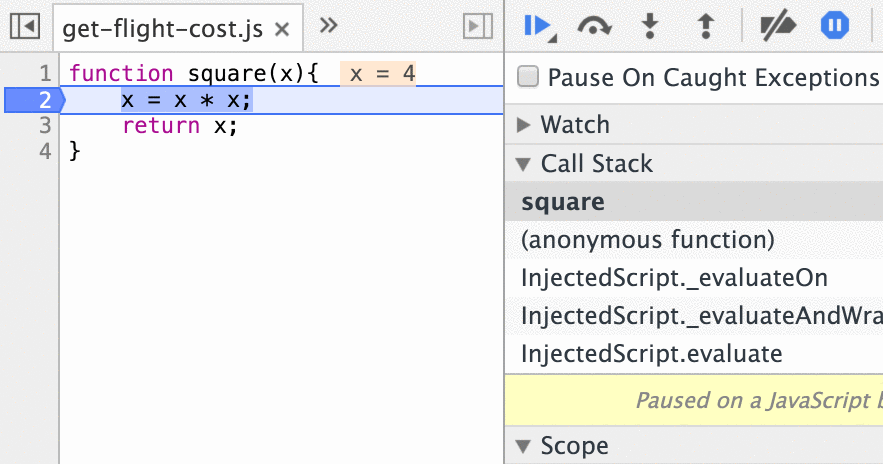
Restart Frame
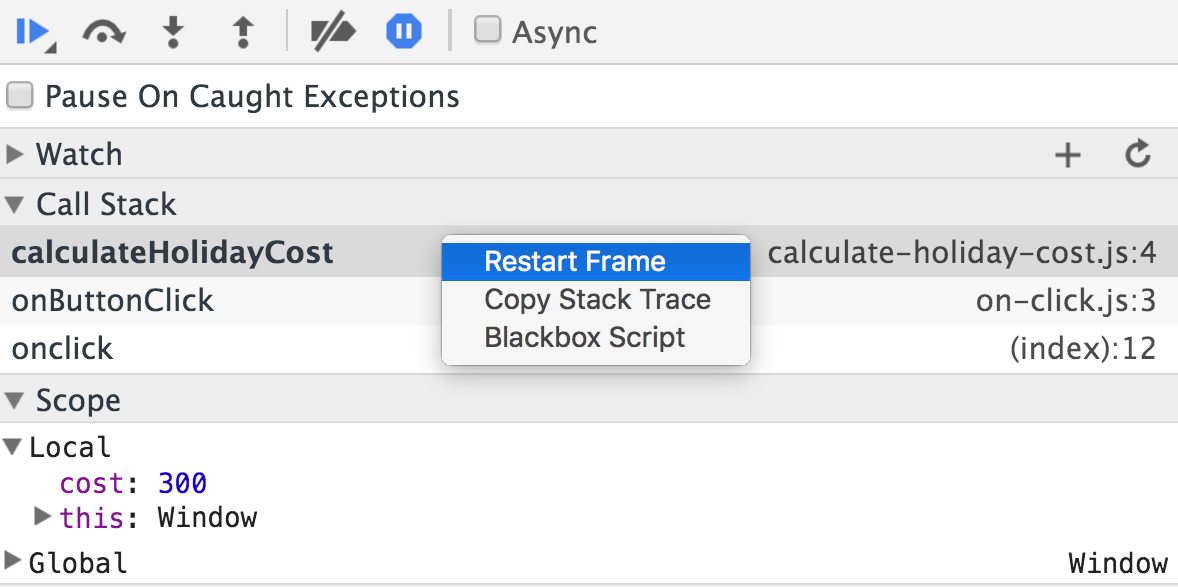
Restart Frame
Restart Frame
Restart Frame
Restart Frame
Restart Frame (Limitations)
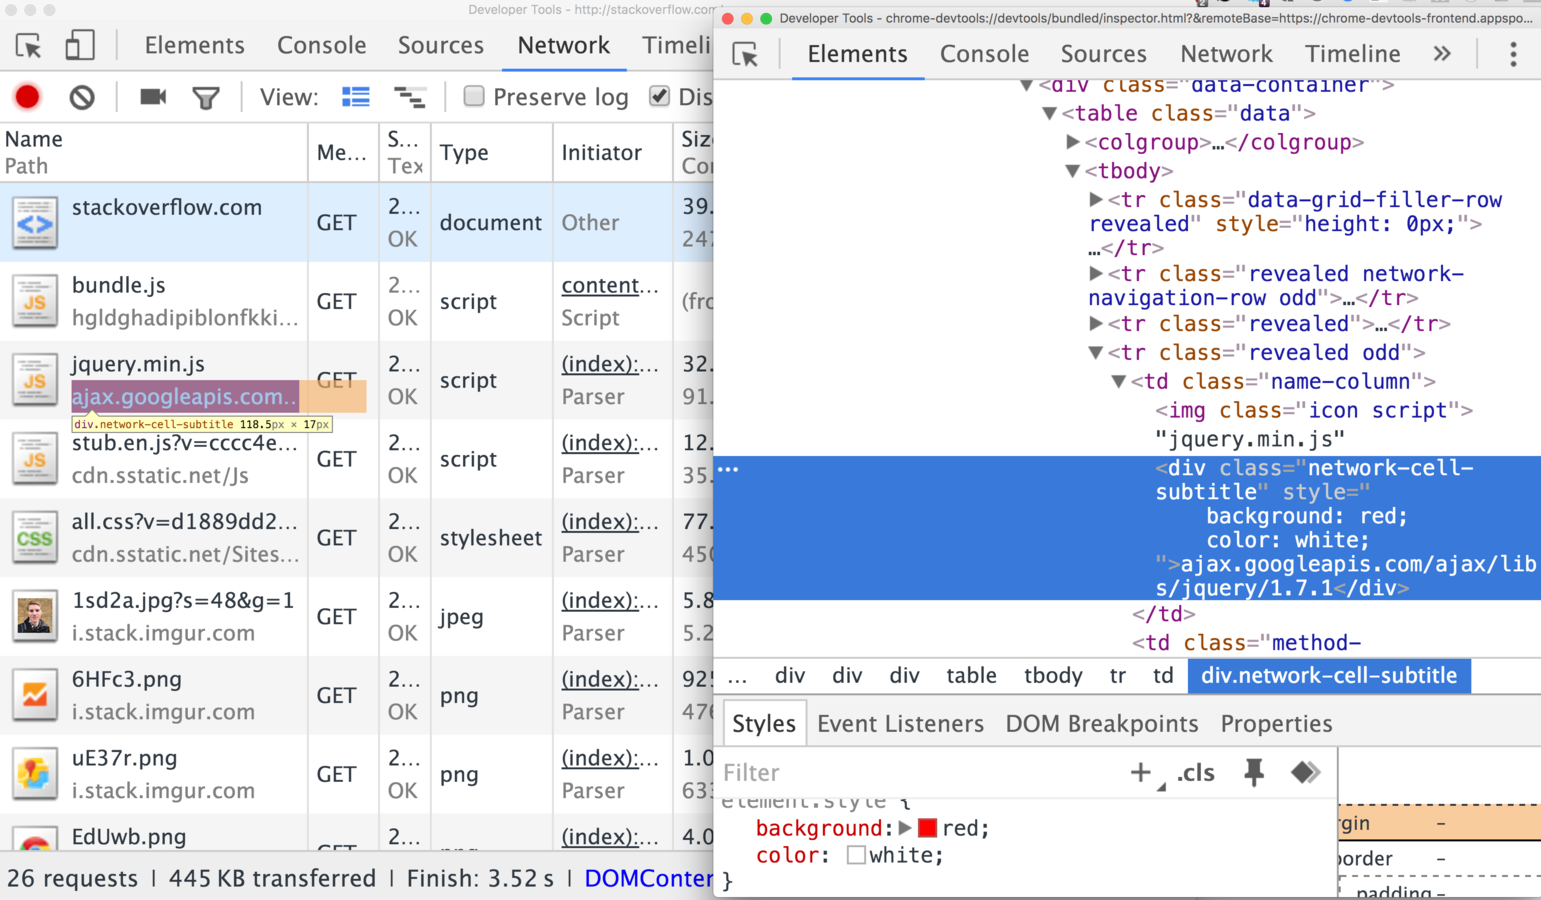
Behaviour-based Breakpoints
Behaviour-based Breakpoints
DevTools can pause on
- Exceptions
- DOM changes
- DOM events
- Ajax requests
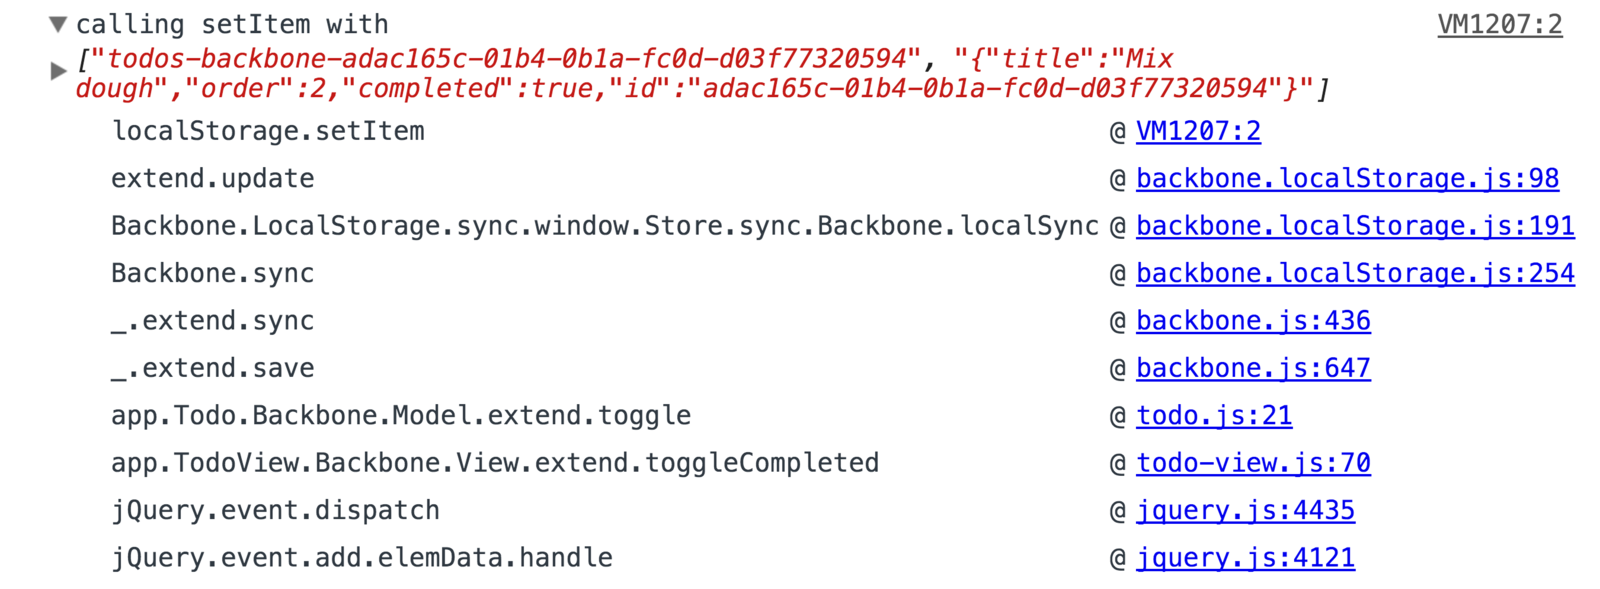
var originalSetItem = localStorage.setItem;
localStorage.setItem = function(){
    debugger;
    return originalSetItem.apply(this, arguments);
}
Calling The Original Function
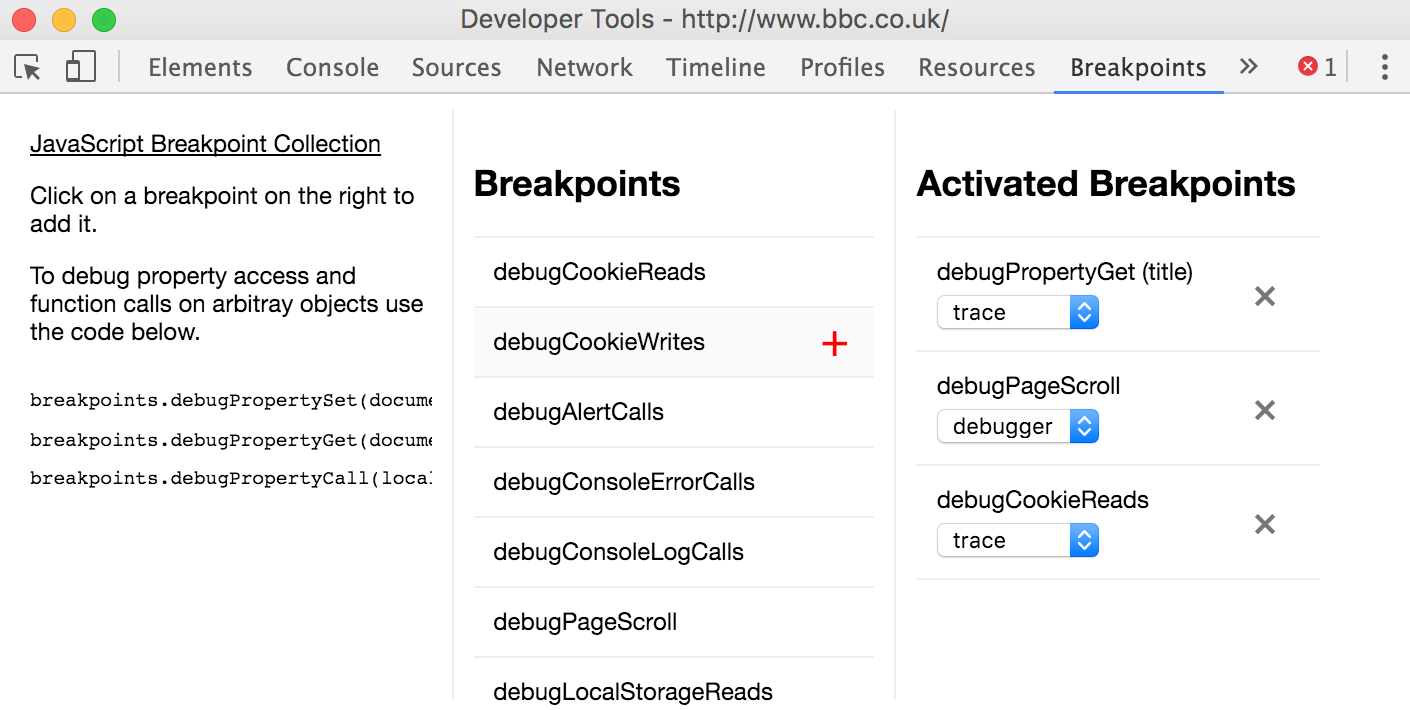
Custom Breakpoints
Pause on:
- Function Calls
- Object Property Access
Break On Property Access
Object.defineProperty(document, "cookie", {
    set: function(){
        debugger;
    }
});
Debugging Snippets
Break On Scroll Change
Pause on:
- body.scrollTop access
- window.scrollTo calls
- window.scrollBy calls
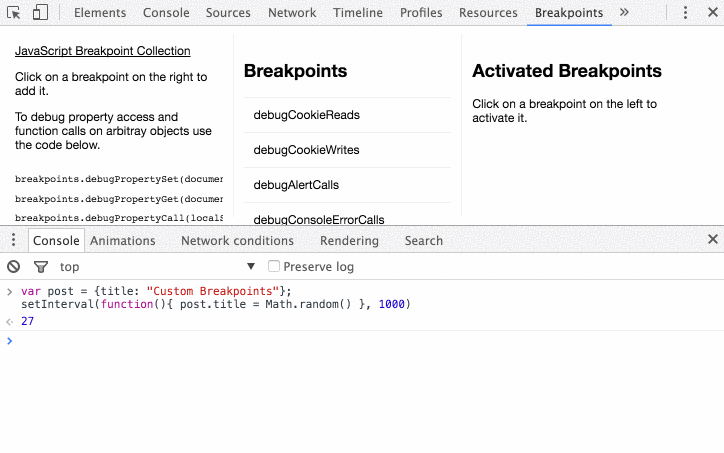
Breakpoint Collection
Breakpoint Collection
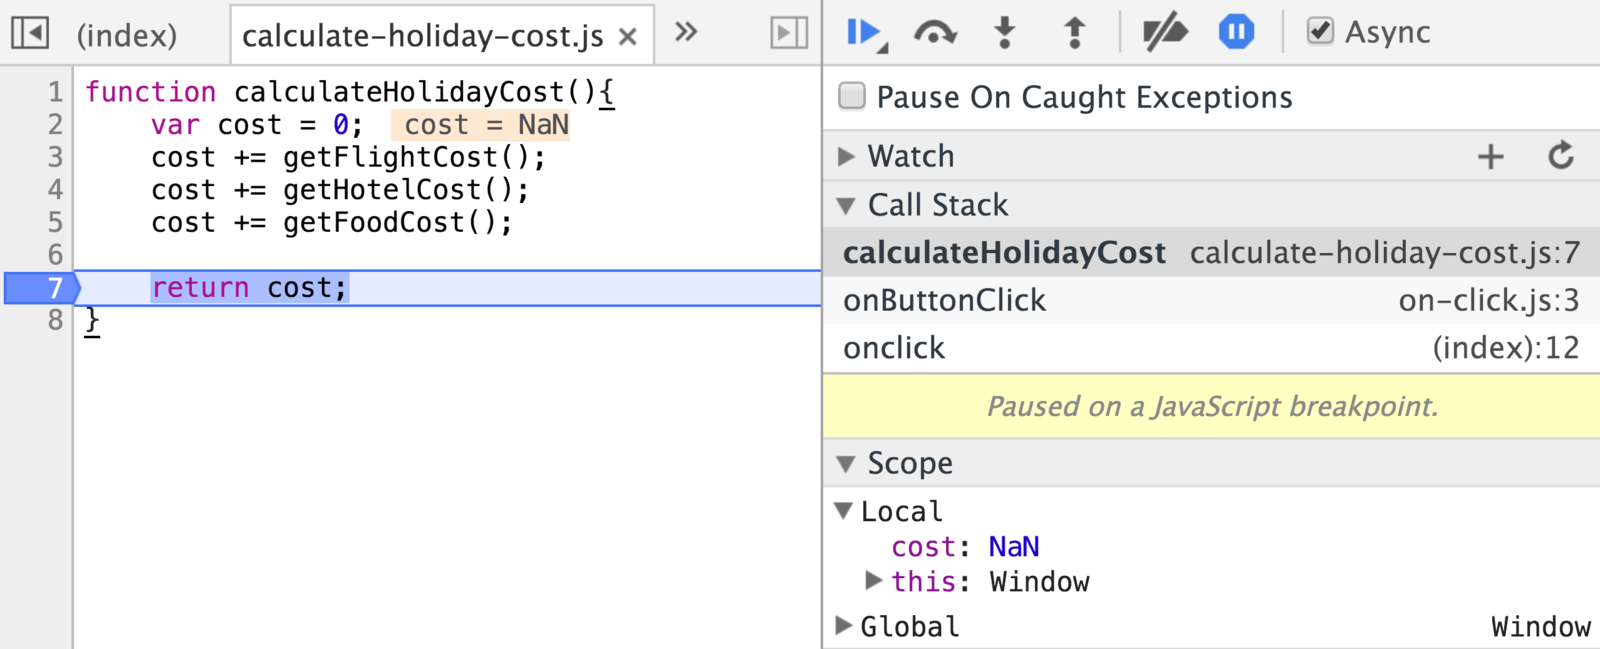
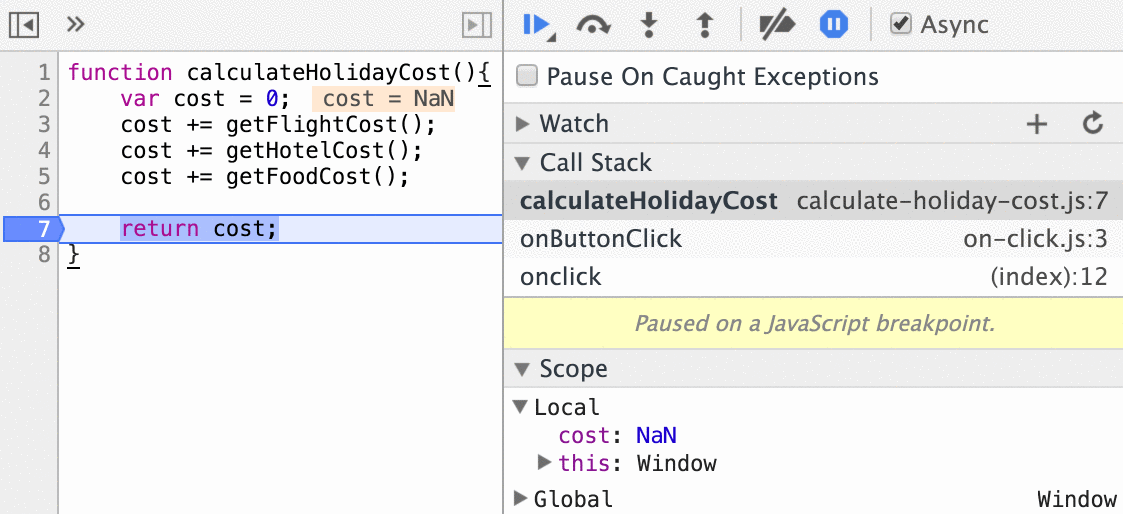
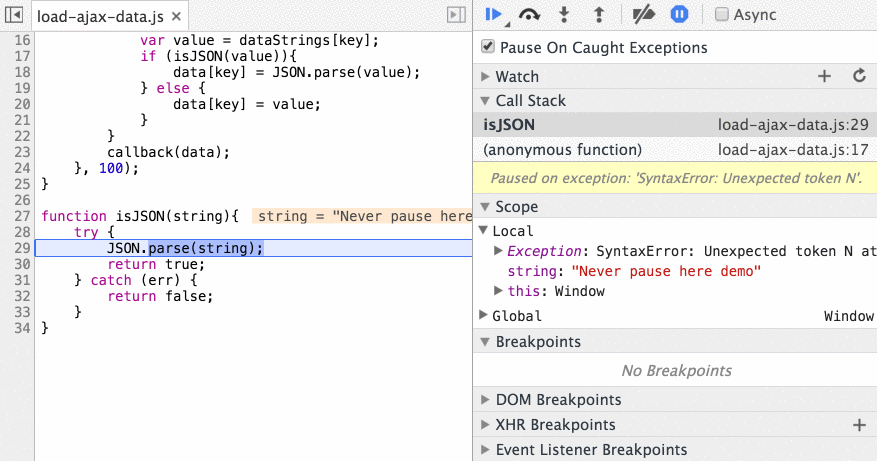
Pause On Exception
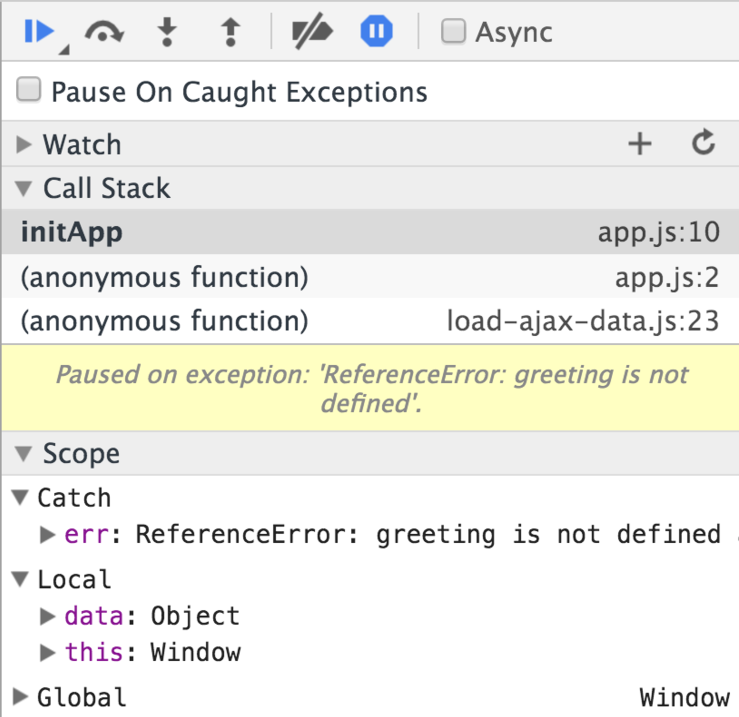
Pause On Exception
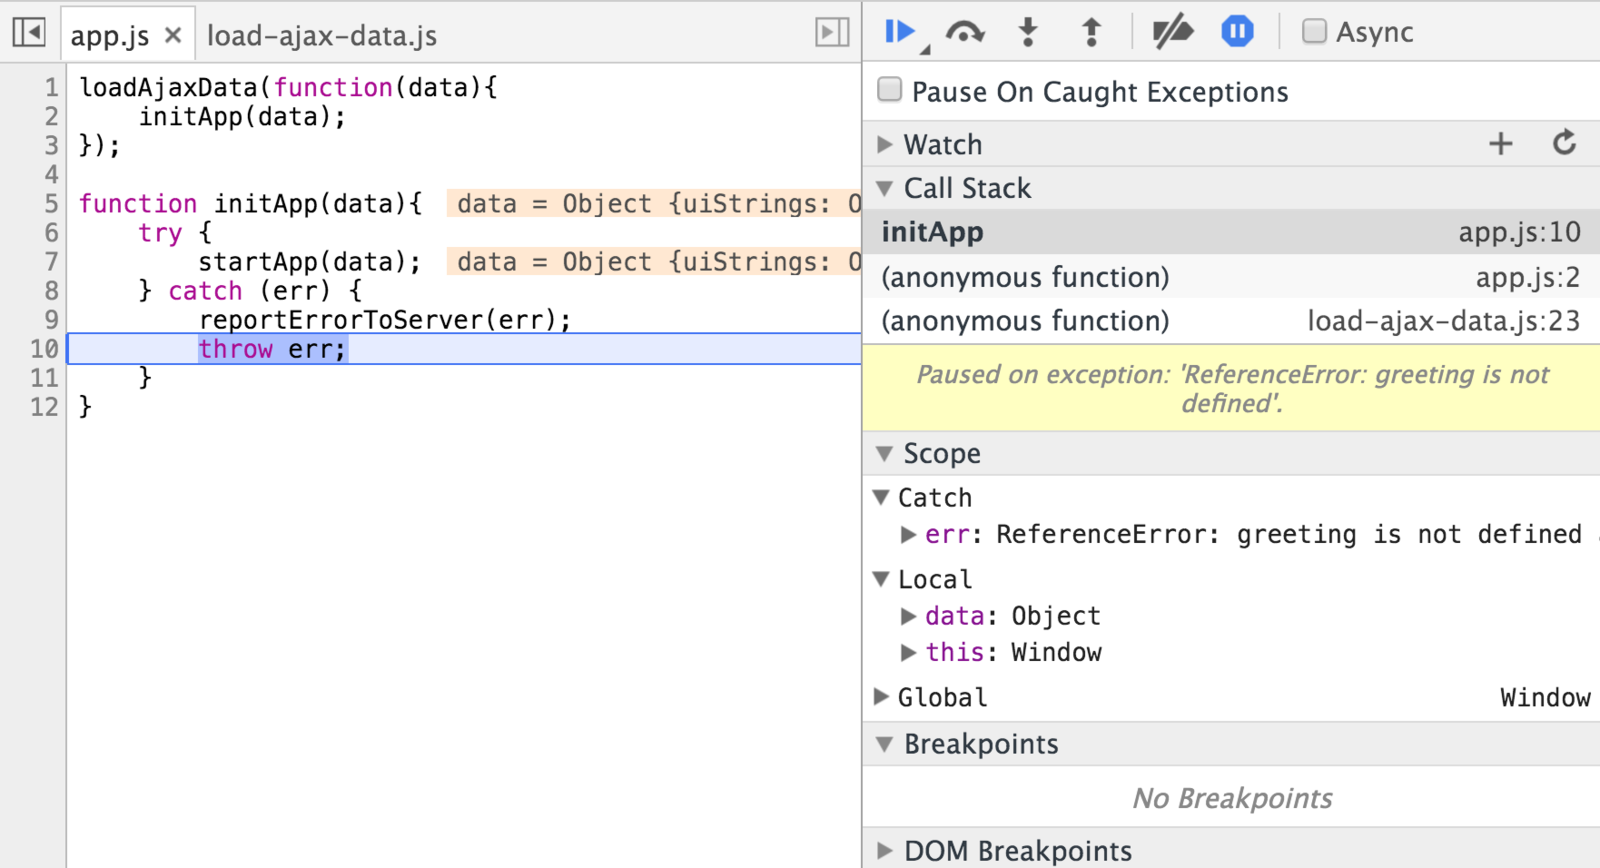
Pause On Caught Exceptions
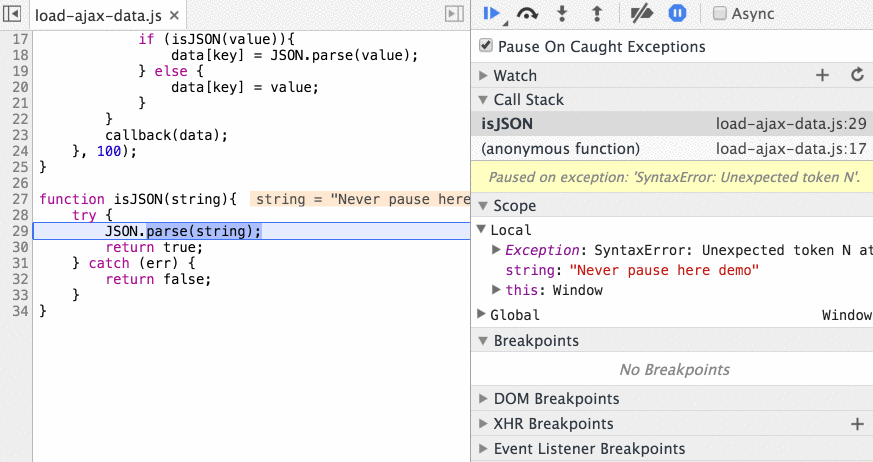
Never Pause Here
Disable Debugger Statements
Console Logging
Console Logging
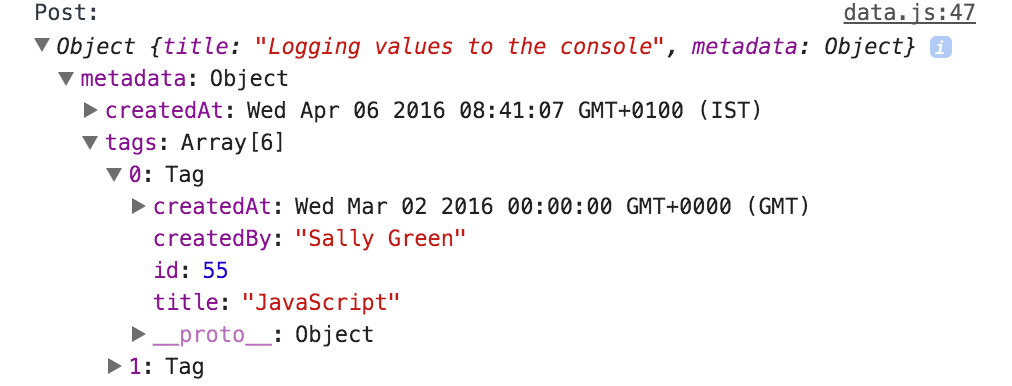
console.log("Post:", post);
Logging Wrapped Objects
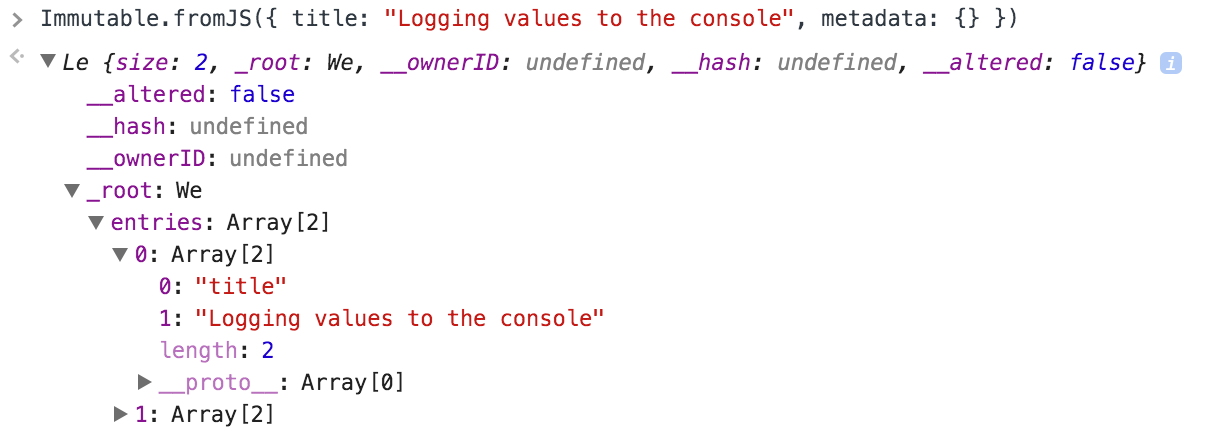
Custom Object Formatters
Immutable DevTools
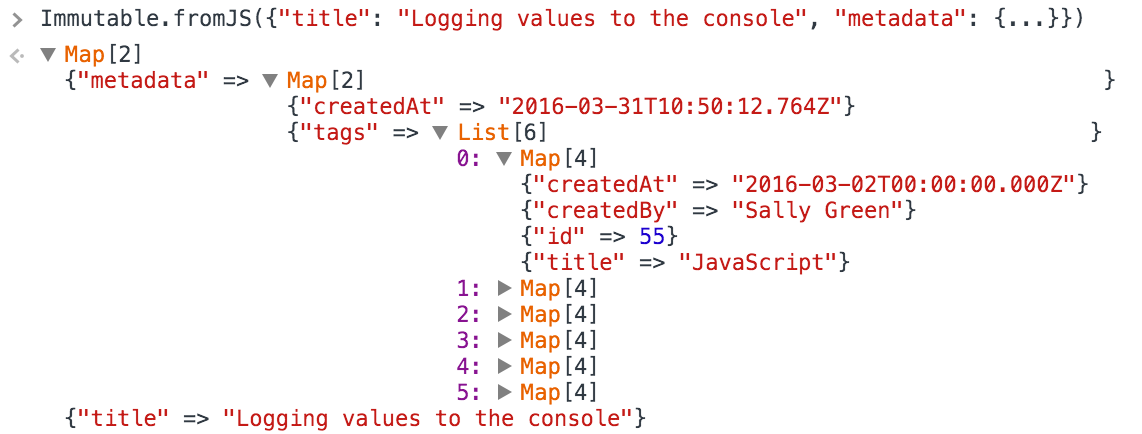
Custom Object Formatters
window.devtoolsFormatters = [{
    header: function(obj){
        return ["div", {}, obj.toString()]
    },
    hasBody: function(){
        return false;
    }
}]
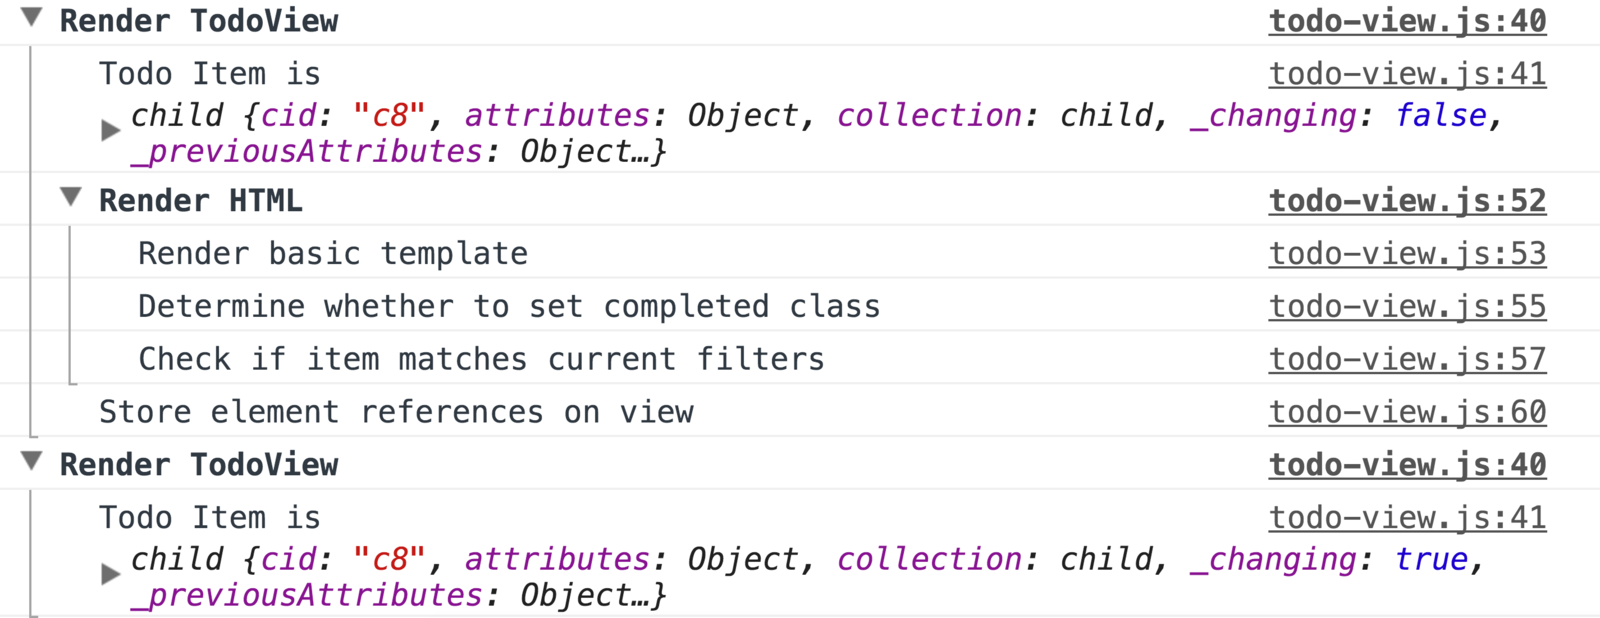
console.trace
console.group
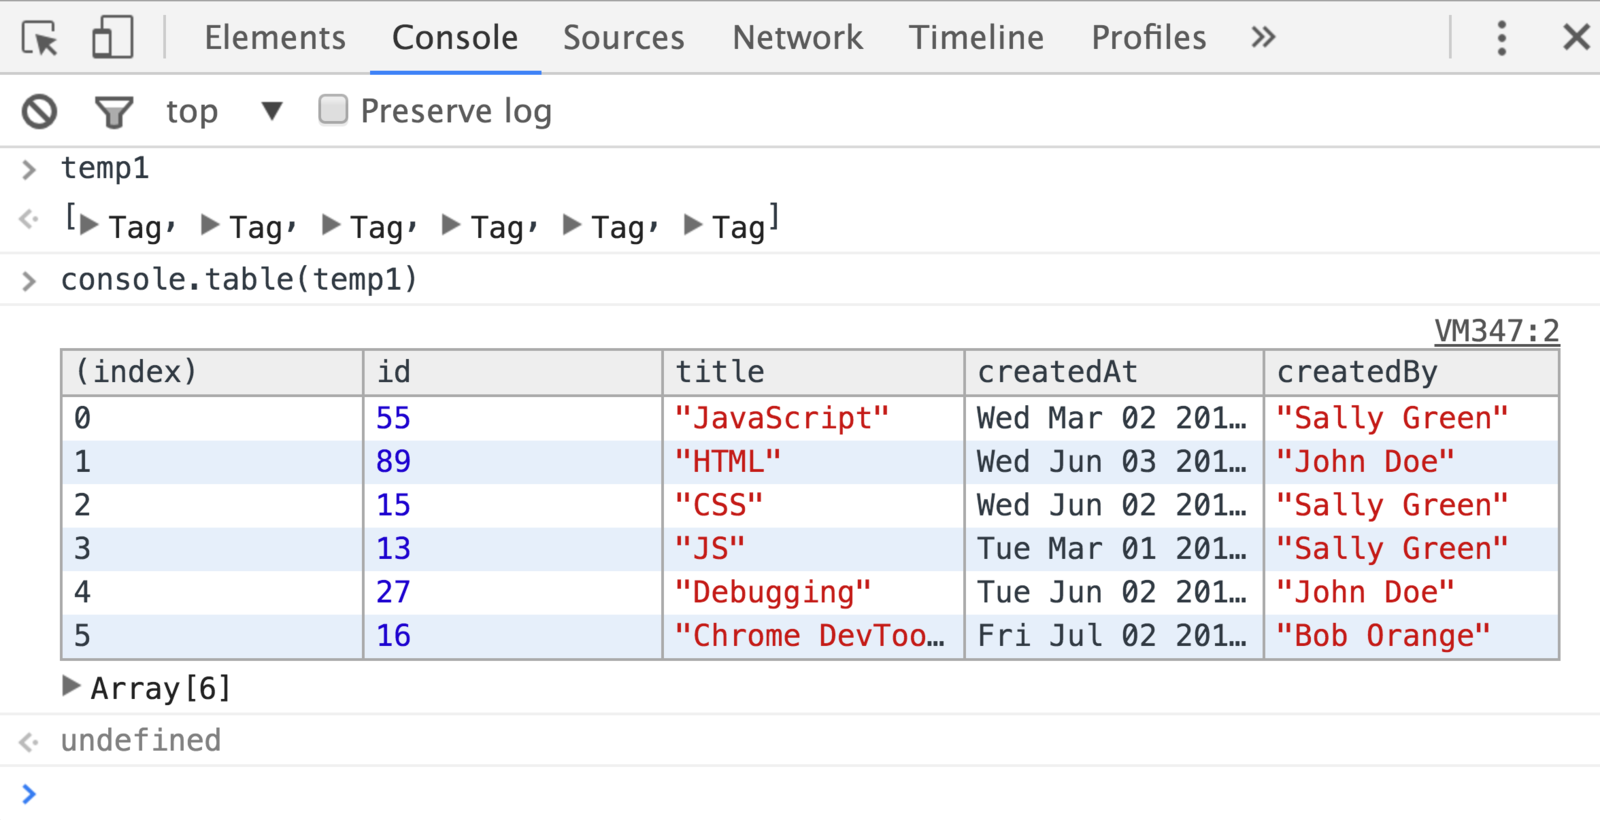
console.table
console.time("Loop");
for (var i=0; i<1000000; i++) { }
console.timeEnd("Loop")
console.time

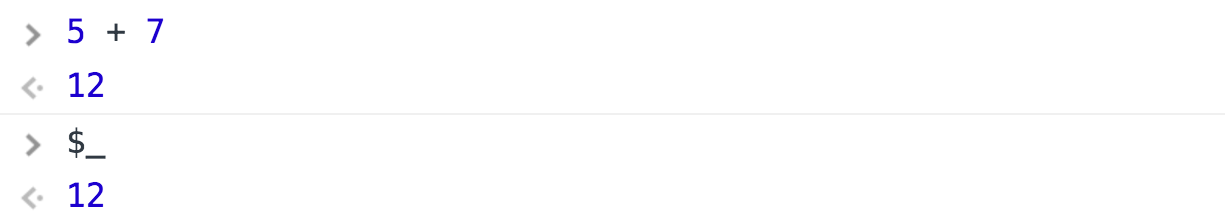
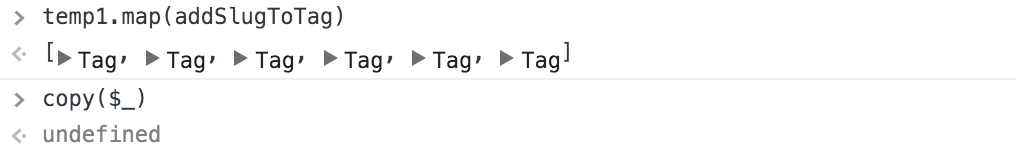
$_
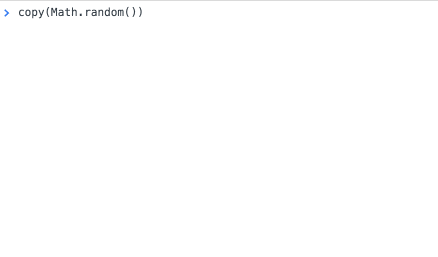
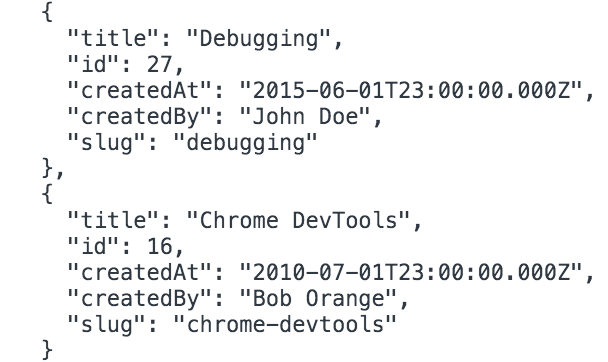
copy
Example
Example
Example
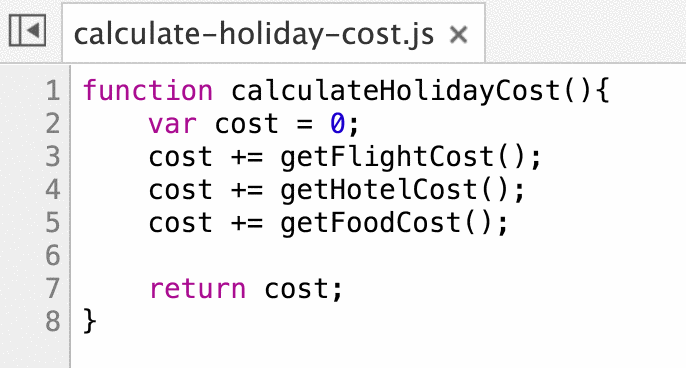
Source Maps
Source Maps
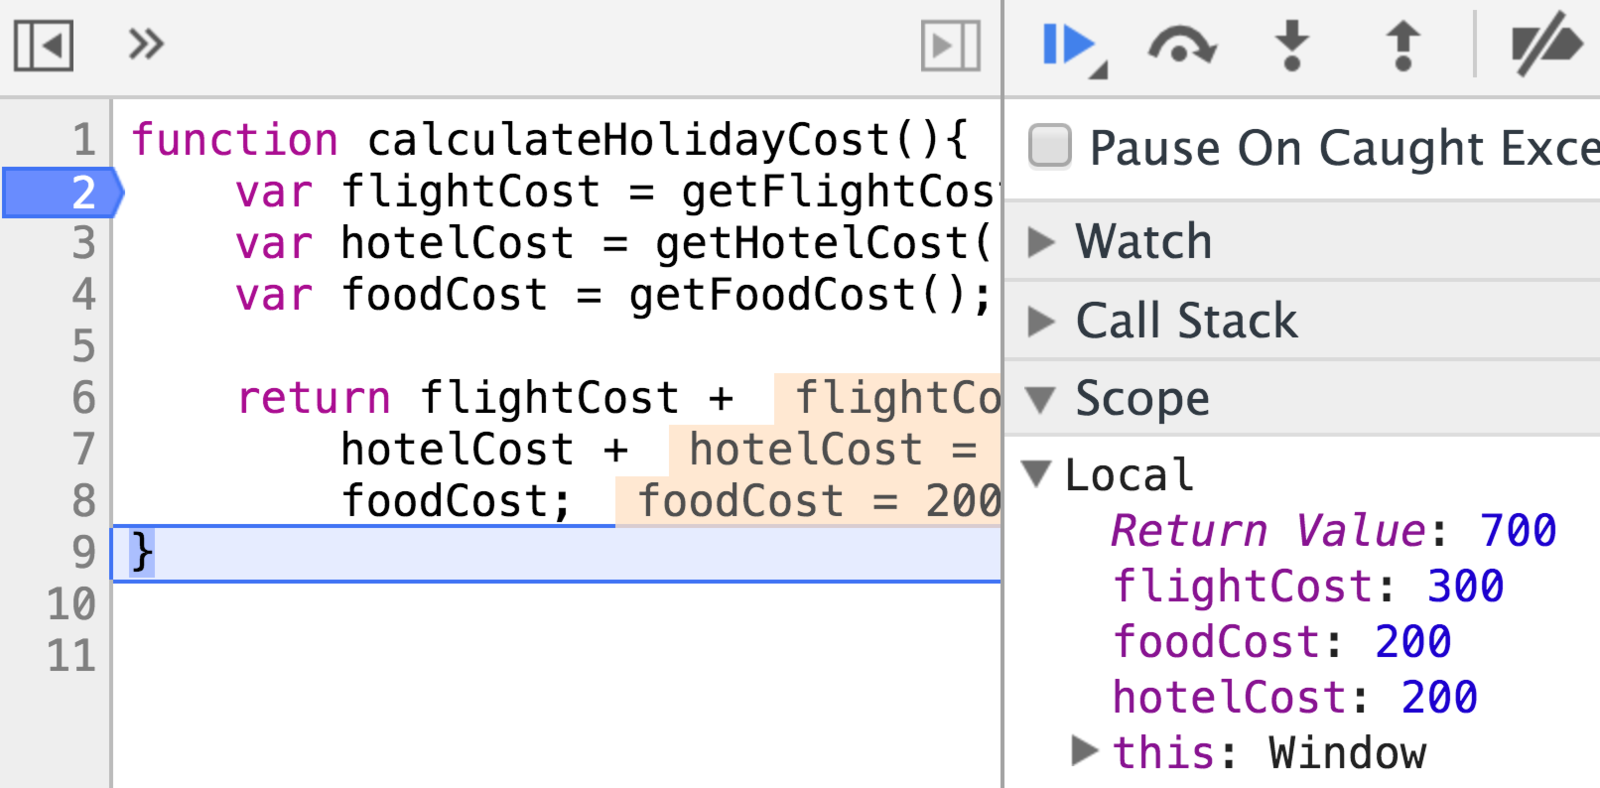
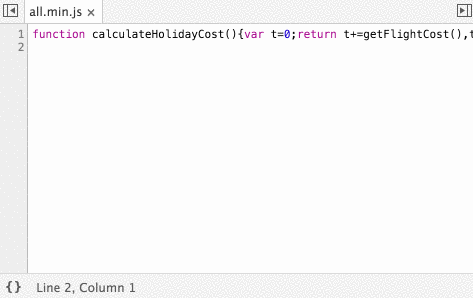
function calculateHolidayCost(){var t=0;t+=getFlightCost(
);t+=getHotelCost();t+=getFoodCost();debugger;return t}fu
nction getHotelCost(){return parseFloat("GBP200")}functio
n getFlightCost(){return 300}function getFoodCost(){retur
n 200}function onButtonClick(){var t=document.getElementB
yId("value");t.innerHTML=calculateHolidayCost()}
Prettify Code
Source Maps
uglifyjs all.js
-o all.min.js
--source-map all.min.map
--mangle --compress
all.min.map
{
    "version": 3,
    "sources": [
        "calculate-holiday-cost.js",
        "get-hotel-cost.js",
        ...
    ],
    "names": [
        "calculateHolidayCost",
        "cost",
        ...
    ],
    "mappings": "AAAA,QAASA,wBACL,GAAIC,GAAO,CAMX...",
    "file": "all.min.js"
}
all.min.map
{
    "version": 3,
    "sources": [...],
    "names": [...],
    "mappings": [
        [0, 0, 0, 0],
        [8, 0, 9, 9, 0],
        [24, 0, 1, -5],
        ...
    ],
    "file": "all.min.js"
}
all.min.js
function calculateHolidayCost(){var t=0;t+=getFlightCost(
);t+=getHotelCost();t+=getFoodCost();debugger;return t}fu
nction getHotelCost(){return parseFloat("GBP200")}functio
n getFlightCost(){return 300}function getFoodCost(){retur
n 200}function onButtonClick(){var t=document.getElementB
yId("value");t.innerHTML=calculateHolidayCost()}
//# sourceMappingURL=all.min.map
Source Maps
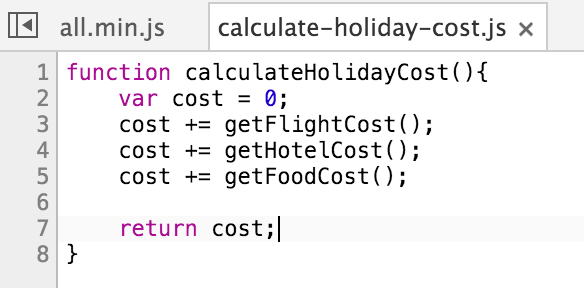
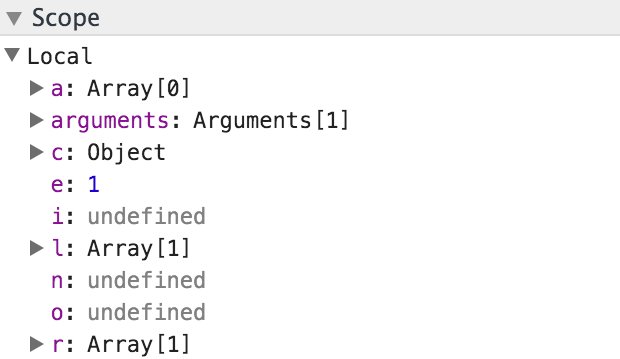
Source Maps
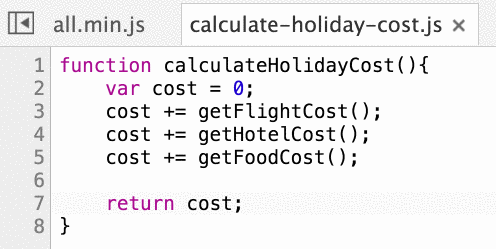
Source Maps
function calculateHolidayCost() {
    var t = 0;
    return t += getFlightCost(),
      t += getHotelCost(),
      t += getFoodCost()
}
Source Maps
Remote Debugging
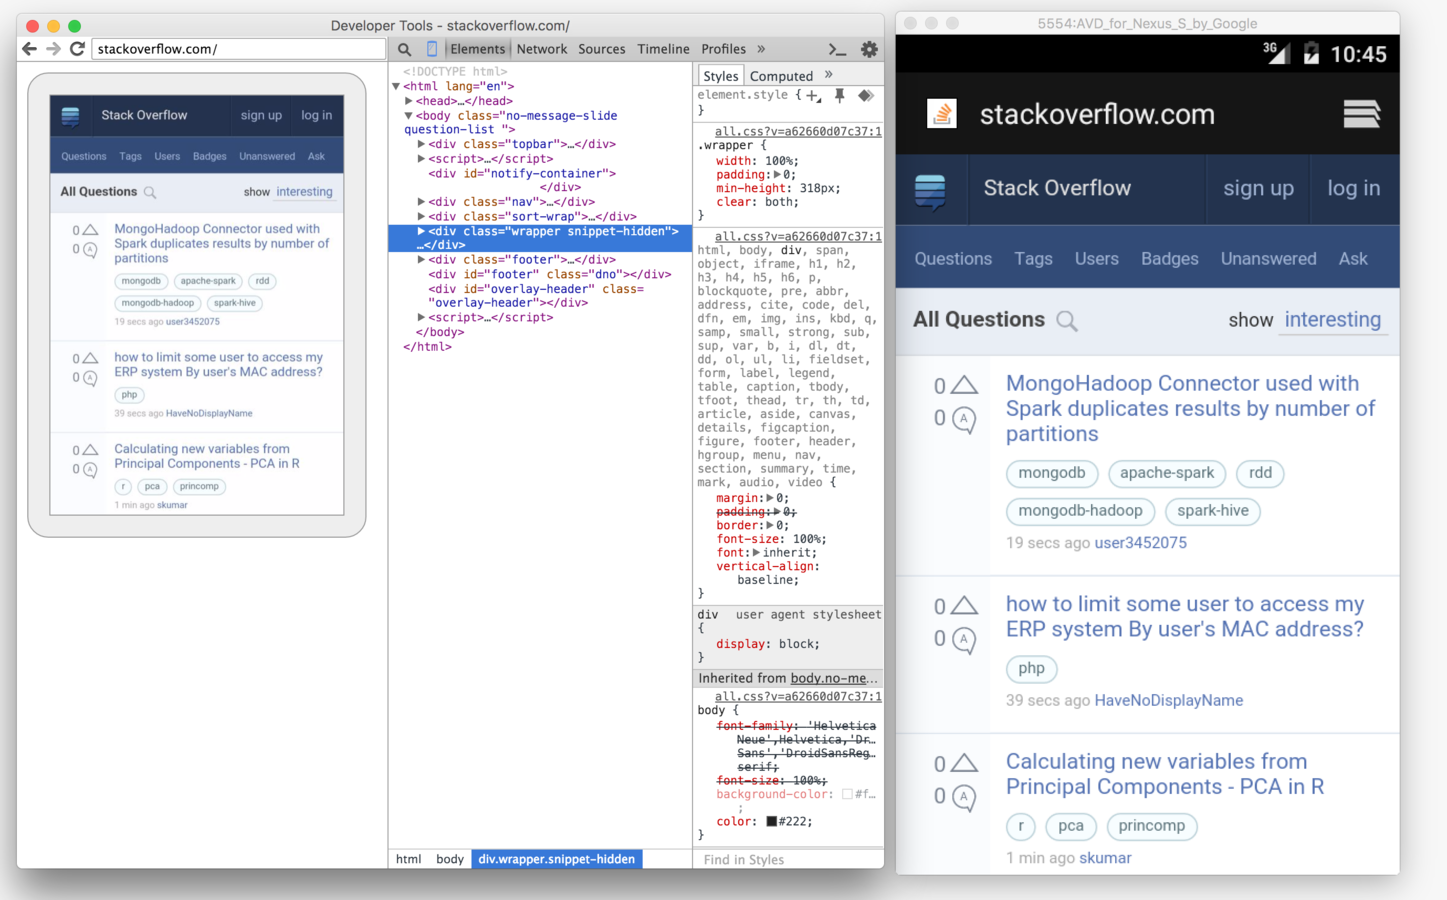
DevTools Is A Web App
Inspecting DevTools

1.
2. Cmd + Opt + I
Remote Debugging
<=> WebSockets <=>
Chrome Desktop
DevTools
(Chrome Debugger Protocol)
Remote Debugging
<=> WebSockets <=>
Chrome Desktop
Chrome on Android
Node
DevTools
(Chrome Debugger Protocol)
Node-Inspector
$ node-debug test.js
Virtual Android Device
Remote Debugging
<=> WebSockets <=>
Chrome Desktop
DevTools
Sublime Text
WebStorm
IntelliJ IDEA
Visual Studio Code
(Chrome Debugger Protocol)
Sublime WebInspector
Visual Studio Code
Learn More
https://umaar.com/dev-tips/
Thanks
@mattzeunert
JS London April 2016
By Matt Zeunert


