Matplotlib is one of the most important packages for Data Visulation


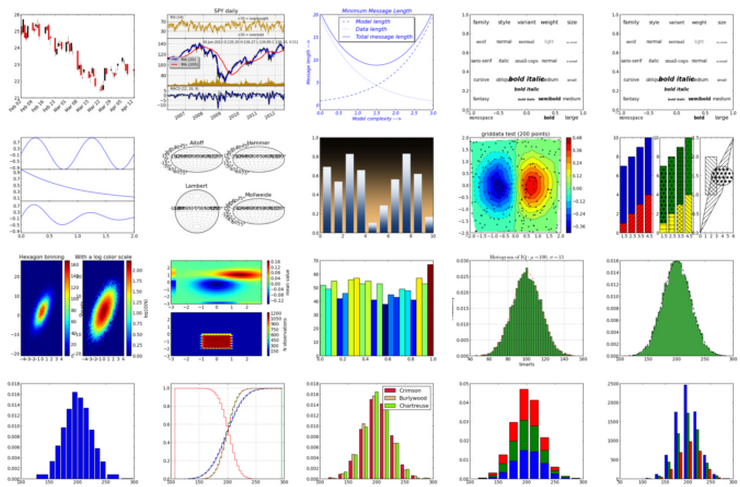
- One of the first package : first release in 2003
- originally developed by John D. Hunter
- contains several noticeable sub.packages :
Seaborn
GGplot


Pyplot
import matplotlib
import matplotlib.pyplot as plt
import seaborn as sns
import ggplot
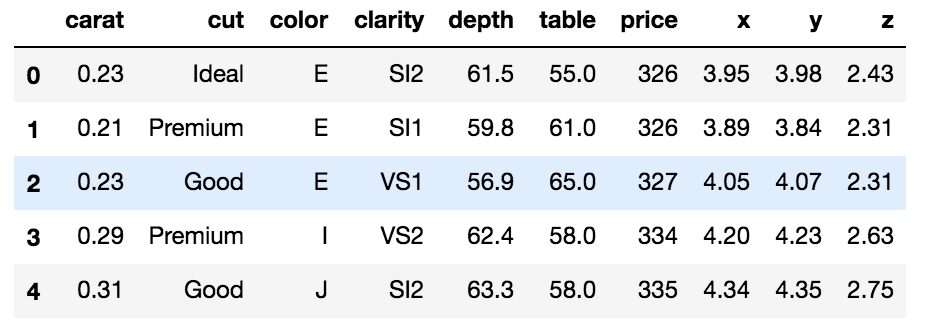
from ggplot import diamonds


%matplotlib inline

import matplotlib
import matplotlib.pyplot as plt
import seaborn as sns
'Types of Plots :'
plt.hist()
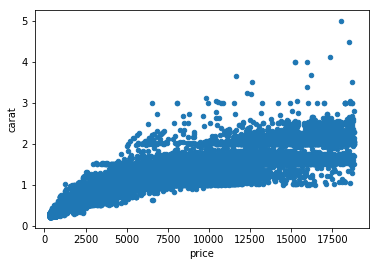
plt.scatter()
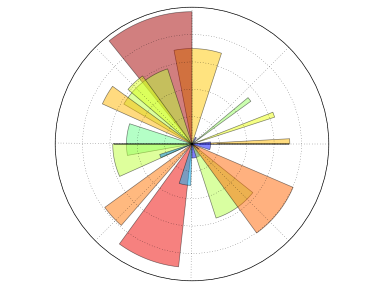
plt.pie()
plt.bar()
...Use the alias of pyplot : plt along with the type of plot you want
The Basics Commands in Matplotlib
plt.show()

-> 'Display the plot(s)'

plt.clf()

-> 'Clean the plot so that you can start fresh'
plt.scatter(
x = diamonds['price'],
y = diamonds['carat'])
plt.show()plt.scatter(
x = diamonds.price,
y = diamonds.carat)
plt.show()Call variables from a dataset
1. Using brackets
2. Using dots
plt.scatter(
x=diamonds.price,
y=diamonds.carat)
ggplot(data=diamonds)
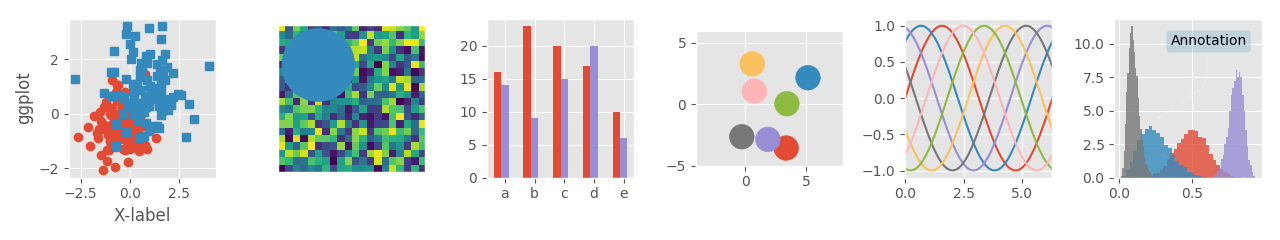
+ geom_point(aes(x=price, y=carat))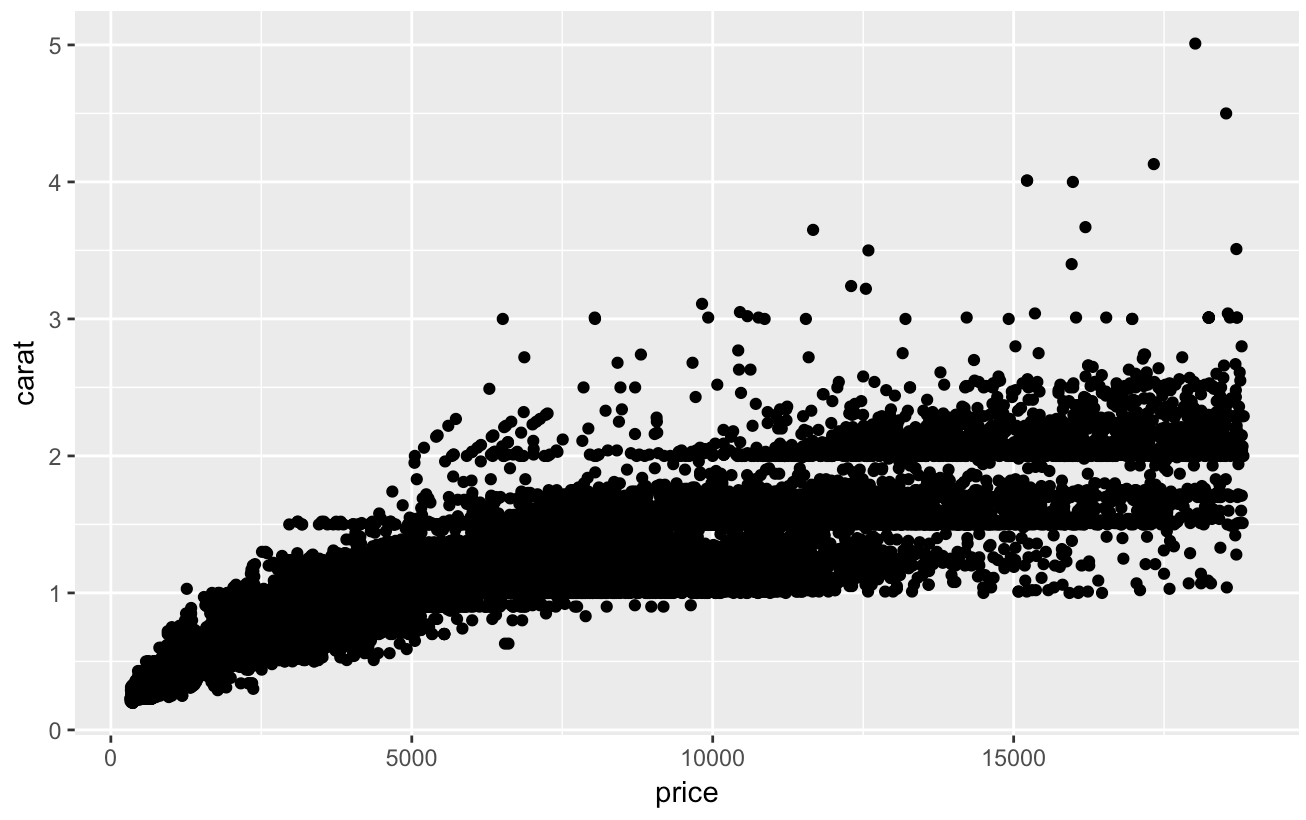
matplotlib.style.use('ggplot')- Customize matplotlib to your own taste
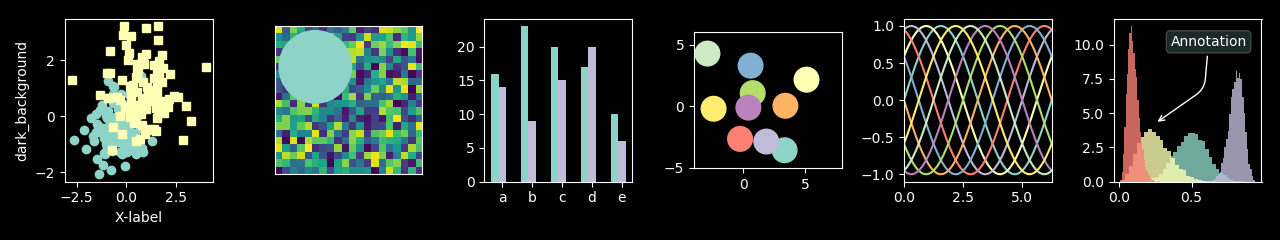
matplotlib.style.use('dark_background')MatplotLib
By Maxime Lgd


